Abstract
REDCRAFT, a new open source software tool that accommodates the analysis of RDC data for simultaneous structure and dynamics characterization of proteins is presented in this article. Simultaneous consideration of structure and motion is believed to be necessary for accurate representation of the solution-state of a protein. REDCRAFT is designed to primarily utilize RDC data from multiple alignment media in two stages. During Stage-I, a list of possible torsion angles joining any two neighboring peptide planes is ranked based on their fitness to experimental constraints; in Stage-II, a dipeptide fragment is extended by addition of one peptide plane at a time. The algorithm adopted by REDCRAFT is very efficient and can produce a structure for an 80 residue protein within two hours on a typical desktop computer. REDCRAFT exhibits robustness with respect to noise and missing data. REDCRAFT describes the overall alignment of the molecule in the form of an order tensor matrix and is capable of identifying peptide fragments with internal dynamics. Identification of the location of internal motion will permit a more accurate structural representation. Experimental data from two proteins as well as simulated data are presented to illustrate the capabilities of REDCRAFT in both structure determination and identification of the dynamical regions.
Keywords: simultaneous, backbone, protein, structure, motion, residual, dipolar, dynamics
2 Introduction
Structural elucidation, including complete structures of individual domains of proteins as well as the assembly of biomolecular complexes, is often a requisite step in understanding fundamental physiological processes, or in the design of drugs to combat a disease. Therefore, the development of methods leading to rapid, cost-effective structure elucidation is an important task. In addition, it is important to develop methods that can simultaneously deal with internal motion in these assemblies. Motions on a physiologically relevant time scale have been suggested to play an important role in the biological function [6; 7]. Traditionally, characterization of inter-molecular dynamics has been separated from structure elucidation, increasing the cost and time of these studies. Furthermore, conceptually, it is difficult to separate structure from dynamics since observables used for structure determination are perturbed by motion, and therefore any attempt at structure elucidation that disregards the dynamics (or vice versa) may produce faulty results [8]. In conventional high resolution NMR the set of experiments required to assess the dynamic properties of a molecule are often disjoint from the set of experiments required for the structural elucidation. Therefore there is ample room for improvement in NMR-based structural and dynamic analysis. The recent reintroduction of residual dipolar couplings (RDC) [1; 2] to the biomolecular NMR provides one opportunity for this improvement, provided the appropriate analysis tools are available. The success of REDCRAFT in structure determination of protein backbone structure has been previously demonstrated [48; 49]. In this report we describe the algorithm of this analysis in detail while introducing its ability in identification of internal motion during the course of structure determination.
REDCRAFT (REsidual Dipolar Coupling Residue Assembly and Filtering Tool) is a new open source analysis tool that accommodates the analysis of RDC data for simultaneous structure characterization and identification of dynamics of proteins and polypeptides. Innate properties of RDC data combined with our proposed analysis (REDCRAFT) provides the features listed below:
A simplified force field and therefore energy landscape.
True De Novo structure determination without any a-priori knowledge of the secondary structural elements; only reliance on the ideal structure of a peptide plane is used.
Simultaneous structure determination and identification of internal motion.
Robustness with respect to error and missing data.
Practical computational time complexity.
Since the task of protein structure determination is a computationally demanding one, REDCRAFT has been implemented with a Linux Cluster in mind. Users of this software can perform relatively superficial analysis on a desktop computer and then easily move to a more thorough search on a Linux Cluster. The complete software binary, source code and manuals are available for public access via the web at http://ifestos.cse.sc.edu. REDCRAFT is distributed with interfacing tools to provide REDCAT [4] input files, and XPLOR-NIH [5] constraint files for further refinement.
3. Theoretical Background and Preliminaries
3.1. Residual Dipolar Coupling
Residual dipolar coupling (RDC) had been observed as early as 1963 [9] in a nematic liquid crystal environment, but a number of recent applications [1; 2; 10–12] have ignited their widespread use in characterization of biomolecules. More specifically, RDCs have been used in studies of carbohydrates [13; 14], nucleic acids [15; 16] and proteins [14; 17–22].
RDCs arise from the interaction of two magnetically active nuclei in the presence of the external magnetic field of a NMR spectrometer [1–3; 23]. This interaction is normally reduced to zero in simple aqueous solutions due to the isotropic tumbling of molecules. The introduction of partial order by slight molecular alignment will result nonzero RDC observables. This partial order can be introduced by exploiting the inherent magnetic anisotropic susceptibility of the molecule [1], incorporating artificial tags with high magnetic anisotropic susceptibility [24], or using a liquid crystalline media [25]. Once restored, RDCs can be measured relatively easily and represent an abundant source of highly precise information on parameters such as the relative orientations of different inter-nuclear ‘bonds’ within the molecule or internal motion. Equation 1 describes the time average of the RDC interaction between a pair of spin ½ nuclei as observed through contributions to the splitting of resonances in the absence of spin decoupling.
| (1) |
Here, Dij denotes the residual dipolar coupling in units of Hz between nuclei i and j, γi and γj are nuclear gyromagnetic ratios, r is the internuclear distance (fixed for directly bonded atoms) and θij(t) is the time dependent angle of the internuclear vector with respect to the external magnetic field. The angled brackets signify the time average of the quantity. When a sufficient number of RDC data are assigned to specific locations in a known structure, the elements of the order tensor can be obtained [4; 12; 26–28]. Conversely, given a structure and the elements of the order tensor, values expected for various RDCs can be calculated easily.
RDCs play an increasingly important role in the NMR structure determination because of their unique advantages over the traditional NOE data [29]. However, structure determination primarily based on RDC data requires new programs that operate in fundamentally different ways from those that use NOE data. Some of these have been put forward [21; 22; 30–34]. Information richness and complexity of RDC data however, continue to be a challenge for the analysis tools in existence today. Additionally, development of new experimental methods of acquiring RDC data with improved accuracy and precision necessitates a parallel pursuit of information extraction methods.
3.2. Molecular Frame, Alignment Frame and Order Tensor
Traditionally, upon successful determination of a structure, its atomic coordinates are described within some arbitrary coordinate system. The selection of a coordinate system is inconsequential since this structure is independent of any rotation or displacement within this frame. This arbitrarily selected coordinate system is referred to as the “molecular frame” (MF). On the other hand, since RDC data are capable of describing the preferred alignment of the molecule, a more descriptive frame can be selected in which the structure of the molecule of interest is described in the appropriate orientation. Here we define this more descriptive frame as the “principal alignment frame” (PAF).
Alignment properties of a molecule can be described in the form of an order tensor matrix (OTM). Reformulation of Eq 1 in a matrix form clearly collects and defines the order tensor matrix as shown in Eq 2. Here X is the normalized coordinates of the vector between the pair of interacting nuclei and S is a 3×3 order tensor matrix encapsulating the alignment properties of the molecule. Jacobi [35] transformation of this symmetric and traceless matrix can isolate two important types of information. The three elements of the resulting diagonal matrix Sxx, Syy and Szz) are referred to as the principal order parameters (POM) and reflect the strength of alignment along each of the principal axes x, y and z within the PAF. The R matrix contains information about the orientational relationship between any arbitrary MF and the PAF in terms of three Euler angles, α, β, and γ. Analysis of these two parts will allow assessment of the strength of alignment for various parts of a molecule (and therefore their relative motions) and the preferred direction of alignment with respect to an arbitrarily selected MF. This order matrix can also be used to calculate theoretical RDC observables for any additional parts of a structure.
| (2) |
| (3) |
Various methods for obtaining the order tensor matrix describing alignment of a subject protein have appeared in the literature within recent years [4; 28]. While these methods provide robust and reliable means of obtaining the order matrix, they require an existing structure and assignment of the RDC data to specific sites. REDCRAFT is unique in that it provides a simultaneous description of the order tensor and the molecular structure.
The dependence of an order tensor on the overall motion of a rigid entity has been mathematically illustrated previously [1; 36; 37]. While it is relatively straightforward to determine the perturbation of a given tensor by a well defined internal motion, the reverse is much more difficult to accomplish and is the subject of numerous investigations [38; 39]. REDCRAFT is able to identify regions that exhibit internal motion and allows structural characterizations of these regions with different alignment tensors, although it will not provide a full description of the nature of the internal motion. Isolated structure characterization of different regions of the same protein will provide a more accurate and meaningful characterization of the structure while allowing for further study of exact nature of the internal motion through comparison of the two order tensors [36].
3.3. Order Tensor Solution
The orientation of any rigid molecular entity is embedded within the OTM as shown in equations 2 and 3 above. This information can be extracted from a linear system of equations shown in Equation 4. The independent elements of the order tensor matrix (OTM) are represented here by a reduced set of sij elements using the symmetric and traceless properties of the OTM. The Cartesian representation of each individual interaction vector is denoted by (xi, yi, zi) while the experimentally determined dipolar couplings and error in measurements are denoted by Di and εi respectively. Dmax is the maximum observable dipolar coupling for a particular pair of nuclei at 1Å separation and r is the actual separation of the two interacting atoms. Note that our representation of the RDC interaction slightly differs from those previously presented in the literature. Usually, the RDC interaction is described in terms of the direction-cosines of the interacting vectors and exhibits a r−3 dependence on the distance of the interacting pair of atoms. Our representation is more computationally friendly since evaluation of trigonometric terms is costly. During the course of structure calculation, it is typical for the set of equations presented in Eq 4 to be calculated on the order of billions of times.
| (4) |
The system of equations described in Equation 4 can be solved using singular value decomposition (SVD) [35]. This method can efficiently find the best OTM solution for an under-determined or over-determined system [4; 28; 35; 40]. This order tensor matrix can then be used to back calculate RDCs as described previously [1; 4; 28]. During the assembly of peptide planes, the fitness of any trial geometry can be established by obtaining an RMSD error between the experimentally collected and the back calculated RDCs. This score can be interpreted as the fitness of a proposed structure to the experimental data.
3.4. Experimental Data
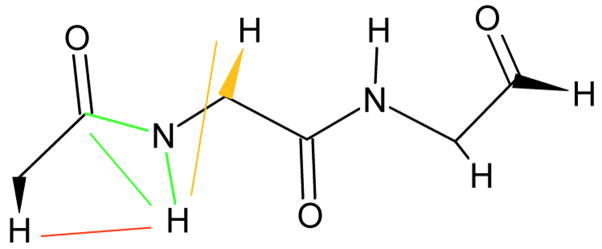
REDCRAFT is designed to perform the task of backbone structure determination of a protein primarily based on RDC data. The current version of REDCRAFT can accommodate as many as six RDC data per peptide plane as shown in Figure 1. Here RDCs illustrated in green represent pieces of data that can be collected via the N-H amide group for any peptide plane (except one involving the proline nitrogen). Yellow and red data will not be available, or are omitted for peptide planes that are at the C or N termini of a fragment under study. The maximum number of RDC data available for analysis of a fragment of size n amino acids in the current REDCRAFT implementation is 6n-3. The data reported for glycines are slightly different from other amino acids. This is due to the fact that glycines possess two Hα protons. Experimentally the sum of RDCs (DCα1-Hα1 + DCα2-Hα2, DHα1(i−1)-HN + DHα2(i−1)-HN, and 3JHN-Hα1 + 3JHN-Hα2 ) can be measured more accurately from the separation of the outermost peaks in a four line multiplet while two inner peaks are often overlapped.
Figure 1.
Illustration of RDC data collected for our experiments. Green data are those that can be collected for all residues of a fragment. The red and yellow data will be ignored for the beginning and last residues of a fragment respectively.
REDCRAFT is capable of analyzing RDC data collected from multiple alignment media. Data from multiple alignment media serve to resolve a number of potential problems [43]. The first problem inherent to the RDC observable is its non-uniform sensitivity to the orientation of vectors in the alignment frame. Combining data from a number of independent alignment media could assist in resolving this problem since the same vector located in the insensitive region of the first alignment is likely to fall into a more sensitive region of the second alignment. The second problem which is also inherent to the nature of the dipolar interaction is its insensitivity to inversion about each of the principal axes of alignment tensor. This will cause degeneracies in allowed torsions. This phenomenon is especially problematic when the Cα-C′ bond coincides with a principal axis. A 180° inversion about this bond can change an α-helical like geometry to a β-strand like geometry without violating any of the experimental constraints.
In addition to RDCs, REDCRAFT is capable of utilizing other types of data such as distance constraints or three bond scalar coupling 3JHN-H [41; 42] data. A small set of coincidentally acquired NOE data can restrict translational degrees of freedom for fragments by utilizing programs such as Xplor-NIH [5] as demonstrated before [48; 49]. The amino acid designation in REDCRAFT has been simplified to include only three classes based on side chain characteristics, glycine, proline or alanine (anything that is not a glycine or proline is considered to be an alanine). This is possible since our investigation is focused on the structure determination of protein backbone and the data utilized are originated from the backbone atoms of the protein. Finally, the current version of REDCRAFT requires a-priori knowledge of RDC assignments.
3.5. Treatment of Error
Since SVD analysis places equal weighting on each RDC entry, proper treatment of the experimental error is necessary. Proper treatment of error is especially important since RDC data sets utilized by REDCRAFT are heterogeneous in the following two ways:
RDC data sets span different ranges depending on the gyromagnetic ratios of the two interacting nuclei and their separation distances. For example, the maximum observable RDCs for Cα-Hαand C′-N differ by more than an order of magnitude.
RDCs are collected from distinctly different experiments with different errors due to varying sensitivities, spectral resolutions, etc.
These problems can be rectified through appropriate scaling. The scaling factor intended to alleviate the first problem is simply derived from the ratio of the quantities Dmax/r3 using N-H as the internal reference. The distance between two interacting pair of atoms such as Hα and HN may depend on the local structure of a protein and can be calculated during the course of structure calculation. Simple scaling based on the mentioned factor should be adequate for proper treatment of inhomogeneous sets of RDC data under ideal conditions. However under more pragmatic situations, RDC data acquired from different NMR experiments may not adhere to similar acquisition conditions such as signal to noise and digital resolution, resulting in different errors for different measurements. Our implementation of REDCRAFT enables this degree of freedom by reporting independent set of errors not only across different experiments but also for an individual datum. Therefore, another scaling factor is introduced to alleviate the second problem by normalizing the estimate of experimental error supplied along with each RDC to the N-H RDC error. The final scaling factor (Sn) can be calculated by combining the above two scaling factors as shown in Equation 5, where X denotes observables other than N-H RDCs and ε′ denotes the estimated experimental error for observation X after internal normalization to the N-H observables. The final scaling factor Sn is independent of r and can therefore be applied to non-bonded atom pairs.
| (5) |
REDCRAFT calculations assume standard covalent geometries of peptide planes and the absence of motion within these planes. Violations of these assumptions can introduce additional modeling or structural noise. Variations of N-H bond lengths by just 0.02Å, for example, would introduce a 6% error. Errors due to a uniform local motion would be absorbed into magnitudes of order parameters. However, it has been documented that local oscillations of N-H bonds are larger than those for C-N bonds [44; 45] and could potentially introduce additional errors. To compensate for these modeling errors we often set generous estimates of error (10% of the range of couplings observed) even when measurements are more precise. This error can be increased or decreased based on the quality of observed data.
Orientational sensitivity of RDC data can also be cited as a component influencing the outcome of the analysis of RDC data. For example, 1 Hz experimental error would translate to a much smaller spatial uncertainty if the vector of interest is oriented close to 54.7° from all three principle axes (the magic angle) versus if the vector is parallel with any of the three principal axes of the alignment. This problem is difficult to address because of the lack of a priori knowledge of orientation of an interaction vector within the PAF. RDC data from multiple alignment media is anticipated to mitigate the effect of this type of variation since a vector that falls in insensitive region of one alignment medium may be likely to fall in a more sensitive direction of the other alignment media.
4. REDCRAFT Algorithm
REDCRAFT takes a fundamentally different approach to structure determination of macromolecules compared to the ones in existence. The general approach adopted by REDCRAFT, avoids the exponential complexity of the protein folding problem by eliminating a large number of disallowed geometries quickly. For example, elimination of a single torsion angle at one residue within a fragment of size P peptide planes can eliminate a total of N2(P-2) geometries, where N is the number of possible geometries at each residue. REDCRAFT operates in two distinct stages: Stage-I and Stage-II. During Stage-I, a list of all possible torsion angles joining any two neighbouring peptide planes is first pruned (using data such as scalar couplings and Ramachandran space) and then ranked based on structural fitness. Stage-II of the REDCRAFT extends a given fragment of size N peptide planes (initially a dipeptide seed) by addition of one peptide plane at a time. The planes must be oriented in a way to satisfy the RDC data; in effect this restricts possibilities for φ and ψ angles connecting the planes. If the entire protein can be assembled in this way, an accurate backbone structure is produced. However, in practice the structure elucidation of the protein backbone is accomplished through the assembly of fragments resulting from natural termination points such as prolines or loops (due to sever lack of RDC data), or presence of internal motion. Proper orientation of different fragments in space with respect to each other can be obtained by superimposing the alignment tensors for each fragment. A minimum set of NOEs and other fragment connectivity restraints can be used to translate individual fragments into positions appropriate for a good representation of the structure of the whole protein. These two stages are discussed in detail as follows.
4.1. Stage-I - Constructing Initial Local Geometry Lists
The first stage of REDCRAFT aims to generate and rank the list of possible torsion angles connecting two adjacent peptide planes based on the observed experimental data. The initial list can be prepared in observation of information such as a-priori knowledge of the secondary structural elements or torsion angle constraints [20; 46]. In the absence of these information, the current version generates an exhaustive list of all possible torsion angles between each set of connected peptide planes in 10° steps. This will give rise to an initial list consisting of 1296 (36×36) distinct sets of torsion angles for each dipeptide plane. Then this initial list may be further reduced using the Ramachandron filter that eliminates torsion angles that are not consistent with the Ramachandran space defined for a given amino acid type. The acceptable space for each of the currently supported amino acid types is based on previous results [47]. In addition to the Ramachandran statistics, when 3JHN-Hα scalar couplings are available, they are used to further eliminate unfit phi torsion angles according to the Karplus equation [42].
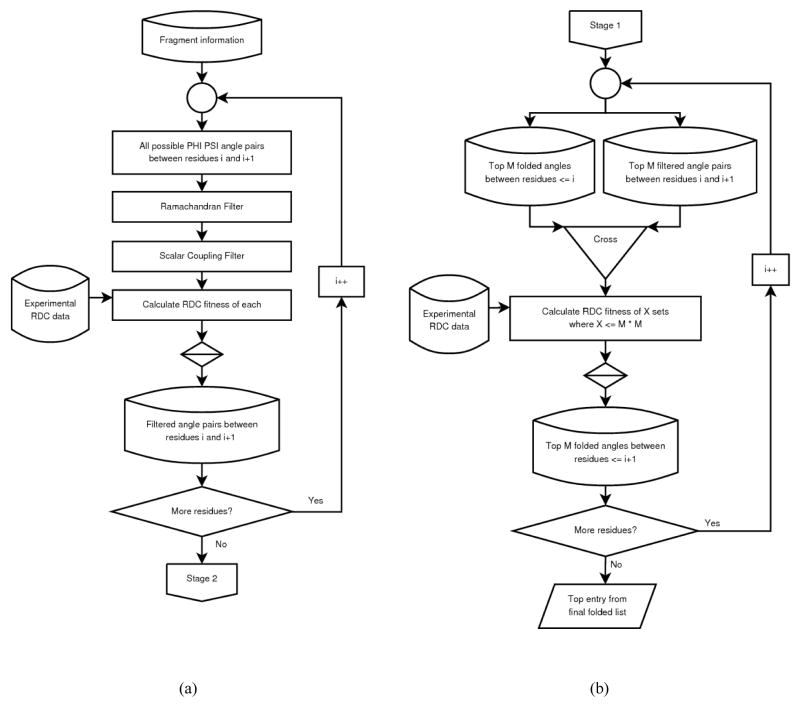
Stage-I is concluded by ranking the surviving list of torsion angles for each dipeptide plane. Here, local geometries are ranked based on the rmsd score calculated between the experimental and back-calculated RDC data. The geometry exhibiting the best agreement to the RDC data appear as the best ranked structure while the geometry exhibiting the worst score is placed at the bottom of the list. Although these lists normally contain a varying number of surviving geometries (nearly 100 entries) for different dipeptides, to facilitate further discussion we will assume this number to be constant and denoted by N. These lists of acceptable torsion angles between each pair of neighboring residues are carried to the Stage-II calculation. Stage-I analysis is fast and can be conducted on the order of minutes in application to a 100 residue protein on a typical desktop computer. This stage is also very flexible and users can design and integrate custom filters based on their specific data. The operational flowchart of the Stage-I is shown in Figure 2(a).
Figure 2.
Operational flow chart for the (a) stage 1 and (b) stage 2 of REDCRAFT analysis.
4.2. Stage-II – Extension of a Seed Peptide
Under ideal circumstances, the top entry of each list generated from stage-I could be used to describe structure of the unknown protein. However in practice, due to the presence of experimental error and structural noises, the top entry is almost always not the globally optimal structure. Good quality data will ensure the ascent of the correct structure toward the top of this list. Increasing level of noise will descend the correct structure toward the bottom of this list. The search for the globally fittest geometry is therefore the subject of the stage-II and constitutes the most computationally intensive portion of this program.
The operational flowchart of Stage-II is illustrated in Figure 2(b). Since it is practically impossible to consider every combination of torsion angles for fragments larger than five residues REDCRAFT operates through iterative addition of a peptide plane to the end of a seed fragment (initially a dipeptide unit). Addition of a peptide plane (i+1st peptide plane), which can assume N distinct conformations from the analysis of Stage-I to a fragment with top M candidates will create a total of M×N candidate fragments. The structural quality of a candidate is determined by calculating the agreement of experimental RDCs to the back-calculated RDCs using the best order tensor solution obtained as described before [4; 28], and then it is used to rank a new list of candidates for the fragment of size i+1 peptide planes. By considering only the M most favorable sets of angles for the section of the fragment that has already been evaluated, an exponentially large set of unfavorable geometries are eliminated. A large M will result in a more thorough and exhaustive search of possible geometries at the cost of longer execution time, while a small M will constitute a superficial search with very short computation time. The depth of search is normally selected to be a number less than 1000 for good quality data and 1000–10000 for relatively noisy data. Practically, addition of a peptide plane will often create in excess of 1,000,000 structures for evaluation, of which, the top 1000–10,000 survivors (depending on the search depth) propagate to the next round of expansion. Fragment extension continues iteratively as shown in Figure 2(b) until arrival of a termination condition. This algorithm renders REDCRAFT much more immune to errors and missing data. Initially, the true structure may not be the most optimal point, but is carried forward as a viable solution during the early rounds. During fragment expansion, additional data will elevate the true structure from an early suboptimal geometry to the global optimal solution. It is important to reiterate that sources of error are not only the experimental uncertainties, but also include our assumptions of standard geometries of peptide planes and the absence of motion within these planes. Deviations from these assumptions can introduce additional modeling errors.
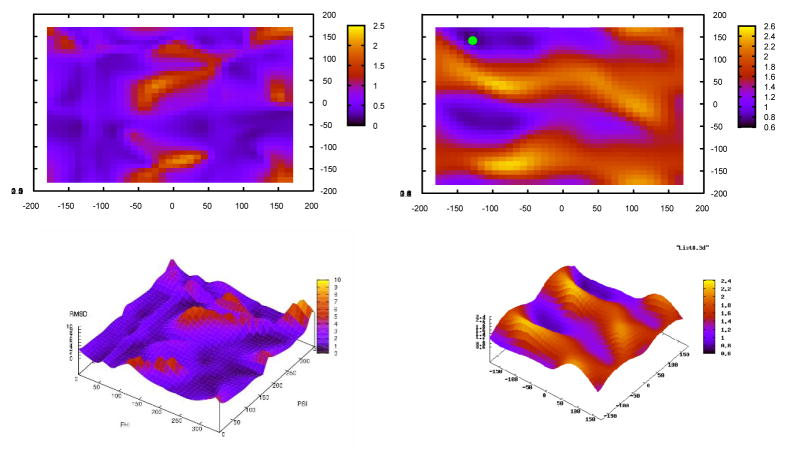
It is appropriate and necessary to study the topography of the RDC penalty landscape to justify our optimization strategy. Here we use data from Rubredoxin because this protein produces data of highest quality. Combining RDC data from peptide planes 2 and 3, an energy landscape can be constructed as a function of the connecting torsion angles. Figure 3(a) illustrates the rmsd score landscape between the back-calculated and experimentally collected data for any given combination of the torsion angles. The torsion angles corresponding to the solution structure of this protein is shown with a green dot in Figure 3(b). Figure 3(b) illustrates the same energy (rmsd score) landscape as Figure 3(a) using RDC data from peptide planes 2–8, where all torsion angles except the first set are fixed. It is clear that a meaningful penalty landscape for torsion angles connecting peptide planes 2 and 3 emerges only after the inclusion of data from five additional peptide planes. Premature determination of the torsion angles joining these two peptide planes based on local data is at the risk of sever error. This phenomenon can be observed with even the most meticulously collected data and it therefore necessitates implementation of the stage-II of our search.
Figure 3.
Residual Dipolar Coupling energy landscape for torsion angles of the second residue (a) using data from peptide planes 2 and 3, (b) using data from peptide planes 2–5.
5. Results
Data from two previously reported proteins are presented here to illustrate REDCRAFT’s features. The first protein consists of 53 residues and is a Zn-substituted, triple mutant (W3Y, I23V, and L32I) of Rubredoxin (PDB code 1RWD) from Pyrococcus furiosus. The second protein, PF1061 (PDB code 1SF0) is also from P. furiosus and is a 9kDa protein that was previously not well annotated, and had a nearest structurally characterized homologue with only 31% sequence identity. For more information regarding the details of biological findings, sample preparation, data collection and analysis for these two proteins, please refer to the following publications [14; 48; 49].
The data from Rubredoxin will be used to illustrate the efficient construction of a peptide backbone structure while examining the effect of missing data for a small fragment. The data from PF1061 will be used to illustrate simultaneous structure characterization and identification of internal motion. While our analysis is potentially capable of simultaneous assignment of RDC data to sequence specific sites by examining alternate sets of connectivities [14], here we only discuss the analysis of segments with previously established connectivities.
5.1. Robustness to Missing Data and Noise During Backbone Structure Determination
Our first discussion focuses on the topic of missing data by utilizing experimental data for Rubredoxin. Rubredoxin naturally divides into 6 fragments due to reduced number of experimental RDCs that occur at five prolines in the sequence (due to the absence of an H-N amide group on prolines). In addition, no experimental data was observed for residues 25–27. Here however, we illustrate the immunity of REDCRAFT to small sections of missing data by first partitioning it into two fragments (instead of 6) with each half (residues 2–24 and 28–50) approximately 25 residues in length. This exercise forces REDCRAFT to encounter a number of residues (such as prolines) with at most one RDC datum.
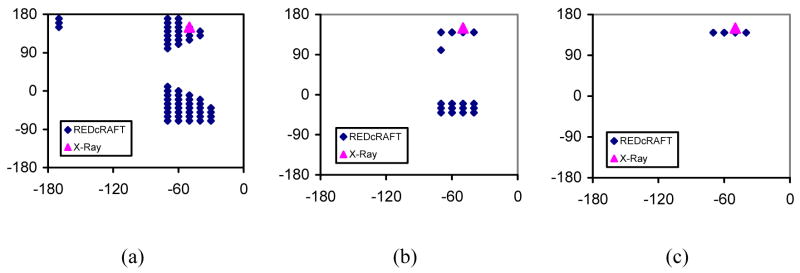
Structure determination of Rubredoxin proceeds normally as expected until the discovery of data-sparse regions such as prolines. Upon addition of a proline residue to the extending fragment, a great structural ambiguity is introduced at the torsion angles because of availability of only the Cα-Hα RDC at this peptide plane (Figure 4(a)). However, as the fragment extension proceeds, enough RDC data accumulate past the point of missing data, and ambiguities in geometries are eliminated. The correct geometry is elevated to the top of the surviving list of conformations (Figure 4(b) & (c)).
Figure 4.
Solution space produced by REDCRAFT at (a) position P33 with only Cα-Hα RDC, (b) position P33 after considering data from residue D34, (c) position P33 after considering data from residues D34 and D35.
Integration of these two fragments into a final structure is possible since RDC data can not only determine the local structure of a fragment but also the orientation of each fragment in space. Therefore, once the two fragments are constructed and oriented, the torsion angles of the three connecting residues can in principle be constrained. The local geometries of the three missing residues (25, 26 and 27) between the two fragments were constructed using a Monte Carlo technique (a utility included in REDCRAFT package). Sets of three torsion angles that are consistent with other available data (Ramachandran and scalar coupling filters) were randomly generated. These candidates were then tested to determine if they could connect these two fragments that were oriented in space by the alignment frames computed in REDCRAFT.
The backbone RMSD between 1BRF (a high resolution crystal structure of Rubredoxin) and each of the two fragments (residues 2–24 and 27–50) determined by REDCRAFT was less than 1.9 Å. After minimization within XPLOR-NIH, the final structure exhibited 1.81 Å (Figure 5) similarity with 1BRF structure. For a more detailed description of the minimization routine please refer to the following work
Figure 5.
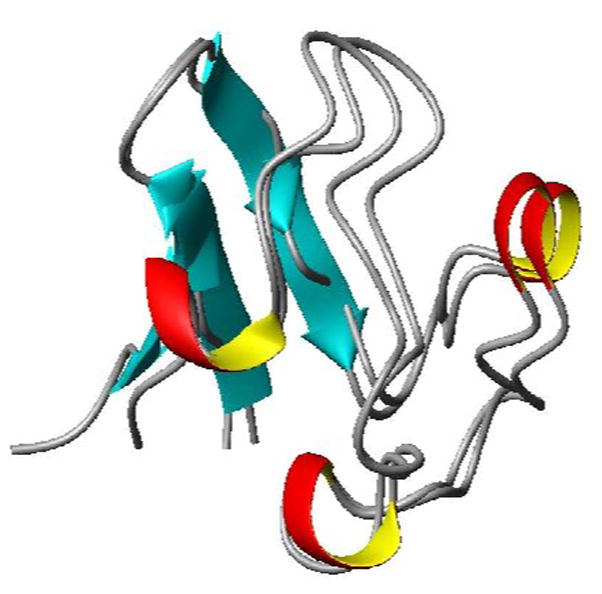
Cartoon plot of the structure obtained from REDCRAFT (1RWD) and the crystal structure of the wild type protein (1BRF) exhibiting 1.81 Å rmsd over the backbone Cα atoms of residues 1–50.
In order to establish the robustness of REDCRAFT to various levels of noise, we utilize simulated data for a helical protein (1A1Z) with controlled levels of uniformly distributed noise. The structure 1A1Z was used to generate RDC data with two hypothetical alignment tensors that reflect realistic alignments as shown in Table 2. Three noise levels of ±1Hz, ±2Hz, and ±3Hz were explored. It is important to note that these noise levels only become meaningful when compared to the range of the observed RDC data. For example, a ±2Hz error (windows size of 4Hz) constitutes nearly 55%, 15%, 39%, 8%, 33%, and 30% of the total range of observed RDC data originated from C-N, N-H, C-H, Cα-Hα, Hα(i)-H(i) and Hα(i-1)-H within the first alignment medium. REDCRAFT exhibits adequate immunity to the noise level as indicated in Table 1 below. This table lists the backbone RMSD between the original structure of 1A1Z and the structure obtained by REDCRAFT.
Table 2.
Properties of the two alignment tensors used for simulation of RDC data.
| α | β | γ | Sxx | Syy | Szz | ζ | |
|---|---|---|---|---|---|---|---|
| Medium-I | 10 | 20 | 30 | 2e-4 | 4e-4 | −6e-4 | 6.11e-4 |
| Medium-II | −45 | 145 | 100 | −3e-4 | −5e-4 | 8e-4 | 8.08e-4 |
Table 1.
Performance of REDCRAFT as a function of increasing level of noise in simulated data
| ±1Hz | ±2Hz | ±3Hz | |
|---|---|---|---|
| Backbone RMSD to 1A1Z | 0.56 Å | 0.57 Å | 0.6 Å |
5.2. Simultaneous Characterization of Structure and Identification of Motion
In this section, simulated data and experimental RDCs from a structural genomics target PF1061 are presented to demonstrate the capabilities of REDCRAFT in performing simultaneous structure characterization and identification of internal motion.
Simulated data
Simulated data can be invaluable in ensuring proper functioning of REDCRAFT. Controlled corruption of data through systematic introduction of noise or effect of motion on the RDC data will allow a proper study of the capabilities and susceptibilities of REDCRAFT. In addition, the utility of simulated data can be instrumental in providing a theoretical explanation to the outcomes of REDCRAFT analyses.
An 83 residue α-protein (PDB code: 1A1Z) has been arbitrarily selected as the subject of our studies. Helical proteins are believed to be more challenging for structure determination by RDC constraints. RDC data were generated for two alignment media with REDCAT [4] using the alignment properties listed in Table 2. The effect of motion on RDC data was emulated using the program REDCAT with a two state ±15° jump motion about the ψ angle of residue 71. A uniformly distributed random noise of magnitude ±1 Hz was added to the simulated RDCs.
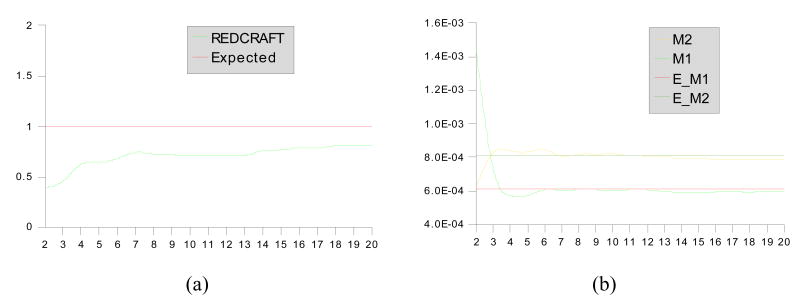
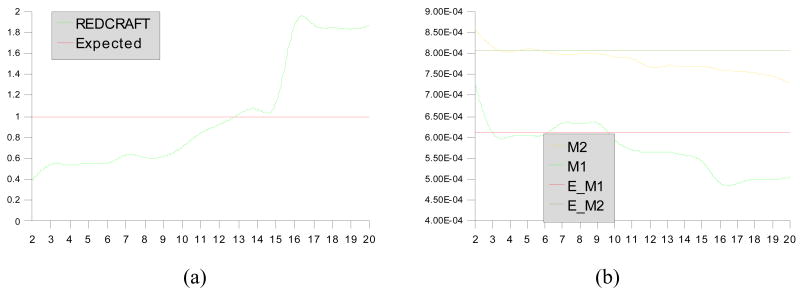
The symbols α,β, and γ in Table 2 correspond to the three Euler angles relating the MF to PAF. Sxx, Syy and Szz denote the three order parameters while the symbol ζ denotes the GDO value as defined before [1; 51]. The three order parameters obtained for each fragment can be combined to provide a measure of overall alignment called General Degree of Order (GDO). A higher GDO is indicative of stronger alignment. Rigid components of a molecule will report similar GDOs while fragments undergoing motion relative to the rest of the molecule will report a GDO with lower magnitude.
The synthetic data were used for structure determination by REDCRAFT. Figures 6 and 7 illustrate the results of REDCRAFT analysis performed on residues 1–20 and 60–80 of 1A1Z respectively. In these two figures, panels (a) show the RMSD score of the REDCRAFT obtained from comparison of the experimental data to the back calculated RDCs as a function of increasing fragment size, and panels (b) show the value of GDO obtained from the best structure as a function of increasing fragment size.
Figure 6.
Results of REDCRAFT for residues 1–20 of 1A1Z (static region). Panel (a) demonstrates the structural fitness as a function of increasing fragment size and (b) demonstrates the value of GDO as a function of increasing fragment size. The values M2, M2, E_M1 and #_M2 in panel (b) corresponds to value from M2, value from M1, Expected M1 and Expected M2 values respectively.
Figure 7.
Results of REDCRAFT from residues 60–80 of 1A1Z (dynamic region). Panel (a) demonstrates the structural fitness as a function of increasing fragment size and (b) demonstrates the value of GDO as a function of increasing fragment size. The values M2, M2, E_M1 and #_M2 in panel (b) corresponds to value from M2, value from M1, Expected M1 and Expected M2 values respectively.
When the data are originated from a relatively rigid portion of a molecule (as illustrated in Figure 6), an overall increase in the REDCRAFT score is initially observed as the fragment size grows. Increasing number of the experimental data versus degrees of freedom of the problem is the main contributor to this pattern. As the fragment size continues to grow, this pattern approaches and stabilizes around the expected error. A similar trend is observed for the GDO value. A fragment of sufficiently large size will provide a reasonably accurate GDO value similar to the value used during simulation of the RDC data. Figure 7, on the other hand, exhibits a completely different trend. From residue 60 to 70, the normal increase in the REDCRAFT score is observed. When extension of the fragment proceeds beyond the point of motion (residue 71), internal discrepancies emerge, indicating an inability to identify one single order tensor to describe the alignment of both portions (residues 60–70 and 71–80). This increase in the REDCRAFT score is at first subtle but becomes significantly large after inclusion of more data from the dynamical portion of the fragment. Peptide plane number 12 in Figure 7(a) corresponds to residue 71 of the fragment indicating the starting point of the internal dynamics. The lag observed in the significant increase of the REDCRAFT score (at peptide plane 15) can be explained by the need for including sufficient amount of data from the dynamical region in order to clearly quantify internal disagreements.
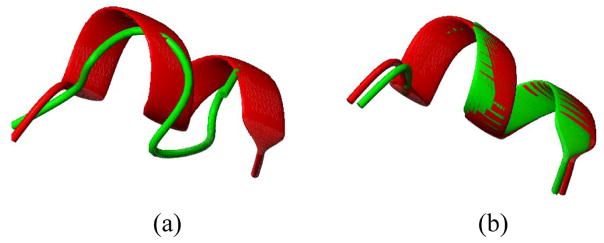
It is important to note that ignoring the presence of molecular motion can produce a faulty structure as illustrated in this case. Figure 8(a) illustrates a superimposition of residues 71–81 of 1A1Z and the structure obtained from REDCRAFT while insisting on extension of the static region past the residue 71. These two structures exhibit a 2.9 Å distance measured over the Cα backbone atoms. Figure 8(b) illustrates the same region after structure determination of residues 71–81 in isolation from the rest of the protein. Allowing an independent structural investigation of this region provided the freedom of defining an order tensor appropriate for this section and therefore facilitates provision of a structure without the influence of motion.
Figure 8.
Structure of residues 71–81 of 1A1Z determined by REDCRAFT. Panel (a) is the structure when determined with the remainder of the protein and panel (b) shows the structure when determined in isolation.
Experimental data from PF1061
Complete description of the structure determination protocol using REDCRAFT for this protein has previously been described [49] and the final structure has been submitted to the PDB under the code 1SF0. In summary, the structure of this protein was determined in 5 distinct fragments. The final structure obtained from RDC analysis by REDCRAFT is shown in Figure 9 using approximately 5 and 3 RDCs per peptide plane from alignment media 1 and 2 respectively. Fragmented study of this protein was partially due to missing data at certain residues and partially due to existence of internal motion. The order tensor obtained in each of the two media was used in orienting each fragment, and a small set of NOEs were used to translate each fragment into final structure.
Figure 9.
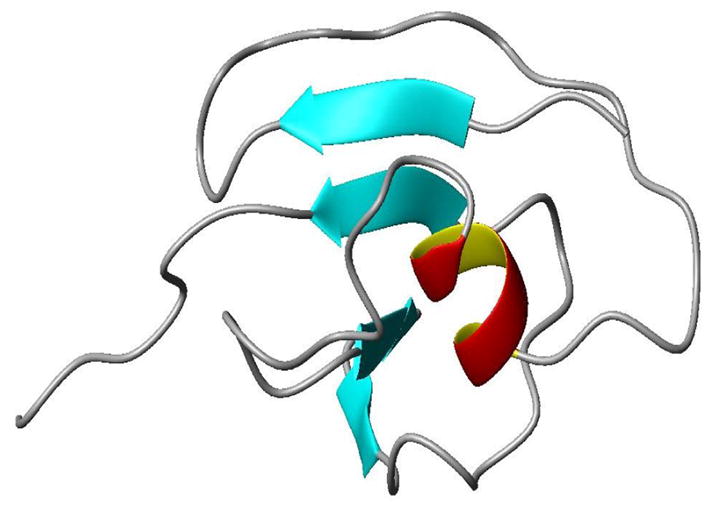
RDC based structure of PFU-1601 obtained from REDCRFT.
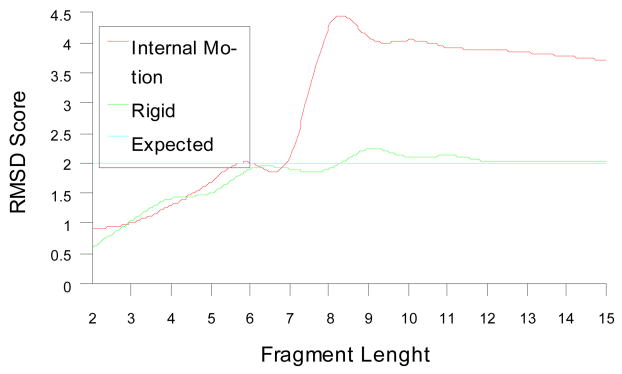
Figure 10 plots the best rmsd score between the back-calculated and experimental RDC data reported by REDCRAFT for two regions of PF1601. Similar to the simulated data in Figure 6, as the size of each fragment increases from the starting dipeptide seed, the rmsd score gradually increases due to an increase in the amount of data. For the rigid fragment (blue line in Figure 10), the rmsd score stabilizes once its size is sufficient for accurate description of the global alignment tensor. Any additional peptide planes do not increase the value of the rmsd score beyond the expected value (determined based on the N-H RDC errors) from that point forward. However, for the fragment of last 15 residues of the C-terminus in red line, a different profile is observed. Initially an increase in the rmsd score proceeds as expected. Addition of the 8th peptide plane, however, significantly increases this score, indicating internal inconsistency of data in defining one commonly agreeable order tensor. As this fragment continues to grow, the rmsd score gradually recovers, since some internal consistency emerges between the peptide planes number 8 and higher. When structure determination of the last 7 residues of this protein proceeded separately from the rest of the protein with more than 50 RDCs, a nicely formed extended structure with total rmsd score of approximately 1 Hz was obtained.
Figure 10.
RMSD between the back-calculated and experimental RDCs for the best geometry reported by REDCRAFT as an increasing fragment size.
Once an accurate structure is obtained, comparison of the principal order parameters reported by different fragments of the protein can be used to further characterize internal dynamics of the protein as illustrated previously [36]. GDOs for all five fragments of PF1061 are listed in Table 3. Comparison of the principal order parameters in Table 3 indicates that the first four segments of this protein are nearly rigid with respect to one another. The C-terminal fragment, however, exhibits order parameters that are significantly different from other regions. The reduction in GDO indicates a substantial degree of motion at the C-terminus. The magnitude of motion can be estimated if a wobbling motion in a cone of angle θ is assumed. Using previously published work, θ can be estimated to be approximately 35–50° [36]. Moreover, the observed change in the signs of the order parameters for the C-terminal fragment is reminiscent of substantial internal rotation about an axis perpendicular to the z axis within the PAF. Since dynamics of this segment was identified and isolated from the rest of the molecule, the accuracy in structure determination of different regions of this protein was not compromised. The effect of internal motion of the C-terminal region was neutralized by allowing independent description of an order tensor which reports overall alignment of that fragment, including molecular tumbling and internal motion. Incidentally, it is relevant to mention that this protein was initially very refractory to crystallization and when crystals were obtained, the diffraction patterns revealed structural incoherence.
Table 3.
The best solution order parameter and GDO calculated by REDCAT for each fragment of the PF-1601.
| Fragment | Sxx | Syy | Szz | ζ |
|---|---|---|---|---|
| 1 | −2.06E-04 | −5.56E-04 | 7.62E-04 | 9.66E-04 |
| 2 | −1.70E-04 | −5.70E-04 | 7.40E-04 | 9.49E-04 |
| 3 | −1.74E-04 | −4.53E-04 | 6.27E-04 | 7.93E-04 |
| 4 | −3.55E-04 | −4.32E-04 | 7.87E-04 | 7.88E-04 |
| 5 | 8.20E-05 | 2.11E-04 | -2.93E-04 | 3.70E-04 |
6. Discussion and Conclusion
Elucidation of protein backbone structure is of direct importance within the context of the current protein structure initiative [50; 52]. Here it is anticipated that producing a few structures in each of a few thousand protein families can lead to prediction of structures for the remaining members. Because members of a given family may exhibit more than 30% sequence identity, most side chains can be replaced during prediction and it is the backbone structure that is of primary importance. Programs such as REDCRAFT can clearly play an important role in producing these backbone structures.
REDCRAFT is not the only program put forth for the production of protein structures primarily from RDCs and it is therefore appropriate to make comparisons to some of these programs [21; 22; 30–34; 55]. REDCRAFT exhibits the following unique features which become relevant during the task of protein structure determination:
6.1. Simplified Search Space
REDCRAFT exploits the rich information content of RDC data to limit structure determination to the backbone of the unknown protein, eliminating complexities of the energy landscape contributed by the sidechains. Moreover, the search for a protein structure is conducted by gradually increasing the fragment size, leading to a less complicated energy landscape. Extension of fragments using ideal peptide planes and search for structural conformers in torsion angle space eliminates bond length, bond angles and improper energy terms; further reducing the complexity of the structural energy landscape. Although these energy terms do contribute to the final structure of a protein, it is reasonable to argue that these terms would be more consequential during the last stages of structure refinement.
Discovery of the global optimal point within a complex energy landscape is very difficult and computationally intractable. Although approaches such as simulated annealing have been used to overcome the accidental entrapment in local minima, in general they require repeated minimization sessions. Simplification of the energy landscape employed by REDCRAFT is certainly welcome when facing with this problem.
6.2. Robustness
A number of recent approaches have explored the concept of incremental structure determination and the structural search is conducted in the rotamer space similar to REDCRAFT [22; 32]. These programs however, unlike REDCRAFT, either analytically or through a search routine obtain the most optimal torsion angles of the last added residue based on the data originated from that peptide plane. While these “greedy” approaches may intuitively make sense and are computationally friendly, they are highly susceptible to imperfect data. As shown in section 4.2, the complexity of RDC energy landscape justifies the shortcomings of a “greedy” approach. Careful examination of Figure 3 can provide the following two important conclusions. First, a number of local minima can be identified that correspond to incorrect geometries. Second, the correct geometry (−130°, 138°) does not even appear as a local minimum for a fortuitous entrapment of gradient descent search methods. This phenomenon is attributed to both experimental and structural noise. Only after appending 5 additional peptide planes (2–8) a meaningful and significant landscape is observed. Only then, the global minimum point corresponding to the true structure emerges. Any method that proceeds based on a single exact torsion angle would start with a highly inaccurate structure. Progression down the path initiated by a false geometry will certainly lead to an incorrect or suboptimal structure. It is important to note that exhaustive search of structures for a small fragment with seven peptide planes can take two weeks of computation time on a 100 CPU Linux cluster.
6.3. Simultaneous Characterization of Structure and Identification of Motion
REDCRAFT possesses the unique ability of simultaneous structure determination and identification of motion. This is a very important feature especially within the context of dynamical proteins such as membrane proteins where the transmembrane region is likely to experience a relative motion with respect to the aqueous region or signaling proteins [53; 54]. Although RDC data provide the information needed to assess the relative motion between different regions, proper fragmentation of the protein into consistent regions will be a prerequisite. Fragmentation of a protein into regions with internally consistent rigidity will effectively remove the influence of overall motion of that fragment from structure determination, resulting accurate structures and assessment of motion. Any method that disregards presence of motion (of a protein or a fragment of a protein) may potentially produce a faulty and inaccurate structure influenced by inconsistent internal dynamics. Assessment of relative motion using faulty starting conformations will certainly produce incorrect answers.
6.4. De Novo Structure Determination
REDCRAFT’s approach to structure determination is truly De Novo. The course of structure determination is governed only by the observed experimental data and assumption of the standard peptide plane geometry. REDCRAFT does not depend on any knowledge extracted from currently existing database of protein structures other than the Ramachandran statistics. Furthermore, REDCRAFT does not require an existing model for refinement or include structural information embedded in its force field. Structure determination guided purely by the experimental data is a desirable attribute when dealing with proteins that are underrepresented and may produce proteins with unique structural characteristics.
6.5. Easy Customization
REDCRAFT incorporates advanced programming concepts such as class based programming implemented in C++. In addition, the modular cascade of filters provides a very flexible platform for customization of the software. Users of this package are able to design and integrate their own filters easily. As long as the input/output format of these filters adheres to the specification of our software, they can be inserted into any stage of the analysis. Furthermore, additional filters provided by the users can be implemented in the programming language of their choice.
6.6. Efficiency of Combinatorial Elimination
Finally it is appropriate to discuss the time complexity of REDCRAFT. The computational complexity of the first stage of REDCRAT is simply a linear function of the fragment size and therefore exhibits O(n) time complexity. The computational requirement of this step is insignificant compared to that of the second stage. The results of the first step can be obtained in real time on a typical personal computer. The second stage of the REDCRAFT algorithm is the most time consuming component and exhibits some counterintuitive properties. The time complexity of the second stage can be expressed as: O[n(NM + NMlog(NM))] where n is the number of peptide planes in the fragment, N is the number of surviving geometries from the Stage-I and M is the search depth. The first term in this expression corresponds to the number of geometries evaluated while the second term corresponds to the time complexity of sorting algorithm for ranking of different geometries. This time complexity approaches O(N2log(N)) when N ≈ M and O(Mlog(M)) for the cases of M ≫ N. This behavior is very desirable since the time complexity of the problem becomes more efficient as more exhaustive searches are performed.
Acknowledgments
This work was supported by grant number GM062407 from the National Institutes of Health (to the Southeast Collaboratory for Structural Genomics) and grant number 1R01GM081793 from National Institutes of Health to Dr. Homayoun Valafar.
Footnotes
Publisher's Disclaimer: This is a PDF file of an unedited manuscript that has been accepted for publication. As a service to our customers we are providing this early version of the manuscript. The manuscript will undergo copyediting, typesetting, and review of the resulting proof before it is published in its final citable form. Please note that during the production process errors may be discovered which could affect the content, and all legal disclaimers that apply to the journal pertain.
References
- 1.Prestegard JH, Al-Hashimi HM, Tolman JR. Nmr structures of biomolecules using field oriented media and residual dipolar couplings. Quarterly Reviews of Biophysics. 2000;33:371–424. doi: 10.1017/s0033583500003656. [DOI] [PubMed] [Google Scholar]
- 2.Bax A, Kontaxis G, Tjandra N. Dipolar couplings in macromolecular structure determination. Nuclear Magnetic Resonance Of Biological Macromolecules, Pt B. 2001:127–174. doi: 10.1016/s0076-6879(01)39313-8. [DOI] [PubMed] [Google Scholar]
- 3.Tolman JR, Flanagan JM, Kennedy MA, Prestegard JH. Nuclear magnetic dipole interactions in field-oriented proteins - information for structure determination in solution. Proceedings of the National Academy of Sciences of the United States of America. 1995;92:9279–9283. doi: 10.1073/pnas.92.20.9279. [DOI] [PMC free article] [PubMed] [Google Scholar]
- 4.Valafar H, Prestegard JH. Redcat: a residual dipolar coupling analysis tool. J Magn Reson. 2004;167:228–41. doi: 10.1016/j.jmr.2003.12.012. [DOI] [PubMed] [Google Scholar]
- 5.Schwieters CD, Kuszewski JJ, Tjandra N, Clore GM. The xplor-nih nmr molecular structure determination package. Journal of Magnetic Resonance. 2003;160:65–73. doi: 10.1016/s1090-7807(02)00014-9. [DOI] [PubMed] [Google Scholar]
- 6.Cupane A, Leone M, Vitrano E, Cordone L. Structural and dynamic properties of the heme pocket in myoglobin probed by optical spectroscopy. Biopolymers. 1988;27:1977–1997. doi: 10.1002/bip.360271209. [DOI] [PubMed] [Google Scholar]
- 7.Shimada H, Caughey WS. Dynamic protein structures - effects of ph on conformer stabilities at the ligand-binding site of bovine heart myoglobin carbonyl. Journal Of Biological Chemistry. 1982;257:1893–1900. [PubMed] [Google Scholar]
- 8.DePristo MA, de Bakker PIW, Blundell TL. Heterogeneity and inaccuracy in protein structures solved by x-ray crystallography. Structure. 2004;12:831–838. doi: 10.1016/j.str.2004.02.031. [DOI] [PubMed] [Google Scholar]
- 9.Saupe A, Englert G. High-resolution nuclear magnetic resonance spectra of orientated molecules. Phys Rev Lett. 1963;11:462–464. [Google Scholar]
- 10.Zhou HJ, Vermeulen A, Jucker FM, Pardi A. Incorporating residual dipolar couplings into the nmr solution structure determination of nucleic acids. Biopolymers. 1999;52:168–180. doi: 10.1002/1097-0282(1999)52:4<168::AID-BIP1002>3.0.CO;2-7. [DOI] [PubMed] [Google Scholar]
- 11.de Alba E, Tjandra N. Nmr dipolar couplings for the structure determination of biopolymers in solution. Progress in Nuclear Magnetic Resonance Spectroscopy. 2002;40:175–197. [Google Scholar]
- 12.Blackledge M. Recent progress in the study of biomolecular structure and dynamics in solution from residual dipolar couplings. Progress in Nuclear Magnetic Resonance Spectroscopy. 2005;46:23–61. [Google Scholar]
- 13.Azurmendi HF, Martin-Pastor M, Bush CA. Conformational studies of lewis x and lewis a trisaccharides using nmr residual dipolar couplings. Biopolymers. 2002;63:89–98. doi: 10.1002/bip.10015. [DOI] [PubMed] [Google Scholar]
- 14.Tian F, Valafar H, Prestegard JH. A dipolar coupling based strategy for simultaneous resonance assignment and structure determination of protein backbones. Journal of the American Chemical Society. 2001;123:11791–11796. doi: 10.1021/ja011806h. [DOI] [PubMed] [Google Scholar]
- 15.Tjandra N, Tate S, Ono A, Kainosho M, Bax A. The nmr structure of a dna dodecamer in an aqueous dilute liquid crystalline phase. Journal of the American Chemical Society. 2000;122:6190–6200. [Google Scholar]
- 16.Vermeulen A, Zhou HJ, Pardi A. Determining dna global structure and dna bending by application of nmr residual dipolar couplings. Journal of the American Chemical Society. 2000;122:9638–9647. [Google Scholar]
- 17.Assfalg M, Bertini I, Turano P, Mauk AG, Winkler JR, Gray HB. N-15-h-1 residual dipolar coupling analysis of native and alkaline-k79a saccharomyces cerevisiae cytochrome c. Biophysical Journal. 2003;84:3917–3923. doi: 10.1016/S0006-3495(03)75119-4. [DOI] [PMC free article] [PubMed] [Google Scholar]
- 18.Bertini I, Luchinat C, Turano P, Battaini G, Casella L. The magnetic properties of myoglobin as studied by nmr spectroscopy. Chemistry-a European Journal. 2003;9:2316–2322. doi: 10.1002/chem.200204562. [DOI] [PubMed] [Google Scholar]
- 19.Clore GM, Bewley CA. Using conjoined rigid body/torsion angle simulated annealing to determine the relative orientation of covalently linked protein domains from dipolar couplings. Journal of Magnetic Resonance. 2002;154:329–335. doi: 10.1006/jmre.2001.2489. [DOI] [PubMed] [Google Scholar]
- 20.Cornilescu G, Delaglio F, Bax A. Protein backbone angle restraints from searching a database for chemical shift and sequence homology. Journal of Biomolecular Nmr. 1999;13:289–302. doi: 10.1023/a:1008392405740. [DOI] [PubMed] [Google Scholar]
- 21.Fowler CA, Tian F, Al-Hashimi HM, Prestegard JH. Rapid determination of protein folds using residual dipolar couplings. Journal of Molecular Biology. 2000;304:447–460. doi: 10.1006/jmbi.2000.4199. [DOI] [PubMed] [Google Scholar]
- 22.Wang LC, Donald BR. Exact solutions for internuclear vectors and backbone dihedral angles from nh residual dipolar couplings in two media, and their application in a systematic search algorithm for determining protein backbone structure. Journal of Biomolecular Nmr. 2004;29:223–242. doi: 10.1023/B:JNMR.0000032552.69386.ea. [DOI] [PubMed] [Google Scholar]
- 23.Tjandra N, Grzesiek S, Bax A. Magnetic field dependence of nitrogen-proton j splittings in n-15-enriched human ubiquitin resulting from relaxation interference and residual dipolar coupling. Journal of the American Chemical Society. 1996;118:6264–6272. [Google Scholar]
- 24.Nitz M, Sherawat M, Franz KJ, Peisach E, Allen KN, Imperiali B. Structural origin of the high affinity of a chemically evolved lanthanide-binding peptide. Angewandte Chemie-International Edition. 2004;43:3682–3685. doi: 10.1002/anie.200460028. [DOI] [PubMed] [Google Scholar]
- 25.Prestegard JH, Valafar H, Glushka J, Tian F. Nuclear magnetic resonance in the era of structural genomics. 2001;40:8677–8685. doi: 10.1021/bi0102095. [DOI] [PubMed] [Google Scholar]
- 26.Clore GM, Gronenborn AM, Bax A. A robust method for determining the magnitude of the fully asymmetric alignment tensor of oriented macromolecules in the absence of structural information. Journal of Magnetic Resonance. 1998;133:216–221. doi: 10.1006/jmre.1998.1419. [DOI] [PubMed] [Google Scholar]
- 27.Dosset P, Hus JC, Marion D, Blackledge M. A novel interactive tool for rigid-body modeling of multi-domain macromolecules using residual dipolar couplings. Journal of Biomolecular Nmr. 2001;20:223–231. doi: 10.1023/a:1011206132740. [DOI] [PubMed] [Google Scholar]
- 28.Losonczi JA, Andrec M, Fischer MWF, Prestegard JH. Order matrix analysis of residual dipolar couplings using singular value decomposition. Journal of Magnetic Resonance. 1999;138:334–342. doi: 10.1006/jmre.1999.1754. [DOI] [PubMed] [Google Scholar]
- 29.Roy S, Redfield AG. Nuclear overhauser effect study and assignment of d-stem and reverse-hoogsteen base pair proton resonances in yeast transfer rna-asp. 1981;9:7073–7083. doi: 10.1093/nar/9.24.7073. [DOI] [PMC free article] [PubMed] [Google Scholar]
- 30.Andrec M, Du PC, Levy RM. Protein backbone structure determination using only residual dipolar couplings from one ordering medium. Journal of Biomolecular Nmr. 2001;21:335–347. doi: 10.1023/a:1013334513610. [DOI] [PubMed] [Google Scholar]
- 31.Delaglio F, Kontaxis G, Bax A. Protein structure determination using molecular fragment replacement and nmr dipolar couplings. Journal of the American Chemical Society. 2000;122:2142–2143. [Google Scholar]
- 32.Hus JC, Marion D, Blackledge M. Determination of protein backbone structure using only residual dipolar couplings. Journal of the American Chemical Society. 2001;123:1541–1542. doi: 10.1021/ja005590f. [DOI] [PubMed] [Google Scholar]
- 33.Jung Y, Sharma M, Zweckstetter M. Simultaneous assignment and structure determination of protein backbones by using nmr dipolar couplings. Angew Chem Int Ed Engl. 2004;43:3479–3481. doi: 10.1002/anie.200353588. [DOI] [PubMed] [Google Scholar]
- 34.Rohl CA, Baker D. De novo determination of protein backbone structure from residual dipolar couplings using rosetta. Journal of the American Chemical Society. 2002;124:2723–2729. doi: 10.1021/ja016880e. [DOI] [PubMed] [Google Scholar]
- 35.Press W, Teukolsky Saul A, Vetterling William T, Flannery Brian P. Numerical recipes in c, the art of scientific computing. 2002 [Google Scholar]
- 36.Tolman JR, Al-Hashimi HM, Kay LE, Prestegard JH. Structural and dynamic analysis of residual dipolar coupling data for proteins. Journal of the American Chemical Society. 2001;123:1416–1424. doi: 10.1021/ja002500y. [DOI] [PubMed] [Google Scholar]
- 37.Al-Hashimi HM, Bolon PJ, Prestegard JH. Molecular symmetry as an aid to geometry determination in ligand protein complexes. Journal of Magnetic Resonance. 2000;142:153–158. doi: 10.1006/jmre.1999.1937. [DOI] [PubMed] [Google Scholar]
- 38.Tolman JR. A novel approach to the retrieval of structural and dynamic information from residual dipolar couplings using several oriented media in biomolecular nmr spectroscopy. Journal of the American Chemical Society. 20021009;124:12020–12030. doi: 10.1021/ja0261123. [DOI] [PubMed] [Google Scholar]
- 39.Hus JC, Bruschweiler R. Principal component method for assessing structural heterogeneity across multiple alignment media. Journal of Biomolecular Nmr. 2002;24:123–132. doi: 10.1023/a:1020927930910. [DOI] [PubMed] [Google Scholar]
- 40.Greshenfeld NA. The nature of mathematical modeling. 1998 [Google Scholar]
- 41.Cavanagh J, Fairbrother WJ, Palmer AG, III, Skelton NJ. Protein nmr spectroscopy. principles and practice. 1995 [Google Scholar]
- 42.Karplus M. Vicinal proton coupling in nuclear magnetic resonance. J Am Chem Soc. 1963;85:2870. [Google Scholar]
- 43.Al-Hashimi HM, Valafar H, Terrell M, Zartler ER, Eidsness MK, Prestegard JH. Variation of molecular alignment as a means of resolving orientational ambiguities in protein structures from dipolar couplings. Journal of Magnetic Resonance. 2000;143:402–406. doi: 10.1006/jmre.2000.2049. [DOI] [PubMed] [Google Scholar]
- 44.Ottiger M, Bax A. andc(alpha)-h-alpha effective bond lengths in a protein by nmr in a dilute liquid crystalline phase. Journal of the American Chemical Society. 1998;120:12334–12341. [Google Scholar]
- 45.Tjandra N, Bax A. Direct measurement of distances and angles in biomolecules by nmr in a dilute liquid crystalline medium. Science. 1997;278:1111–1114. doi: 10.1126/science.278.5340.1111. [DOI] [PubMed] [Google Scholar]
- 46.Kuang R, Leslie CS, Yang A. Protein backbone angle prediction with machine learning approaches. Bioinformatics. 2004;20:1612–1621. doi: 10.1093/bioinformatics/bth136. [DOI] [PubMed] [Google Scholar]
- 47.Lovell SC, Word JM, Richardson JS, Richardson DC. The penultimate rotamer library. Proteins-Structure Function and Genetics. 2000;40:389–408. [PubMed] [Google Scholar]
- 48.Prestegard JH, Mayer KL, Valafar H, Benison GC. Determination of protein backbone structures from residual dipolar couplings. Methods in Enzymology. 2005;394:175–209. doi: 10.1016/S0076-6879(05)94007-X. [DOI] [PMC free article] [PubMed] [Google Scholar]
- 49.Valafar H, Mayer K, Bougault C, LeBlond P, Jenney FE, Brereton PS, Adams M, Prestegard JH. Backbone solution structures of proteins using residual dipolar couplings: application to a novel structural genomics target. Journal of Structural and Functional Genomics. 2005;5:241–254. doi: 10.1007/s10969-005-4899-5. [DOI] [PMC free article] [PubMed] [Google Scholar]
- 50.Service RF. Structural genomics - tapping dna for structures produces a trickle. 2002;298:948–950. doi: 10.1126/science.298.5595.948. [DOI] [PubMed] [Google Scholar]
- 51.Tolman JR. Dipolar couplings as a probe of molecular dynamics and structure in solution. Current Opinion in Structural Biology. 2001;11:532–539. doi: 10.1016/s0959-440x(00)00245-1. [DOI] [PubMed] [Google Scholar]
- 52.Service R. Structural biology - structural genomics, round 2. 2005;307:1554–+. doi: 10.1126/science.307.5715.1554. [DOI] [PubMed] [Google Scholar]
- 53.Cheng Y, LeGall T, Oldfield CJ, Mueller JP, Van YJ, Romero P, Cortese MS, Uversky VN, Dunker AK. Rational drug design via intrinsically disordered protein. Trends Biotechnol. 2006;24:435–442. doi: 10.1016/j.tibtech.2006.07.005. [DOI] [PubMed] [Google Scholar]
- 54.Dunker AK, Lawson JD, Brown CJ, Williams RM, Romero P, Oh JS, Oldfield CJ, Campen AM, Ratliff CM, Hipps KW, Ausio J, Nissen MS, Reeves R, Kang C, Kissinger CR, Bailey RW, Griswold MD, Chiu W, Garner EC, Obradovic Z. Intrinsically disordered protein. J Mol Graph Model. 2001;19:26–59. doi: 10.1016/s1093-3263(00)00138-8. [DOI] [PubMed] [Google Scholar]
- 55.Wang J, Walsh JD, Kuszewski J, Wang Y. Periodicity, planarity, and pixel (3P): a program using the intrinsic residual dipolar coupling periodicity-to-peptide plane correlation and phi/psi angles to derive protein backbone structures. J Magn Reson. 2007;189:90–103. doi: 10.1016/j.jmr.2007.08.018. [DOI] [PubMed] [Google Scholar]


