Abstract
Depolarization-induced suppression of excitation and inhibition (DSE/DSI) appear to be important forms of short-term retrograde neuronal plasticity involving endocannabinoids, the activation of presynaptic cannabinoid CB1 receptors, and the suppression of neurotransmitter release. We have distinguished five populations of autaptic inhibitory neurons that exhibit differential cannabinoid responses, including three temporally distinct forms of DSI. One remaining population responded to cannabinoids but did not have DSI while a fifth had neither DSI nor cannabinoid responses.
Of the two chief candidate endocannabinoids (eCBs), 2-AG reversibly inhibited IPSCs while anandamide did so irreversibly, the latter’s action inconsistent with a role as a bona fide eCB mediator of DSI. The duration of depolarization necessary to elicit the two most prominent forms of DSI (Effective dose (ED-50) ~210ms; ~280ms) was far less than for autaptic DSE. However the nearly identical concentration response for 2-AG to inhibit EPSCs and IPSCs indicates that this difference is not due to differential cannabinoid receptor sensitivity.
Interestingly, of the two populations exhibiting prominent DSI, one had a substantially faster recovery time course both after DSI and 2-AG, this despite being cultured under identical conditions. Several enzymes have been proposed to play a role in 2-AG breakdown, presumably determining the time course of DSI: fatty acid amide hydrolase (FAAH), cyclooxygenase-2 (COX-2), monoacyl glycerol lipase (MGL), α/β-hydrolase domain 6 and 12 (ABHD6 and ABHD12). We tested the impact on DSI duration by blockers of FAAH, COX-2, MGL and ABHD6. Notably, the population with slow DSI was regulated only by MGL, whereas the fast DSI population was regulated by both MGL and COX-2. This suggests that the faster DSI time course may occur as a result of the concerted action of multiple enzymes, which may represent a more general mechanism for regulation of the duration of different forms of DSI and DSE.
INTRODUCTION
Endocannabinoids are thought to serve as retrograde messengers, allowing neurons to regulate—via feedback inhibition—their upstream neuronal inputs. This suppression of upstream presynaptic release of GABA or glutamate (along with co-released neurotransmitters) is termed depolarisation-induced suppression of inhibition (DSI) or excitation (DSE), respectively. DSI was first reported in the early 1990s (Llano et al., 1991, Pitler and Alger, 1992, Vincent et al., 1992), coincidently not long after the cloning of the first cannabinoid receptor (Matsuda et al., 1990), but a decade would pass before the link between the two was discerned (Kreitzer and Regehr, 2001b, a, Ohno-Shosaku et al., 2001, Wilson and Nicoll, 2001). Subsequently, it has become clear that the endogenous cannabinoid signalling system mediates both DSI and its excitatory cousin DSE (Kreitzer and Regehr, 2001b, Ohno-Shosaku et al., 2002b). Endocannabinoids have now been found to serve an inhibitory role in many regions of the brain (e.g. (Kreitzer and Regehr, 2001a, Melis et al., 2004, Trettel et al., 2004)), lending support to the hypothesis that mediation of feedback inhibition is one of their principal functions.
Hippocampal DSI has been studied using both slice and culture models (Wilson et al., 2001, Wilson and Nicoll, 2001, Ohno-Shosaku et al., 2002a, Ohno-Shosaku et al., 2002b, Isokawa and Alger, 2005). However these studies, particularly those employing neuronal cultures have tended to treat hippocampal DSI as a monolithic phenomenon, despite evidence for classes of interneurons that form distinct functional circuits (Katona et al., 1999, Glickfeld and Scanziani, 2006). Autaptic neurons are an architecturally simple preparation consisting of a single excitatory or inhibitory neuron synapsing onto itself allowing simultaneous pre- and post-synaptic measurements with a single electrode (Bekkers and Stevens, 1991). We have previously reported that excitatory autaptic hippocampal neurons possess the pre- and postsynaptic machinery necessary for the expression of functional DSE (Straiker and Mackie, 2005). Recording opportunistically from inhibitory autaptic neurons over the course of several years, and more recently using neurons from GAD67-GFP mice, we have found that nearly all inhibitory neurons fall into one of five ‘types’ based on three criteria – one pharmacological (their responses to cannabinoids) and two electrophysiological (responses to 3 second depolarization and high frequency stimulus). Four populations respond to cannabinoid agonists, three of these exhibit temporally distinct forms of DSI. We describe here the distinct cannabinoid response profiles of these neurons and some investigations into the underpinnings of their differential DSI responses.
Experimental Procedures
Culture preparation
All procedures used in this study were approved by the Animal Care Committees of Indiana University and the University of Washington and conform to the Guidelines of the National Institutes of Health on the Care and Use of Animals. Mouse hippocampal neurons isolated from the CA1–CA3 region were cultured on microislands as described previously (Furshpan et al., 1976, Bekkers and Stevens, 1991). Neurons were obtained from animals (age postnatal day 0–2, killed via rapid decapitation) and plated onto a feeder layer of hippocampal astrocytes that had been laid down previously (Levison and McCarthy, 1991). Cultures were grown in high-glucose (20 mM) medium containing 10% horse serum, without mitotic inhibitors and used for recordings after 8 days in culture and for no more than three hours after removal from culture medium. Drugs were tested on cells from at least two different preparations.
Electrophysiology
When a single neuron is grown on a small island of permissive substrate, it forms synapses—or “autapses”—onto itself. All experiments were performed on isolated autaptic neurons.
Whole cell voltage-clamp recordings from autaptic neurons were carried out at room temperature using Axopatch 200A amplifier (Axon Instruments, Burlingame, CA). The extracellular solution contained (in mM) 119 NaCl, 5 KCl, 2.5 CaCl2, 1.5 MgCl2, 30 glucose and 20 HEPES. Continuous flow of solution through the bath chamber (1–3 ml/min) ensured rapid drug application and clearance. Drugs were typically prepared as a stock, then diluted into extracellular solution at their final concentration and used on the same day. Drugs dissolved in DMSO were used at a final DMSO concentration of < 0.1%. As a rule, positive results were coupled on the same day with negative controls.
Recording pipettes of 1.8–3 MΩ were filled with (in mM) 121.5 KGluconate, 17.5 KCl, 9 NaCl, 1 MgCl2, 10 HEPES, 0.2 EGTA, 2 MgATP, and 0.5 LiGTP. Access resistance was monitored and only cells with a stable access resistance were included for data analysis.
Stimulus Protocols
Two major sets of stimulus protocols were used in these experiments, one to elicit DSI, the other for conventional IPSC studies such as concentration responses.
Conventional stimulus protocol
The membrane potential was held at −70 mV and IPSCs were evoked every 20 seconds by triggering an unclamped action current with a 1.0 ms depolarising step. The resultant evoked waveform consisted of a brief stimulus artifact, a large downward spike representing inward sodium currents, followed by the slower IPSC. The size of the recorded IPSCs was calculated by integrating the evoked current to yield a charge value (in pC). Calculating the charge value in this manner yields an indirect measure of the amount of neurotransmitter released while minimizing the effects of cable distortion on currents generated far from the site of the recording electrode (the soma). Data were acquired at a sampling rate of 5 kHz. Because we have found a time-dependent enhancement of the degree of DSE in autaptic excitatory hippocampal neurons (Straiker & Mackie, 2007), care was taken to obtain DSI and other data after several minutes had elapsed. DSI responses were generally consistent over time. Some cells exhibited a modest rundown of their IPSCs (e.g. Fig. 2D3). These cells were not used for long-term recordings. Cells with more pronounced rundown (5–10% of total inhibitory neurons) were discarded.
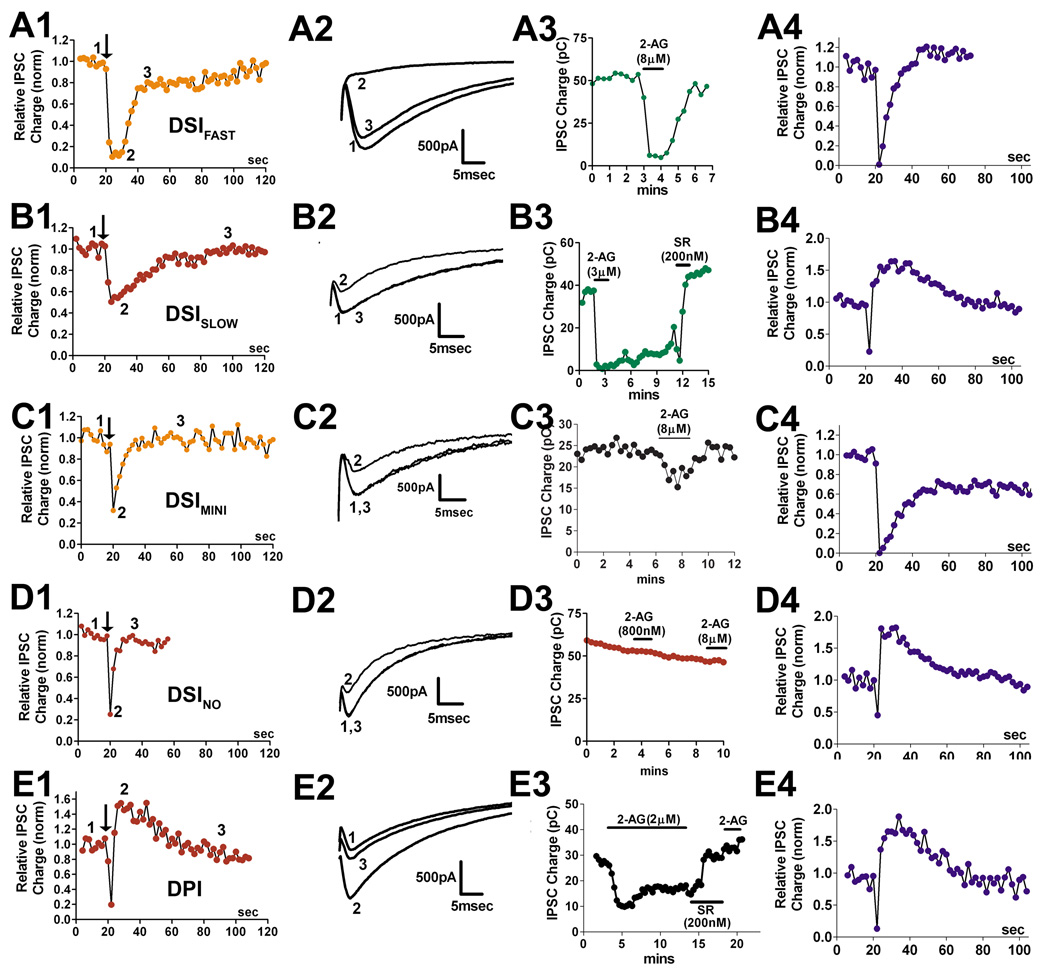
Figure 2. Identification of five classes of inhibitory autaptic hippocampal neurons.
A1) Time course for a DSIFAST neuron in response to a 3 second depolarization. A2) Corresponding IPSCs at control (1), inhibition (2), and recovery (3) timepoints. A3) sample response to treatment with 2-AG (8µM). A4) Sample response to 100Hz (1 sec) stimulus. B1) Time course for DSISLOW neuron in response to a 3 second depolarization. B2) Corresponding IPSCs at control (1), inhibition (2), and recovery (3) timepoints. B3) sample response to treatment with 2-AG (3µM) followed with reversal by SR141716 (200nM). B4) Sample response to 100Hz (1 sec) stimulus. C1) Time course for DSIMINI neuron in response to 3 second depolarization. C2) Corresponding IPSCs at control (1), inhibition (2), and recovery (3) time points. C3) sample response to treatment with 2-AG (8µM). C4) Sample response to 100Hz (1 sec) stimulus. D1) Time course for DSINO neuron in response to a 3 second depolarization. D2) Corresponding IPSCs at control (1), inhibition (2), and recovery (3) timepoints. D3) sample response to treatment with 2-AG (800nM, 8µM). D4) Sample response to 100Hz (1 sec) stimulus. E1) Time course for DPI neuron in response to a 3 second depolarization. E2) Corresponding IPSCs at control (1), inhibition (2), and recovery (3) timepoints. E3) sample response to treatment with 2-AG (2µM), reversed with SR141716 (200nM) followed by second 2-AG treatment. E4) Sample response to 100Hz (1 sec) stimulus.
DSI stimulus protocol
After establishing a 10–20 second 0.5 Hz baseline, DSI was evoked by depolarizing to 0 mV for 0.05–10 seconds, followed by resumption of a 0.5 Hz stimulus protocol for 10–80+ seconds, as necessary. A 0.5 Hz baseline stimulus frequency was used for the sake of temporal resolution. With the exception of one neuronal population noted as such, we did not observe a potentiation of IPSCs as a result of this DSI stimulus. We also tested whether an interruption of the 0.5Hz stimulus could itself induce a deviation from baseline. In the two populations expressing forms of DSI, a 3 second interruption of stimulus (i.e. with the cell held at −70mV) had no effect on IPSCs (DSIFAST: 0.98 ± 0.02, n=5; DSISLOW: 1.00 ± 0.03, n=4).
Effects of DSI on paired-pulse responses were studied by paired trials in which two pulses (100 msec interval) were applied immediately before and 4 secs after a DSI-evoking depolarising stimulus. The amplitude ratios of the pre-DSI pairs and the post-DSI pairs were averaged and compared via paired Student’s t-test.
Materials
2-AG, AEA, WWL70, and URB-597 were purchased from Cayman Chemical Co. (Ann Arbor, MI). JZL184 was the kind gift of Dr. Ben Cravatt (Beckman Institute, La Jolla, CA). All remaining drugs were purchased from Tocris Cookson (Ellisville, MO) or Sigma-Aldrich (St. Louis, MO). GAD67-GFP mice generated by Dr. Yuchio Yanagawa (Gunman University, Gunma, Japan (Tamamaki et al., 2003)) were provided by Dr. Albert Berger (University of Washington, Seattle WA), with Dr. Yanagawa’s permission.
Results
Five classes of inhibitory autaptic hippocampal neurons based on their response to stimulation and cannabinoids
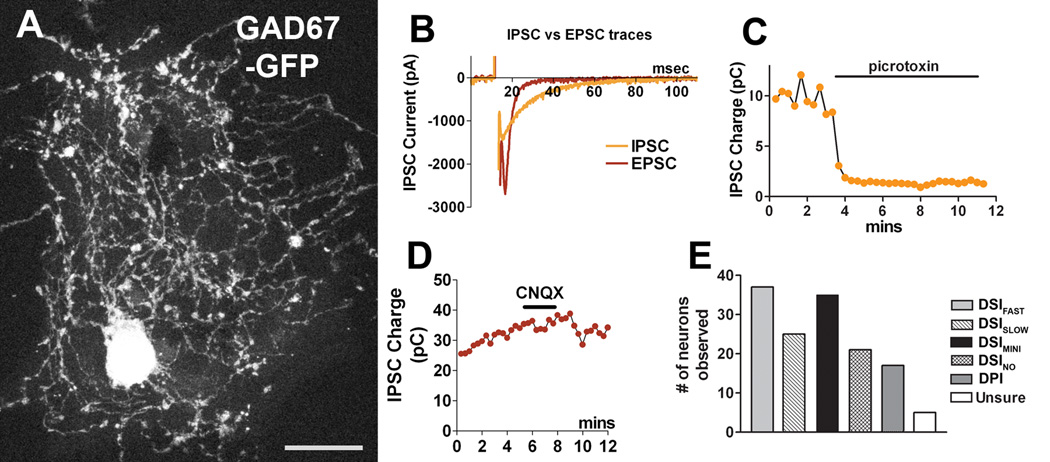
Inhibitory post synaptic currents (IPSCs) are easily distinguishable from excitatory currents (EPSCs) by virtue of their visibly slower decay timecourse (e.g. Fig. 1B, decay time constant for representative EPSC (t1/2): 4.0msec; for IPSC: 17.1msec). Because they represent approximately 10% of the total autaptic population, and are difficult to identify reliably by eye, these neurons were initially avoided/discarded. However in the process of recording from several of these neurons it quickly became apparent that they were often sensitive to cannabinoids. Thus, we proceeded to record from inhibitory neurons opportunistically. When necessary it was possible to confirm the identity of a neuron by treatment with the GABA A blocker picrotoxin (100µM) and/or AMPA receptor blocker 6-cyano-7-nitroquinoxaline-2,3-dione (CNQX, 25µM; Fig. 1C,D). To study inhibitory neurons more efficiently, we procured mice engineered to produce GFP in neurons expressing GAD67, with the result that all inhibitory neurons glow green when stimulated with blue light ((Tamamaki et al., 2003) See example in Fig. 1A)
Figure 1. A subset of autaptic hippocampal neurons are inhibitory.
A) Representative image showing two inhibitory autaptic hippocampal neurons from a GAD67-GFP mouse (GFP fluorescence) on a glial island. Scale bar = 25µm. B) Sample traces for IPSC (t1/2:17.1 msec) and EPSC (t1/2: 4.0 msec), C) Sample IPSC time course showing sensitivity to the GABA A receptor blocker picrotoxin. D) Sample IPSC time course showing insensitivity to AMPA receptor blocker CNQX. E) Bar graph showing relative frequency of the various types of interneurons.
In the course of recording from inhibitory autaptic neurons we observed certain characteristic responses to 3 second depolarizations, to 100Hz stimuli (1 sec), and to treatment with endocannabinoids (eCBs). Indeed, the neurons reliably fell into five response patterns. Figure 1E shows a sample breakdown of the incidence of these types. ~15% of neurons were not readily classified as one type or another, though in most of these cases it was possible to narrow them down to belonging to one of two populations.
Figure 2 shows sample time courses and IPSCs for each apparent Type, in response to a 3 second depolarization (A1-E1), eCB response (A3–E3), and 100Hz stimulus (A4–E4). Several of these populations exhibited an inhibition of their postsynaptic currents when challenged with 3 second depolarizations, responses that resembled depolarization induced suppression of inhibition (DSI) a form of retrograde cannabinoid-receptor dependent inhibition.
DSIFAST neurons
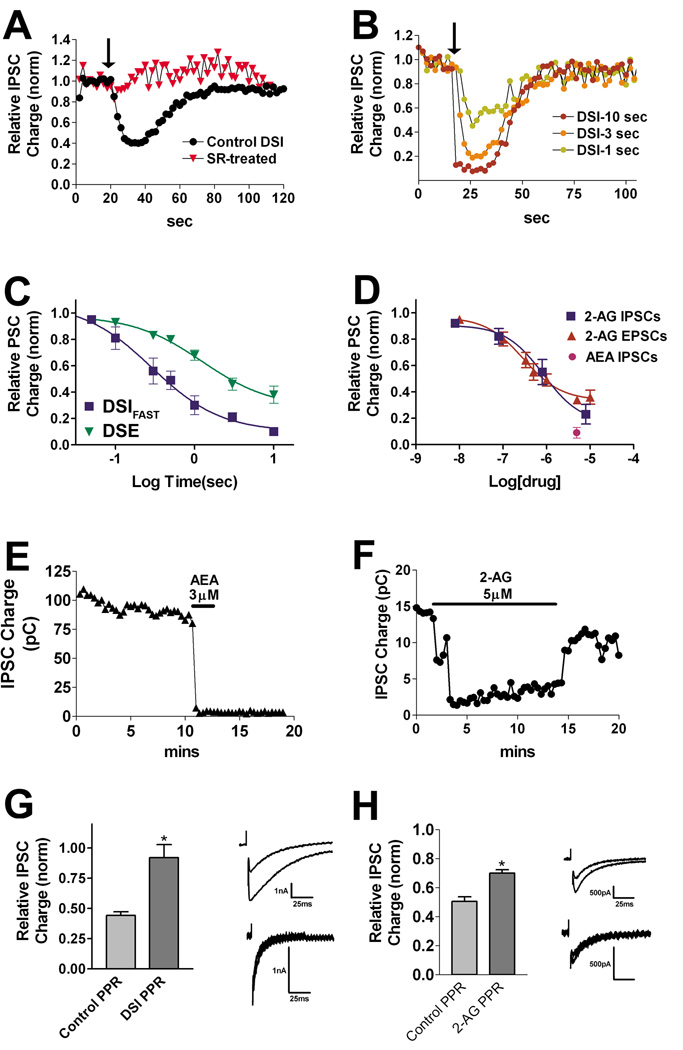
~40% of inhibitory neurons expressed very strong and often complete inhibition of IPSCs after depolarization. It soon became apparent that the DSI responses fell into two classes, with either rapid or slow recovery time courses, and with differential responses to eCBs and high frequency stimuli. In the first population, where DSI was very transient, we assessed whether the inhibition observed after neuronal depolarization was sensitive to CB1 receptor antagonists. We depolarized the neurons for 3 seconds, recorded the response over the following 60–100 sec, treated the same neuron with CB1 antagonist SR141716 (SR, 200nM) and then repeated the stimulus. We found that the inhibition was much-diminished after treatment with SR (Fig. 3A, Control inhibition in response to depolarization, 0.39 ± 0.07; inhibition in same cell after SR-treatment: 0.87 ± 0.05, n=6, p<0.005 paired t-test). We shall hereafter refer to this inhibition in response to depolarization as autaptic DSI (autDSI) and to these neurons as DSIFAST because of their relatively prompt recovery from maximal inhibition.
Figure 3. DSIFAST neurons exhibit DSI.
A) Time course shows IPSCs under baseline conditions and after depolarization (3 sec, arrow). Second time course (triangles) shows response to DSI stimulus in the same cells after treatment with CB1 antagonist SR141716 (200nM, n=6). B) Sample time courses for DSI in response to 1, 3 and 10 second depolarizations (arrow). C) Concentration response for DSI using a range of depolarizations from 50 ms to 10 sec. The DSE concentration response is shown for comparison. D) Concentration response for the eCB 2-AG as well as a single point for anandamide (AEA 3–5µM, centered at 4µM on graph, n=3). The concentration response for 2-AG in autEPSCs is included for comparison (adapted from Straiker & Mackie, 2005). E) Sample time course for AEA (5µM) treatment. F) Sample time course for 2-AG (5µM) treatment. G) Bar graph showing paired pulse ratios under control conditions and after DSI (n=5). Inset shows sample IPSCs; amplitude of the second set is normalized to first set. H) Bar graph showing paired pulse ratios under control conditions and after 2-AG treatment (5µM, n=4). Inset shows sample IPSCs. In a given set, the amplitude of the second IPSC is normalized to the first IPSC. *, p<0.05 paired t-test.
In characterizing DSIFAST neurons, we obtained an autDSI concentration response by varying the depolarization interval from 50 ms to 10 sec. Our results are consistent with previous reports finding that DSI requires briefer depolarizations (ED-50: 289msec) than DSE (ED-50: 1.25sec) to reach a given degree of inhibition. Maximal inhibition was also greater in DSIFAST neurons than in excitatory autaptic neurons (Fig 3C; Relative inhibition with 10 sec depolarization (baseline = 1.0); DSI: 0.10 ± 0.02, n=6; DSE: 0.36 ± 0.05, n=6). The DSE concentration-response curve was obtained for the present work; the DSE ED-50 value is also used for comparison against DSISLOW autDSI ED-50 values.
We tested the two most likely candidate endocannabinoids, 2-AG and anandamide (arachidonyl ethanolamide, AEA) for their capacity to inhibit IPSCs in DSIFAST neurons. We have previously reported that 2-AG closely mimics autaptic DSE (autDSE) whereas AEA induces an inhibition that does not wash out, an effect that is inconsistent with anandamide mediating autDSE. In DSIFAST neurons, 2-AG readily and reversibly inhibited IPSCs (Fig 3D,F) whereas AEA (3–5µM) irreversibly inhibited IPSCs (Fig. 3D,E, Relative PSC charge: 0.09 ± 0.04, n=3). This result suggests 2-AG and not AEA may be a mediator of autDSI in this population.
Interestingly, the sensitivity of IPSCs to 2-AG inhibition (EC50 686nM; Fig. 3D) is statistically indistinguishable from that for excitatory neurons (Fig. 3D, 310nM, data adapted from (Straiker and Mackie, 2005)).
We next investigated whether the site of cannabinoid action is pre- or post-synaptic in these neurons. Suppression of neurotransmitter release by CB1 receptors often occurs via inhibition of presynaptic calcium channels (Sullivan, 1999). Paired pulse ratios are commonly used to assess a pre- or post-synaptic site of action for inhibition of neurotransmission. We found that the paired pulse ratios increased for both autDSI and for treatment with 2-AG, consistent with a pre-synaptic site of action (Fig 3G,H; control ratio: 0.44 ± 0.03; post-DSI ratio: 0.92 ± 0.11; n=5, p<0.05 by paired t-test; control ratio: 0.50 ± 0.03; post-2-AG ratio: 0.70 ± 0.02, n=4, p<0.05 by paired t-test). Miniature synaptic potentials or ‘minis’ are commonly used as additional evidence for a pre- or post-synaptic site of action, however we found that the low frequency of mIPSCs in DSIFAST neurons prevented this type of analysis.
DSISLOW Neurons
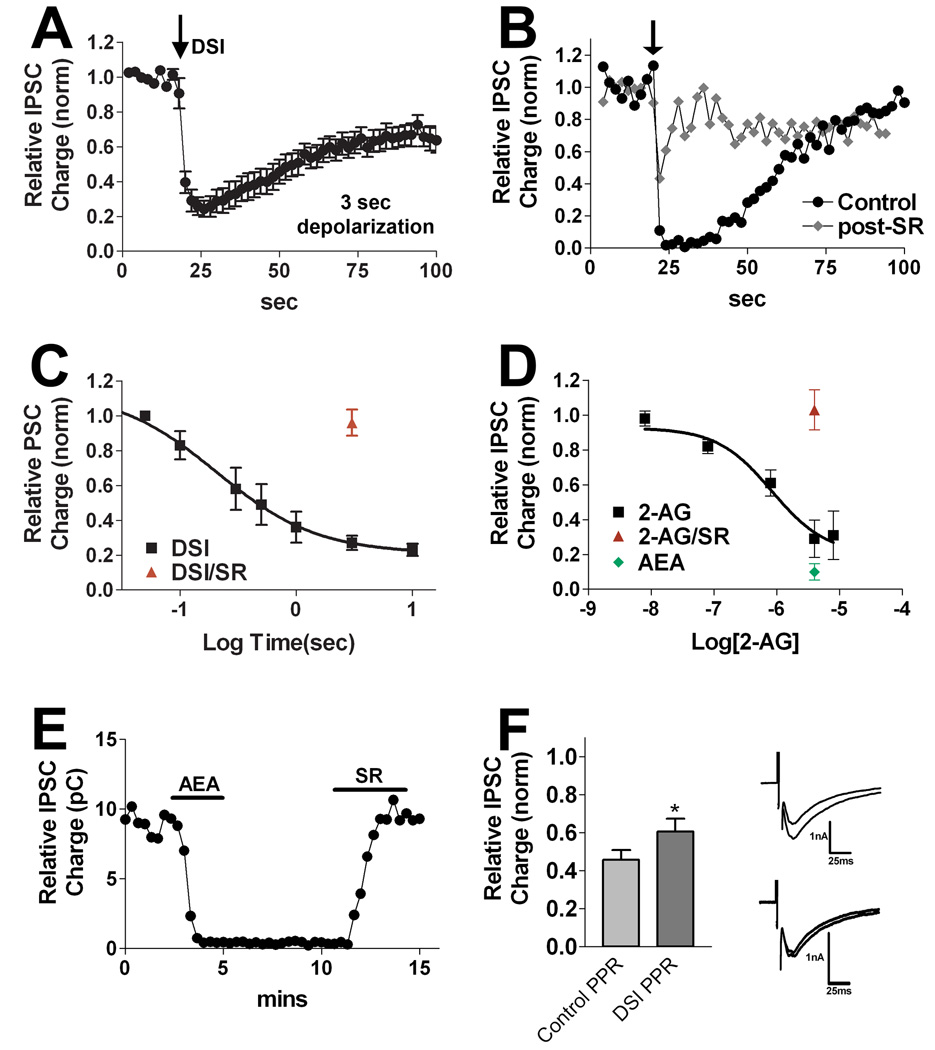
We also examined a second population with a pronounced and longer duration DSI-like response. We investigated whether the inhibition observed after neuronal depolarization was sensitive to CB1 receptor antagonists. We depolarized the neurons as previously described, then treated the same neuron with the CB1 antagonist SR and repeated the stimulus. The cannabinoid receptor antagonist strongly diminished the response to depolarization (Fig. 4B,C, inhibition in response to 3 second depolarization: 0.27 ± 0.05, n=17; inhibition with SR-treatment (200nM): 0.96 ± 0.07, n=4, p<0.0001 unpaired t-test). As in the case of DSIFAST neurons we will refer to this inhibition as autDSE. Due to the relatively slow DSI recovery time (see Fig. 8), we designated the neuronal type as DSISLOW.
Figure 4. DSISLOW neurons exhibit a distinct form of DSI.
A) Averaged time course in response to DSI stimulus (3 s depolarization to 0 mV). B) Sample DSI time course in a single cell before and after treatment with the CB1 antagonist SR141716 (200nM; diamonds). C) Relationship between depolarization duration and extent of DSI using a range of depolarizations from 50ms to 10 sec. A three second depolarization in the presence of SR141716 (200nM, triangle, n=4) produced no DSI. D) Concentration response for the eCB 2-AG as well as single points for 2-AG (5µM) in the presence of SR141716 (200nM, n=4) and for anandamide (5µM, n=3). E) Sample time course showing the response to anandamide (AEA, 5μM), and its reversal by SR141716 (200nM). F) Bar graph showing paired pulse ratios under control conditions and after DSI. Inset shows sample IPSCs. In a given set, the amplitude of the second IPSC is normalized to the first IPSC.
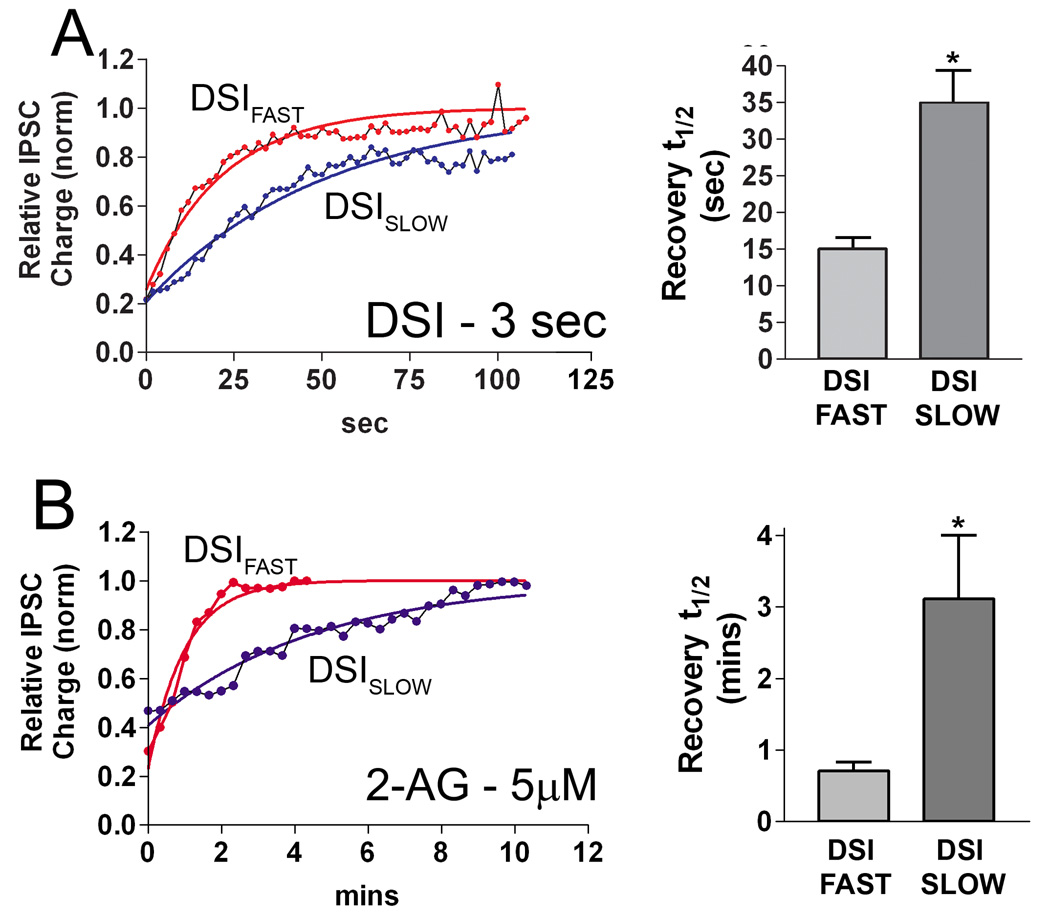
Figure 8. Recovery from DSI and 2-AG inhibition diverge for DSIFAST and DSISLOW neurons.
A) Duration of DSI (3 sec) in DSIFAST and DSISLOW neurons. Bar graph in the right panel shows t1/2 values with 99% confidence intervals. B) Duration of 2-AG (5µM) inhibition in DSIFAST vs. DSISLOW neurons. Bar graph in the right panel shows t1/2 values with 99% confidence intervals. *, 99% confidence intervals do not overlap.
We then determined an autDSI concentration response by varying the depolarization times (Fig 4C) as for DSIFAST neurons. The concentration response was generally similar to that for DSIFAST, and while at 207 msec, the ED-50 appeared briefer than that for DSIFAST autDSI (ED-50: 286 msec) this was not statistically significant (99% confidence intervals overlapped). However the ED-50 was nearly an order of magnitude briefer than for DSE (ED-50: 1.25 sec). The maximum autDSI seen with DSISLOW neurons (0.23 of baseline) was somewhat higher than that for excitatory neurons.
As with DSIFAST neurons, we tested the two chief candidate endocannabinoids, 2-AG and AEA. 2-AG readily inhibited IPSCs (e.g. Fig. 2B3, 3µM) and recovered on washout of 2-AG, but did so over a longer timecourse than was the case in DSIFAST neurons (see Fig 8). Here, too, the 2-AG concentration response (EC50 833nM) is indistinguishable from that for excitatory neurons (Fig. 4D). 5µM 2-AG inhibition is blocked by 200nM SR (Fig. 4D, Relative IPSC charge: 1.03 ± 0.06, n=4). AEA (3–5µM) again inhibited readily and irreversibly (Fig. 4D,E, Relative IPSC charge: 0.10 ± 0.03, n=3). This result suggests that 2-AG rather than AEA serves as a mediator of autDSI in this population.
As with DSIFAST neurons, we found that the paired pulse ratios in DSISLOW neurons increased during autDSI, consistent with a pre-synaptic site of action (Fig 4F; control ratio: 0.46. ± 0.05; post-DSI ratio: 0.61 ± 0.07; n=5, p<0.05 by paired t-test). The paired pulse ratio also rose with 2-AG treatment but did not reach statistical significance (control ratio: 0.48 ± 0.05; post-2-AG ratio: 0.59 ± 0.04, n=6, p=0.10 by paired t-test).
Thus there are two populations of inhibitory autaptic neurons with markedly different DSI. Interestingly, in the course of recording from autaptic neurons cultured from CB1 −/− mice, we found that the incidence profile was drastically altered from that shown in Figure 1E.
DSIMINI neurons
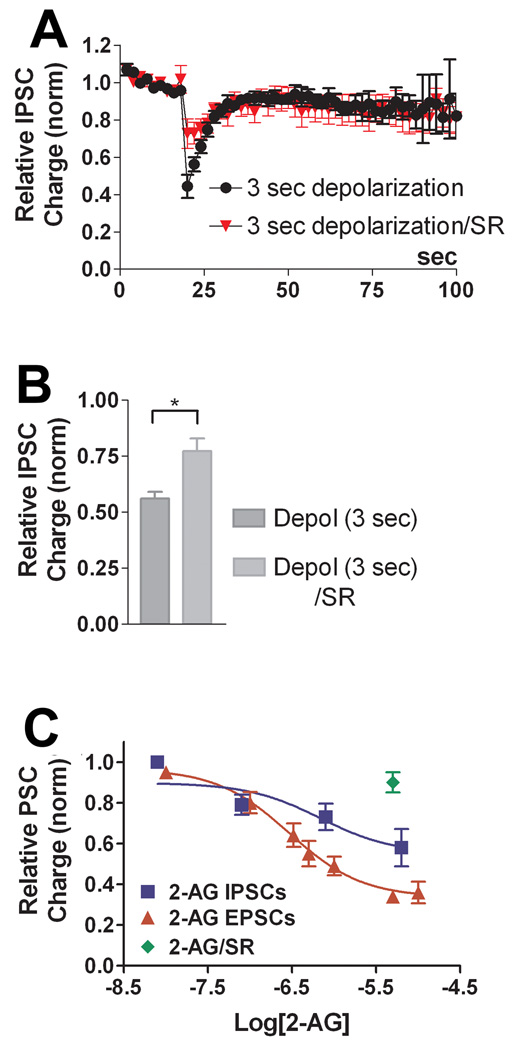
The response to depolarization in a third population of neurons was characteristically brief, generally recovering in <10 seconds. However, neurons that were treated with CB1 antagonist SR141716 (200nM) exhibited a diminished inhibition, suggesting that these cells also express a very modest form of DSI (Fig 5A; relative IPSC inhibition: depol (3 sec), 0.56 ± 0.03 n=10; SR-treated: 0.77 ± 0.06, n=6; p<0.05 by unpaired t-test). We designated this population as DSIMINI for its diminutive form of DSI. We tested whether endogenous cannabinoids inhibited IPSCs in these neurons, finding that 2-AG reliably inhibited IPSCs in these neurons but more modestly than in DSIFAST neurons (Fig 5A,B; EC50: 650nM; 42% inhibition for 2-AG vs. 90% in DSIFAST). The concentration response reflects a relatively modest maximal inhibition. Maximal values for 2-AG and depolarization reached similar values (Fig 5B–C; relative IPSC charge: 2-AG (5–8µM), 0.58 ± 0.09, n=10). These results suggest that DSIMINI neurons have a lower sensitivity to cannabinoids, and impaired endocannabinoid production is unlikely to underlie the weak DSI seen in these neurons. 2-AG (5µM) inhibition was blocked by the CB1 antagonist SR141716 (200nM), implicating CB1 receptors in IPSC inhibition (Fig. 5C; relative IPSC charge: 0.90 ± 0.04, n=4).
Figure 5. DSIMINI neurons exhibit a diminutive form of DSI.
A) In these cells, a brief DSI stimulus (3 sec depolarization, n=10) resulted in a brief inhibition, nonetheless treatment with SR141716 (200nM) diminished this inhibition (n=6). B) Bar graph summarizing results from A. C) Concentration response in DSIMINI neurons for 2-AG (triangles) and 2-AG (5µM) + SR141716 (200nM, diamonds, n=4). The 2-AG concentration response for autEPSCs is included for reference. *, p<0.05 unpaired t-test.
DSINO neurons
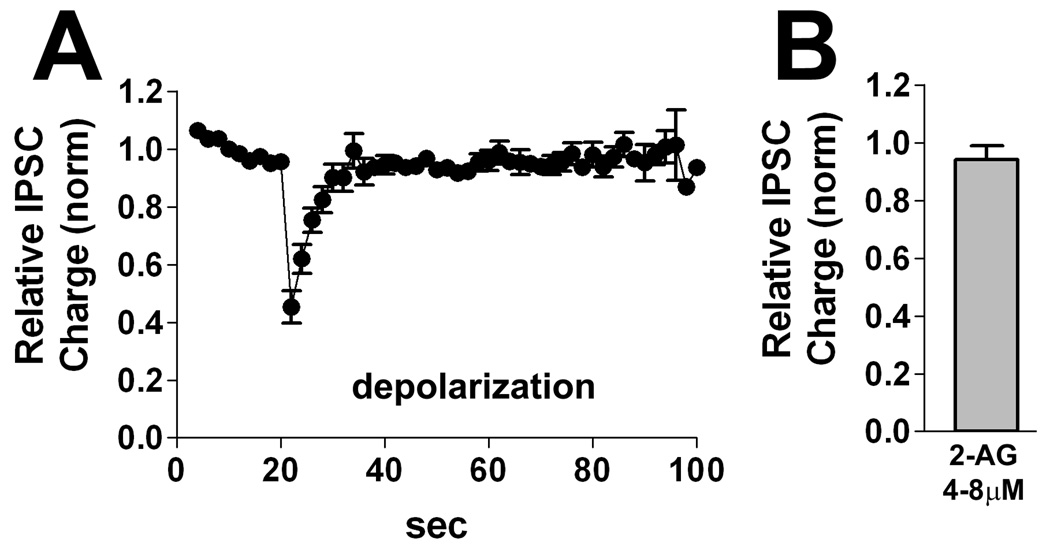
One population of neurons was reliably unresponsive to cannabinoid receptor activation. This population, designated as DSINO, responded only briefly to a 3-second depolarization (Fig. 6A), and not at all to 2-AG (Fig 6B, relative IPSC charge 2-AG(4–8µM): 0.94 ± 0.05, n=5). Since these neurons did not exhibit an eCB response, we did not attempt to reverse this response to depolarization with a CB1 antagonist.
Figure 6. DSINO neurons.
A) Averaged time courses for responses to DSI stimulus (3 sec depolarization) results in only a brief inhibition. B) Summary bar graph showing that application of 2-AG (4–8µM) had little effect on IPSCs in DSINO neurons.
DPI neurons
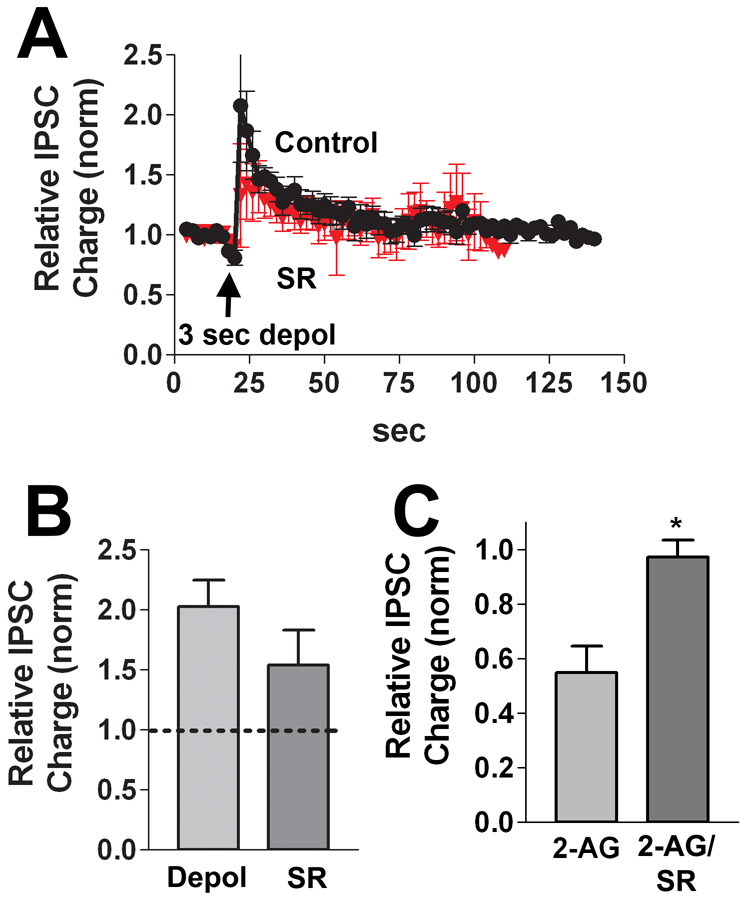
The most peculiar neuronal type we encountered routinely exhibited a potentiation in response to depolarization. We consequently designated these neurons “DPI” for their depolarization induced potentiation of inhibition. A three second depolarization resulted in a greater than 50% potentiation over baseline, recovering over tens of seconds (Fig 7A,B, Relative IPSC charge: 1.75 ± 0.17, n=8). This potentiation therefore resembled an inverse DSI, however this potentiation was still present in neurons treated with SR141716 (Fig. 7A,B, relative IPSC charge: 1.54 ± 0.28, n=6 p>0.05 unpaired t-test vs. control 3 sec depolarization). We found that IPSCs in these neurons were inhibited by 2-AG (1–5µM; Fig 7C, relative IPSC Charge: 0.55 ± 0.10, n=6) and that this inhibition reversed on washout. Furthermore, 2-AG inhibition was prevented by treatment with SR (Fig 7C; relative IPSC charge: 0.97 ± 0.06, n=3; p<0.05 vs. 2-AG unpaired t test vs. 2-AG inhibition).
Figure 7. DPI neurons potentiate in response to depolarization.
A) In these neurons the DSI stimulus (3 sec depolarization) potentiated IPSCs (circles, n=8). Treatment with the CB1 antagonist SR141716 (200nM, triangles, n=6) did not block the potentiation. B) Bar graph summarizing results from A. C) Bar graph summarizing inhibition after 2-AG (1–5µM, n=6) treatment under control conditions and after treatment with SR141716 (200nM, n=3). *, p<0.05 unpaired t-test.
DSIFAST and DSISLOW neurons exhibit differential recovery time courses for autDSI and 2-AG
We examined the time to recovery in the two neuronal populations that exhibited pronounced autDSI. For both DSI and 2-AG, half-life (t1/2) recovery times were briefer in DSIFAST neurons than in DSISLOW neurons (Fig. 8A,B: DSI (3 sec depol) t1/2 DSIFAST: 15 sec; t1/2 DSISLOW: 35 sec; 2-AG (~5µM) t1/2 DSIFAST: 0.71 mins; t1/2 DSISLOW: 3.11 mins; differences are statistically significant for both comparisons with non-overlapping 99% confidence intervals). Recovery from autDSI in DSIFAST neurons is substantially faster than recovery from DSE in autaptic neurons (t1/2 ~37 sec; (Straiker and Mackie, 2005)). Interestingly, recovery in DSISLOW neurons is similar to that for autDSE, raising the possibility that they are controlled by a similar mechanism.
AutDSI recovery time courses in DSIFAST and DSISLOW neurons are differentially regulated by enzymes that break down 2-AG
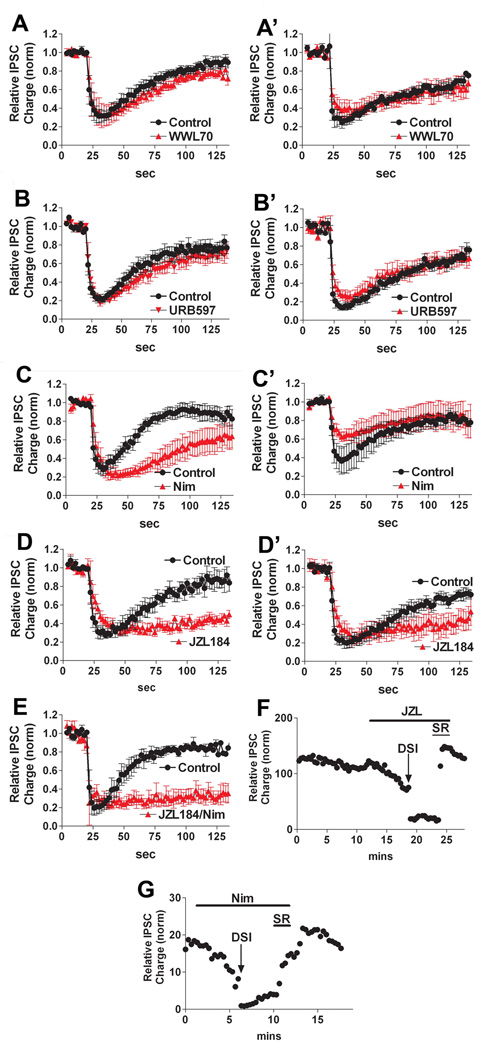
The presence of two populations of inhibitory neurons, grown under identical conditions, with distinct DSI time courses offers a useful opportunity to dissect the basis for the autDSI time course. Several enzymes have been proposed to play a role in 2-AG breakdown, presumably determining the duration of DSI: fatty acid amide hydrolase (FAAH), cyclooxygenase-2 (COX-2), monoacyl glycerol lipase (MGL), α/β-hydrolase domain 6 and 12 (ABHD6 and ABHD12)(Cravatt et al., 1996, Dinh et al., 2002, Blankman et al., 2007). Of these, COX-2 has been shown to play a role in hippocampal DSI in brain slices (Kim and Alger, 2004). A simple mechanism to bring about different time courses would involve differential expression of one or more enzymes capable of breaking down 2AG; i.e. an enzyme that more efficiently hydrolyzes 2-AG would result in briefer DSI, as would expression of more than one enzyme. In order to ascertain which enzyme(s) play a role in 2-AG breakdown in these neurons, we tested the impact on autDSI duration by inhibitors of FAAH (URB597, 100nM (Fegley et al., 2004)), COX-2 (Nimesulide, 30µM (Kim and Alger, 2004)), MGL (JZL184, 100nM (Long et al., 2009)) and ABHD6 (WWL70, 5µM (Blankman et al., 2007)). We found that FAAH and ABHD6 inhibitors had little effect on DSI duration in either DSIFAST or DSISLOW neurons (URB597 100nM, WWL70 5µM, 10 mins; Fig 9A-A’,9B-B’; DSIFAST URB control t1/2: 24 sec (17–39), URB t1/2: 45 sec (28–119), n=5; DSIFAST WWL70 control t1/2: 35 sec (30–38), WWL70 t1/2: 52 sec (46–61), n=5; DSISLOW URB control t1/2: 61 sec (56–68), URB t1/2: 72 sec (60–90), n=5; DSISLOW WWL70 control t1/2: 76 sec (67–87), WWL70 t1/2: 117 sec (86–181), n=4; overlapping 99% confidence intervals for all except DSIFAST WWL70). WWL70 did induce a slight, albeit statistically significant prolongation of DSI in DSIFAST. However DSIFAST autDSI recovery times were substantially prolonged by nimesulide (Nim, 30µM 5 mins, Fig 9C; DSIFAST Nim control t1/2: 23 sec (20–28), Nim t1/2: 70 sec (57–91), n=5, non-overlapping 99% confidence intervals). These results are in agreement with previous results from hippocampal slices (Kim and Alger, 2004). Interestingly, the characteristically slower time course of autDSI in DSISLOW neurons is not regulated by nimesulide (Fig 9C’ DSISLOW Nim control t1/2: 46 sec (34–112), Nim t1/2: 53 sec (37–61), n=4, overlapping 99% confidence intervals). The apparent reduction in IPSC amplitude is not statistically significant (Fig. 9C’: relative IPSC charge control: 0.37 ± 0.14, nimesulide: 0.63 ± 0.05, n=4, p>0.05 paired t-test). The absence of a nimesulide effect on DSISLOW recovery time courses represents a useful internal control for DSIFAST results particularly insofar as nimesulide induces a modest inhibition of IPSCs independently of CB1 (e.g. Fig. 9G) in both populations. Importantly, autDSI in both populations was substantially slowed by MGL blocker JZL184 (100nM, 5 mins; Fig 9D-D’,9F; DSIFAST JZL184 control t1/2: 33 sec (29–37), JZL184 t1/2: 256 sec (187–409), n=5; DSISLOW JZL184 control t1/2: 59 sec (53–66), JZL184 t1/2: 244 sec (161–504), n=5, non-overlapping 99% confidence intervals). As can be seen in the sample time course in Figure 9F, the 1 msec depolarizing stimulus (at 20 sec intervals) was sufficient in the presence of 100nM JZL184 to induce a gradual inhibition of IPSCs, which was fully reversed by SR. This is strong evidence for production of 2-AG during this stimulation paradigm.
Figure 9. DSI duration in DSIFAST and DSISLOW neurons are differentially affected by MGL and COX-2 inhibitors.
A, A’) Time course of DSI in DSIFAST and DSISLOW neurons before (circles) and after (triangles) treatment with an ABHD6 inhibitor, WWL70 (5µM, 10 mins, n=5,4). B, B’) Time course of DSI in DSIFAST neurons before (circles) and after (triangles) treatment with a FAAH inhibitor, URB597 (100 nM, 10 mins, n=6,6). C, C’) Time course of DSI in DSIFAST neurons before (circles) and after (triangles) treatment with a COX-2 inhibitor, nimesulide (30µM, 5 mins, n=5,4). D, D’) Time course of DSI in DSIFAST neurons before (circles) and after (triangles) treatment with a MGL inhibitor, JZL184 (100 nM, 5 mins, n=5,4). E) Time course of DSI in DSIFAST neurons before (circles) and after (triangles) treatment with both JZL184 and nimesulide (concentrations as above, treated for 5 mins, n=3). F) Time course in a DSIFAST neuron showing JZL184 (100nM) gradually decreases IPSCs, DSI in nimesulide, and reversal of IPSC suppression by the CB1 antagonist, SR141716 (200nM). G) Time course in a DSIFAST neuron showing nimesulide (30µM) gradually decreases IPSCs, DSI in JZL184, and reversal of IPSC suppression by the CB1 antagonist SR141716 (200nM).
Although JZL184 substantially slowed recovery times, those recovery times were diminished further when JZL184 and nimesulide were applied together (Fig. 9E, DSIFAST JZL184/Nim control t1/2: 26 sec (23–29), JZL184 t1/2: 541 sec (296–3140), n=3, non-overlapping 99% confidence intervals). Although our results do not rule out a role for ABHD12, for which a selective blocker is not currently available, in each case blockade of MGL/COX-2 appears to account for the bulk of 2-AG breakdown as assessed by recovery from autDSI. The faster autDSI of DSIFAST neurons may therefore occur because of expression of multiple enzymes capable of breaking down 2-AG.
Determinants of the degree of autDSI
We have previously reported that cell geometry predicted the degree of autDSE, with neurons that grow densely packed on a small island of permissive substrate exhibiting a greater degree of autDSE than neurons that grow on larger islands. It is possible that neuronal size and arborization might distinguish between DSIFAST and DSISLOW populations. However, we routinely observed strong autDSI in DSIFAST and DSISLOW neurons growing on large islands, indicating that cell geometry is not a predictor of the degree of autDSI.
Discussion
We have identified four classes of cannabinoid-responsive inhibitory autaptic hippocampal neurons, three of them exhibiting temporally distinct forms of autDSI. As with autDSE, a single autaptic neuron is therefore capable of functionally expressing both the pre- and post-synaptic components of retrograde eCB signalling. This preparation offers an architecturally simple model for detailed investigation of the mechanisms of distinct variants of DSI and how they contrast to those for DSE.
Our experiments utilizing bath application of eCBs indicate that of the two chief putative eCBs 2-AG and anandamide, 2-AG is the more viable candidate to mediate DSI in this preparation. It is noteworthy that the EC-50 for 2-AG is the same for DSIFAST, DSISLOW and for excitatory neurons, while the ED-50 for depolarization for DSI differs greatly from that for DSE. For example, DSI in DSIFAST neurons requires a briefer depolarization yet it has a greater maximal inhibition than autDSE. The difference between the extent of depolarization necessary to evoke autDSI and autDSE in the respective neuronal populations is therefore not due to a differential sensitivity to eCBs. This is consistent with our findings in excitatory autaptic hippocampal neurons (Straiker and Mackie, 2005) and contrasts with a previously outlined argument using conventionally cultured hippocampal neurons (Ohno-Shosaku et al., 2002b). Instead the present study suggests the difference may lie in the relative abilities of these neurons to produce eCBs in response to depolarization, or in the ability of eCBs to access cannabinoid receptors, a difference that is currently not amenable to experimental inquiry.
Assuming that bath-applied eCB can access all CB1 receptors, then exogenous application of a saturating concentration of an eCB that causes autDSI should result in a maximal inhibition similar to that seen with the maximal DSI stimulus. It has not been possible to compare eCB activation and DSI in the same cells in conventional cultures, mainly because of poly-synaptic network considerations. In the autaptic preparation by choosing single-neuron islands, however, we may be confident that all eCB release derives from a single neuron. In principle, glial cells may account for some eCB release, but we have previously reported that the size of a given island (with larger islands consisting of a larger number of astrocytes) has no impact on the degree of autaptic DSE (Straiker and Mackie, 2005). Having measured the maximal inhibition by DSI in a given population, we may thus usefully compare this to the maximal inhibition by an agonist of interest. DSISLOW neurons subjected to autDSI or 2-AG resulted in identical maximal inhibitions (3 second depolarization (0.29 of baseline) and 5µM 2-AG (0.29 of baseline)). In DSIFAST neurons the required duration of depolarization to reach maximum DSI (0.10 of baseline) was 10 seconds, whereas the concentration of 2-AG that induced a maximal response (0.23 of baseline) was 8µM. This result suggests that local concentrations of 2-AG required to achieve full inhibition in DSISLOW populations is approximately 5µM and somewhat in excess of 8µM for DSIFAST neurons. These values are similar to the 5µM calculated for DSE in autaptic neurons (Straiker and Mackie, 2005).
In contrast to the concentration of 2-AG necessary for 50% reduction in IPSCs, there is a considerable difference between the duration of depolarization required to reduce PSCs by 50% in inhibitory versus excitatory neurons. (Presumably, this reflects differences in net eCB production between excitatory and inhibitory neurons.) In DSIFAST neurons, 207 msec was sufficient to produce a calculated local concentration of ~650nM 2-AG. Comparable times were 286 msec in DSISLOW neurons and 1.25 seconds in excitatory neurons, pointing to a profound efficacy of DSIFAST and DSISLOW neurons to produce eCBs.
With respect to the breakdown of eCBs, the more-rapid recovery times for DSIFAST neurons indicates that DSIFAST neurons are either more efficient in metabolizing eCBs or enjoy an advantageous synaptic geometry. That the recovery times for autDSI and 2-AG correlate suggests that this is not solely due to differences in eCB production. These kinetic differences suggest that there may be variations between DSIFAST and DSISLOW neurons in make-up, activation or distribution of the endocannabinoid-degrading enzymes. Our results with blockers of assorted candidate endocannabinoid-degrading enzymes (Figure 9) suggest that the difference is in fact due to the differential distribution of eCB degrading enzymes. Of the four enzymes for which blockers were available and tested, DSI in DSISLOW neurons was only altered by MGL inhibition whereas inhibitors of either MGL or COX-2 substantially prolonged DSI in the faster DSIFAST neurons. This represents the first evidence for control of DSI duration via differential expression of 2-AG degrading enzymes and also the first evidence for cooperative breakdown of endocannabinoids at a single set of synapses.
Subpopulations in neuronal cultures
The question of whether and to what extent cultured neurons retain the distinctive in vivo characteristics of neurons in the brain has implications for their use as a model system in the study of neurotransmission. Specifically, the observation of apparent inhibitory subpopulations in autaptic cultures raises two key questions: 1) can cultured inhibitory neurons be treated as a single population and, 2) to what extent do these apparent subpopulations reflect those in the intact brain?
Regarding the first question, studies using cultured hippocampal neurons often treat these cultured neurons as generic and interchangeable in nature (e.g., either excitatory or inhibitory). The results reported here, combined with our previous report of a subpopulation of excitatory autaptic hippocampal neurons with a distinct cannabinoid response profile (Straiker and Mackie, 2007), suggests that cultured hippocampal neurons cannot be assumed to be homogeneous with respect to eCB-mediated plasticity and likely in many other characteristics.
Regarding the second question, it should be noted that even if these apparent populations do correlate with known or suspected hippocampal interneuron populations in the intact brain, their use as a model for these neurons would be highly limited. For example, autaptic neurons are cultured at an early post-natal age, are cultured in isolation from other neurons, and are forced into a very selective mode of auto-neurotransmission, that at best represents only a portion of their normal in vivo synaptic experience. That being said, the question of whether and to what extent hippocampal interneurons form definable subpopulations has generated considerable interest. A thorough study of interneuron subpopulations in hippocampal slices observed a bewildering number of possible types based on morphology, physiology and neurotransmitter expression (Parra et al., 1998). However other neuroanatomical and functional studies suggest that very important and useful functional distinctions exist (Freund and Buzsaki, 1996, Somogyi and Klausberger, 2005, Glickfeld and Scanziani, 2006).
The prevalence of cannabinoid responses (>80%) and DSI (>70%) among the neurons we have tested is higher than would be expected from immunohistochemical studies (Katona et al., 1999, Tsou et al., 1999). However our sampling of inhibitory neurons may not have yielded a representative distribution: the recordings of inhibitory neurons (which generally have smaller somas) were generally opportunistic (i.e. we were aiming for excitatory neurons but recorded from inhibitory neurons when we found them) and may have been biased in favour of interneurons with larger somas. Alternatively, the autaptic culture conditions may have upregulated cannabinoid receptor expression; or the intensity of CB1 labeling in CCK positive interneurons might obscure lower levels of labelling in other subpopulations, as was the case for CB1 receptors in excitatory hippocampal neurons (Monory et al., 2006).
Summary
Because they represent less than ten percent of cultured hippocampal neurons, and so are encountered too infrequently to yield data sets of sufficient size, inhibitory autaptic hippocampal neurons are generally avoided. The neurons can nonetheless be classified into five populations based on their responses to three stimuli: cannabinoids, a DSI-evoking three second depolarization and a high frequency stimulus. The distinction of such populations among neurons grown under otherwise identical conditions argues for a stable heterogeneity among neurons even when cultured from early post-natal mice (though their relationship to interneuron populations in adult hippocampus remain to be elucidated). The expression of three differential forms of DSI underscores the diversity of endocannabinoid signaling. Using these neurons we favor 2-AG over AEA as mediator of autDSI. We have also found that the difference between the potency and extent of hippocampal DSE and DSI is not due to differential CB1 receptor signaling, but likely is due to differences in eCB production. In what is our most significant finding, we have determined the likely basis for differential durations of autDSE: the differential expression of eCB-degrading enzymes, including cooperative breakdown by COX-2 and MGL in a subset of neurons. This differential expression of eCB-degrading enzymes may serve as a general mechanism to control DSI and DSE time courses.
Footnotes
Publisher's Disclaimer: This is a PDF file of an unedited manuscript that has been accepted for publication. As a service to our customers we are providing this early version of the manuscript. The manuscript will undergo copyediting, typesetting, and review of the resulting proof before it is published in its final citable form. Please note that during the production process errors may be discovered which could affect the content, and all legal disclaimers that apply to the journal pertain.
References
- Bekkers JM, Stevens CF. Excitatory and inhibitory autaptic currents in isolated hippocampal neurons maintained in cell culture. Proc Natl Acad Sci U S A. 1991;88:7834–7838. doi: 10.1073/pnas.88.17.7834. [DOI] [PMC free article] [PubMed] [Google Scholar]
- Blankman JL, Simon GM, Cravatt BF. A comprehensive profile of brain enzymes that hydrolyze the endocannabinoid 2-arachidonoylglycerol. Chemistry & biology. 2007;14:1347–1356. doi: 10.1016/j.chembiol.2007.11.006. [DOI] [PMC free article] [PubMed] [Google Scholar]
- Cravatt BF, Giang DK, Mayfield SP, Boger DL, Lerner RA, Gilula NB. Molecular characterization of an enzyme that degrades neuromodulatory fatty-acid amides. Nature. 1996;384:83–87. doi: 10.1038/384083a0. [DOI] [PubMed] [Google Scholar]
- Dinh TP, Carpenter D, Leslie FM, Freund TF, Katona I, Sensi SL, Kathuria S, Piomelli D. Brain monoglyceride lipase participating in endocannabinoid inactivation. Proc Natl Acad Sci U S A. 2002;99:10819–10824. doi: 10.1073/pnas.152334899. [DOI] [PMC free article] [PubMed] [Google Scholar]
- Fegley D, Gaetani S, Duranti A, Tontini A, Mor M, Tarzia G, Piomelli D. Characterization of the fatty-acid amide hydrolase inhibitor URB597: Effects on anandamide and oleoylethanolamide deactivation. J Pharmacol Exp Ther. 2004 doi: 10.1124/jpet.104.078980. [DOI] [PubMed] [Google Scholar]
- Freund TF, Buzsaki G. Interneurons of the hippocampus. Hippocampus. 1996;6:347–470. doi: 10.1002/(SICI)1098-1063(1996)6:4<347::AID-HIPO1>3.0.CO;2-I. [DOI] [PubMed] [Google Scholar]
- Furshpan EJ, MacLeish PR, O'Lague PH, Potter DD. Chemical transmission between rat sympathetic neurons and cardiac myocytes developing in microcultures: evidence for cholinergic, adrenergic, and dual-function neurons. Proc Natl Acad Sci U S A. 1976;73:4225–4229. doi: 10.1073/pnas.73.11.4225. [DOI] [PMC free article] [PubMed] [Google Scholar]
- Glickfeld LL, Scanziani M. Distinct timing in the activity of cannabinoid-sensitive and cannabinoid-insensitive basket cells. Nat Neurosci. 2006 doi: 10.1038/nn1688. [DOI] [PMC free article] [PubMed] [Google Scholar]
- Isokawa M, Alger BE. Retrograde endocannabinoid regulation of GABAergic inhibition in the rat dentate gyrus granule cell. J Physiol. 2005;567:1001–1010. doi: 10.1113/jphysiol.2005.094219. [DOI] [PMC free article] [PubMed] [Google Scholar]
- Katona I, Sperlagh B, Sik A, Kafalvi A, Vizi ES, Mackie K, Freund TF. Presynaptically located CB1 cannabinoid receptors regulate GABA release from axon terminals of specific hippocampal interneurons. J Neurosci. 1999;19:4544–4558. doi: 10.1523/JNEUROSCI.19-11-04544.1999. [DOI] [PMC free article] [PubMed] [Google Scholar]
- Kim J, Alger BE. Inhibition of cyclooxygenase-2 potentiates retrograde endocannabinoid effects in hippocampus. Nat Neurosci. 2004;7:697–698. doi: 10.1038/nn1262. [DOI] [PubMed] [Google Scholar]
- Kreitzer AC, Regehr WG. Cerebellar depolarization-induced suppression of inhibition is mediated by endogenous cannabinoids. J Neurosci. 2001a;21:RC174. doi: 10.1523/JNEUROSCI.21-20-j0005.2001. [DOI] [PMC free article] [PubMed] [Google Scholar]
- Kreitzer AC, Regehr WG. Retrograde inhibition of presynaptic calcium influx by endogenous cannabinoids at excitatory synapses onto Purkinje cells. Neuron. 2001b;29:717–727. doi: 10.1016/s0896-6273(01)00246-x. [DOI] [PubMed] [Google Scholar]
- Levison SW, McCarthy KD. Characterization and partial purification of AIM: a plasma protein that induces rat cerebral type 2 astroglia from bipotential glial progenitors. J Neurochem. 1991;57:782–794. doi: 10.1111/j.1471-4159.1991.tb08220.x. [DOI] [PubMed] [Google Scholar]
- Llano I, Leresche N, Marty A. Calcium entry increases the sensitivity of cerebellar Purkinje cells to applied GABA and decreases inhibitory synaptic currents. Neuron. 1991;6:565–574. doi: 10.1016/0896-6273(91)90059-9. [DOI] [PubMed] [Google Scholar]
- Long JZ, Li W, Booker L, Burston JJ, Kinsey SG, Schlosburg JE, Pavon FJ, Serrano AM, Selley DE, Parsons LH, Lichtman AH, Cravatt BF. Selective blockade of 2-arachidonoylglycerol hydrolysis produces cannabinoid behavioral effects. Nature chemical biology. 2009;5:37–44. doi: 10.1038/nchembio.129. [DOI] [PMC free article] [PubMed] [Google Scholar]
- Matsuda LA, Lolait SJ, Brownstein MJ, Young AC, Bonner TI. Structure of a cannabinoid receptor and functional expression of the cloned cDNA. Nature. 1990;346:561–564. doi: 10.1038/346561a0. [DOI] [PubMed] [Google Scholar]
- Melis M, Pistis M, Perra S, Muntoni AL, Pillolla G, Gessa GL. Endocannabinoids mediate presynaptic inhibition of glutamatergic transmission in rat ventral tegmental area dopamine neurons through activation of CB1 receptors. J Neurosci. 2004;24:53–62. doi: 10.1523/JNEUROSCI.4503-03.2004. [DOI] [PMC free article] [PubMed] [Google Scholar]
- Monory K, Massa F, Egertova M, Eder M, Blaudzun H, Westenbroek R, Kelsch W, Jacob W, Marsch R, Ekker M, Long J, Rubenstein JL, Goebbels S, Nave KA, During M, Klugmann M, Wolfel B, Dodt HU, Zieglgansberger W, Wotjak CT, Mackie K, Elphick MR, Marsicano G, Lutz B. The endocannabinoid system controls key epileptogenic circuits in the hippocampus. Neuron. 2006;51:455–466. doi: 10.1016/j.neuron.2006.07.006. [DOI] [PMC free article] [PubMed] [Google Scholar]
- Ohno-Shosaku T, Maejima T, Kano M. Endogenous cannabinoids mediate retrograde signals from depolarized postsynaptic neurons to presynaptic terminals. Neuron. 2001;29:729–738. doi: 10.1016/s0896-6273(01)00247-1. [DOI] [PubMed] [Google Scholar]
- Ohno-Shosaku T, Shosaku J, Tsubokawa H, Kano M. Cooperative endocannabinoid production by neuronal depolarization and group I metabotropic glutamate receptor activation. Eur J Neurosci. 2002a;15:953–961. doi: 10.1046/j.1460-9568.2002.01929.x. [DOI] [PubMed] [Google Scholar]
- Ohno-Shosaku T, Tsubokawa H, Mizushima I, Yoneda N, Zimmer A, Kano M. Presynaptic cannabinoid sensitivity is a major determinant of depolarization-induced retrograde suppression at hippocampal synapses. J Neurosci. 2002b;22:3864–3872. doi: 10.1523/JNEUROSCI.22-10-03864.2002. [DOI] [PMC free article] [PubMed] [Google Scholar]
- Parra P, Gulyas AI, Miles R. How many subtypes of inhibitory cells in the hippocampus? Neuron. 1998;20:983–993. doi: 10.1016/s0896-6273(00)80479-1. [DOI] [PubMed] [Google Scholar]
- Pitler TA, Alger BE. Postsynaptic spike firing reduces synaptic GABAA responses in hippocampal pyramidal cells. J Neurosci. 1992;12:4122–4132. doi: 10.1523/JNEUROSCI.12-10-04122.1992. [DOI] [PMC free article] [PubMed] [Google Scholar]
- Somogyi P, Klausberger T. Defined types of cortical interneurone structure space and spike timing in the hippocampus. J Physiol. 2005;562:9–26. doi: 10.1113/jphysiol.2004.078915. [DOI] [PMC free article] [PubMed] [Google Scholar]
- Straiker A, Mackie K. Depolarization-induced suppression of excitation in murine autaptic hippocampal neurones. J Physiol. 2005;569:501–517. doi: 10.1113/jphysiol.2005.091918. [DOI] [PMC free article] [PubMed] [Google Scholar]
- Straiker A, Mackie K. Metabotropic suppression of excitation in murine autaptic hippocampal neurons. J Physiol. 2007;578:773–785. doi: 10.1113/jphysiol.2006.117499. [DOI] [PMC free article] [PubMed] [Google Scholar]
- Sullivan JM. Mechanisms of cannabinoid-receptor-mediated inhibition of synaptic transmission in cultured hippocampal pyramidal neurons. J Neurophysiol. 1999;82:1286–1294. doi: 10.1152/jn.1999.82.3.1286. [DOI] [PubMed] [Google Scholar]
- Tamamaki N, Yanagawa Y, Tomioka R, Miyazaki J, Obata K, Kaneko T. Green fluorescent protein expression and colocalization with calretinin, parvalbumin, and somatostatin in the GAD67-GFP knock-in mouse. J Comp Neurol. 2003;467:60–79. doi: 10.1002/cne.10905. [DOI] [PubMed] [Google Scholar]
- Trettel J, Fortin DA, Levine ES. Endocannabinoid signalling selectively targets perisomatic inhibitory inputs to pyramidal neurones in juvenile mouse neocortex. J Physiol. 2004;556:95–107. doi: 10.1113/jphysiol.2003.058198. [DOI] [PMC free article] [PubMed] [Google Scholar]
- Tsou K, Mackie K, Sanudo-Pena MC, Walker JM. Cannabinoid CB1 receptors are localized primarily on cholecystokinin-containing GABAergic interneurons in the rat hippocampal formation. Neuroscience. 1999;93:969–975. doi: 10.1016/s0306-4522(99)00086-x. [DOI] [PubMed] [Google Scholar]
- Vincent P, Armstrong CM, Marty A. Inhibitory synaptic currents in rat cerebellar Purkinje cells: modulation by postsynaptic depolarization. J Physiol. 1992;456:453–471. doi: 10.1113/jphysiol.1992.sp019346. [DOI] [PMC free article] [PubMed] [Google Scholar]
- Wilson RI, Kunos G, Nicoll RA. Presynaptic specificity of endocannabinoid signaling in the hippocampus. Neuron. 2001;31:453–462. doi: 10.1016/s0896-6273(01)00372-5. [DOI] [PubMed] [Google Scholar]
- Wilson RI, Nicoll RA. Endogenous cannabinoids mediate retrograde signalling at hippocampal synapses. Nature. 2001;410:588–592. doi: 10.1038/35069076. [DOI] [PubMed] [Google Scholar]


