Abstract
Cavities formed by osteoclasts on the surface of cancellous bone during bone remodeling (resorption cavities) are believed to act as stress risers and impair cancellous bone strength and stiffness. Although resorption cavities are readily detected as eroded surfaces in histology sections, identification of resorption cavities in three-dimensional images of cancellous bone has been rare. Here we use sub-micron resolution images of rat lumbar vertebral cancellous bone obtained through serial milling (n=5) to determine how measures of the number and surface area of resorption cavities are influenced by image resolution. Three-dimensional images of a 1mm cube of cancellous bone were collected at 0.7 X 0.7 X 5.0 μm/voxel using fluorescence based serial milling and uniformly coarsened to four other resolutions ranging from 1.4 X 1.4 X 5.0 to 11.2 X 11.2 X 10 μm/voxel. Cavities were identified in the three-dimensional image as an indentation on the cancellous bone surface and were confirmed as eroded surfaces by viewing two-dimensional cross-sections (mimicking histology techniques). The number of cavities observed in the 0.7 X 0.7 X 5.0 μm/voxel images (22.0 ± 1.43, mean ± SD) was not significantly different from that in the 1.4 X 1.4 X 5.0 μm/voxel images (19.2 ± 2.59) and an average of 79% of the cavities observed at both of these resolutions were coincident. However, at lower resolutions, cavity detection was confounded by low sensitivity (<20%) and high false positive rates (>40%). Our results demonstrate that when image voxel size exceeds 1.4 X 1.4 X 5.0 μm/voxel identification of resorption cavities by bone surface morphology is highly inaccurate. Experimental and computational studies of resorption cavities in three-dimensional images of cancellous bone may therefore require images to be collected at resolutions of 1.4 μm/pixel in-plane or better to ensure consistent identification of resorption cavities.
INTRODUCTION
The amount of bone remodeling in the skeleton has been shown to contribute to the prediction of fracture incidence, independent of bone mineral density [1]. These findings have led to the suggestion that bone remodeling can influence the apparent mechanical properties of cancellous bone independent of bone mass [2, 3]. Although there are many potential explanations for how bone remodeling might have a disproportionate effect on bone biomechanics, the most frequently cited explanation is that cavities formed on the surface of cancellous bone during the remodeling process (resorption cavities) act as stress risers and promote bone fragility [4].
Finite element models support the idea that resorption cavities can greatly increase local tissue strains in cancellous bone. Finite element models in which resorption cavities are added digitally to individual trabeculae [5] and whole regions of cancellous bone [6, 7] suggest that resorption cavities cause local stress concentrations and may alter cancellous bone strength and stiffness. A limitation of these theoretical studies, however, is that cavities are added digitally and are of artificial shape, size and location. McNamara and colleagues used finite element models derived from high-resolution (0.7 μm X 0.7 μm X 5.0 μm) three-dimensional images of individual trabeculae to estimate the stress concentration factors associated with resorption cavities on three different trabeculae [8]. Their analysis suggested that the elastic stress-concentration factor around cavities ranged from 9.0–14.3 (i.e. stress near the cavity was 9.0–14.3 times larger than the nominal stress applied to the entire trabecula). The work by McNamara and colleagues is unique in that it identified resorption cavities in three-dimensional images of real trabeculae, enabling their biomechanical analysis to consider naturally shaped resorption cavities.
Identification of naturally occurring resorption cavities in three-dimensional images of cancellous bone has been rare due to limitations in imaging modalities. While bone surface irregularities characteristic of resorption, known as the eroded surface (or alternatively the “scalloped surface” or “crenated surface”), can readily be observed in histological sections [9] or by using scanning electron microscopy [10–12], such images do not lend themselves to three-dimensional measurement or biomechanical analysis in cancellous bone structures. Micro-computed tomography, by far the most popular technique to image cancellous bone microarchitecture, has not been used to view resorption cavities at resolutions commonly available (6 μm/voxel or larger). However, higher resolution micro-computed tomography (synchrotron or nano-CT) can achieve voxel sizes of 1 μm or less and are capable of observing resorption cavities [13, 14]. The ability to observe resorption cavities in three-dimensional images is therefore likely to be dependent on image resolution, with cavities becoming increasingly difficult to observe in coarser images. It is not known how image resolution influences the ability to detect individual resorption cavities, but reliable identification of resorption cavities in three-dimensional images is necessary for studies of the effects of cavities on cancellous bone biomechanics.
The long-term goal of this line of investigation is to determine the effects of resorption cavities on cancellous bone mechanics. In the current work we determine how image resolution influences visual identification of resorption cavities in three-dimensional images of cancellous bone.
METHODS AND MATERIALS
Ten-month old female Sprague-Dawley rats (n=5) from a related study were examined in the current study. Animal use occurred under approval of the Case Western Reserve University Institutional Animal Care and Use Committee. The 4th lumbar vertebrae were dissected free from soft tissue and the posterior elements and endplates were removed using a low-speed diamond saw. Marrow was removed with a low pressure water jet. Specimens were fixed in 10% neutral buffered formalin, dehydrated in increasing concentrations of alcohol and embedded undecalcified in methyl methacrylate made opaque through the addition of Sudan black dye [15].
Three-dimensional images of the vertebrae were collected using a technique called serial block face imaging implemented through serial milling. The serial milling approach has been described in detail previously [15]. Serial milling is a sectioning approach similar to serial grinding [16]. During image acquisition the upper 5 μm of the specimen are trimmed away and a mosaic of images of the newly revealed cross-section are collected. The fully-automated process is repeated until the entire specimen has been destructively trimmed away leaving only a high-resolution 3D stack of digital images of the specimen. In our implementation, images were collected using epifluorescent microscopy (a UV filter set is used to identify bone based on bone autofluorescence) and a 10X microscope objective was used to achieve a maximum image resolution of 0.7 X 0.7 μm/pixel in plane and 5 μm out of plane. An in plane resolution of 0.7 μm/pixel is selected because it is similar to resolutions used to examine resorption cavities in synchrotron- and nano-CT images. Because the image resolution was much greater than that obtained by previous researchers using serial block face imaging (who obtained images at 3.3 μm/pixel in plane) [15], more complex image processing techniques are necessary to account for camera positioning error, to compensate for fluorescent signal generated by tissue below the imaging plane and to threshold image noise (we refer the reader to other publications for a detailed description of these methods) [17, 18]. Images obtained through serial milling and processed using these techniques have been shown to allow visualization of resorption cavities on the bone surface [17].
To determine how image resolution influences the ability to detect resorption cavities in three-dimensional images, a reference volume consisting of a 1mm cube of cancellous bone was digitally dissected from the central metaphyseal region of the lumbar vertebra at least 1 mm away from the growth plate. The 0.7 X 0.7 X 5.0 μm voxel gray-scale images were aligned and stacked into a 3D image data set. Subsurface fluorescence signal was removed (as described previously [18] ). From this high-resolution volume, we created synthetic image volumes at lower resolution by averaging samples together. New volumes had voxels of 1.4 X 1.4 X 5 μm, 2.8 X 2.8 X 5 μm, 5.6 X 5.6 X 5 μm, and 11.2 X 11.2 X 10 μm. For clarity we refer to these data sets by their in-plane pixel size (0.7 μm, 1.4 μm, 2.8 μm, 5.6 μm and 11.2 μm, respectively). Three-dimensional volume-renderings of each image at each resolution were obtained using Amira (version 4.1.2, Visage Imaging, Carlsbad, CA). Visualization consisted of a volume rendering of the gray-scale images together with a transparent tetrahedral surface rendering. The surface rendering was included to allow manual labeling of the eroded surfaces. No surface smoothing was applied during visualization. To reduce memory requirements during visualization, each three-dimensional image was divided into two equally sized, overlapping fields of view giving about 9 GB of RAM each for 3D visualization at the highest resolution.
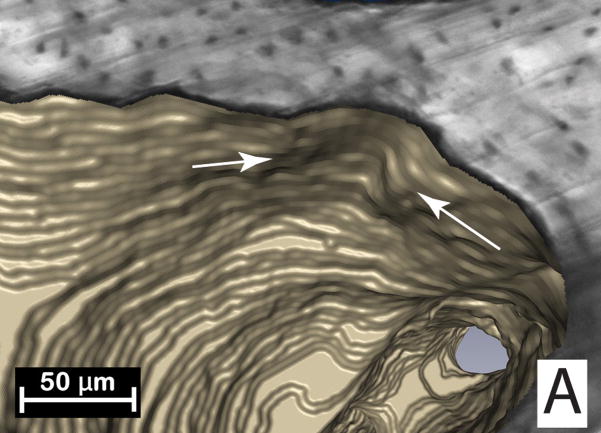
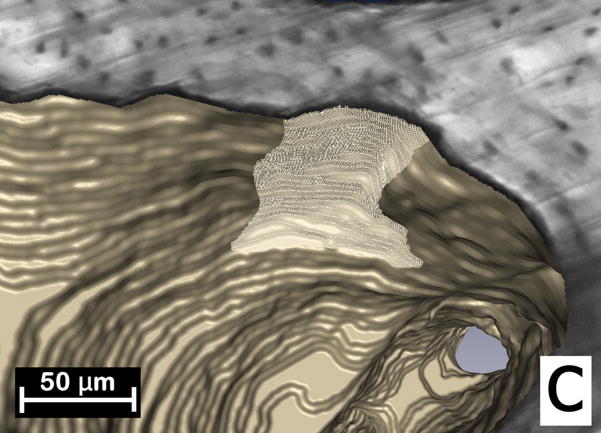
Resorption cavities were initially detected as indentations on the cancellous bone surface (Figure 1). Orthotropic cross-sections of the region were then viewed in the gray-scale image. The indentation on the cancellous bone surface was classified as a resorption cavity only if its surface showed irregularities characteristic of osteoclastic resorption, a classification known in the histomorphometry literature as the eroded surface (also referred to as a “scalloped surface” or “crenated surface” in older literature) [9]. Once the eroded surface was confirmed, the entire resorption cavity was traced manually using tools available in Amira (the Draw Tool module). In the current study a single observer (E.V.T.) labeled all of the eroded surfaces. To evaluate inter-observer variation, a second user (J.R.D.) measured cavities in the 0.7 μm images. Inter-observer variation was expressed as the between-group variance using ANOVA to compare measures made by the two individuals. Additionally, measures were compared using paired t-tests.
Figure 1.
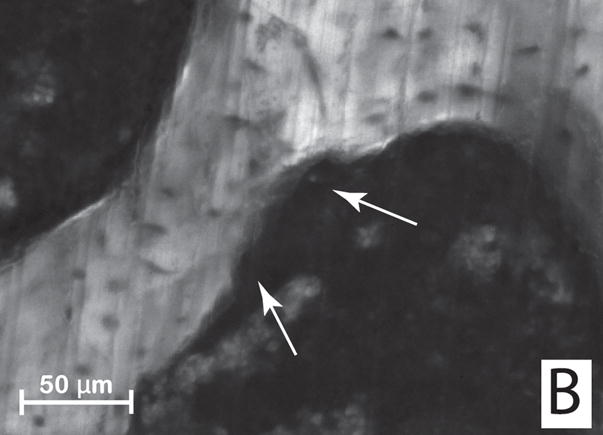
(A) Initial identification of a resorption cavity on the cancellous bone surface is performed by observing an indentation on the cancellous bone surface in the three-dimensional image (arrows). (B) The presence of a cavity is then confirmed by viewing a scalloped surface in a two dimensional cross-section of the gray-scale image (arrows). (C) The cavity is then labeled in the 3D image and recorded for future analysis.
The number of resorption cavities, the surface area of each cavity and the ratio of cavity surface to bone surface (ES/BS using histomorphometry nomenclature) were determined for each specimen at each resolution. Following standard counting convention, measures of the number of cavities consisted of only cavities that were not in contact with a boundary of the 1mm cube as well as cavities that were in contact with three of the 6 sides of the cube (caudal, right, or dorsal) [19]. The average surface area of cavities that were entirely within the reference volume (i.e. not in contact with the boundary of the 1mm cube of cancellous bone) was determined. The distribution of cavity surface area within each resolution was also determined. To provide comparisons between measures made in the three-dimensional images and those achieved using traditional, two-dimensional point-counting techniques, two sections from each specimen (separated 600 μm from each other) were collected at random from the 0.7 μm images. A grid with spacing of 0.07 mm was applied to the image and ES/BS was determined through line intersection counting at a magnification of 10X (mimicking traditional 2D histomorphometry measures).
It is expected that as image voxel size increases (image resolution decreases) detection of resorption cavities will become more difficult, causing the observer to miss some resorption cavities (false negative, Type II error) or erroneously label quiescent bone surface as a resorption cavity (false positive, Type I error). In the current study, detection error was determined relative to measurements made in the highest resolution images (0.7 μm). Bone surfaces labeled as cavities in a lower resolution image were viewed in a three-dimensional image along with the bone surfaces labeled as cavities in the 0.7 μm image. If a cavity was not labeled at a lower resolution but was labeled in the 0.7 μm image it was classified as a false negative. The presence of false negatives was expressed as sensitivity (number of true positives/sum of true positives and false negatives). If a cavity was present in the lower resolution image but not in the 0.7 μm image it was classified as a false positive. False positives are expressed as a proportion of all of the cavities that were observed in the lower resolution image (i.e. the percent of cavities that were counted but are not really cavities). As it is not possible to express the number of true negatives in this assay, specificity was not determined. Comparisons among image resolutions were performed using paired t-test with Bonferroni multiple comparisons.
RESULTS
The percent eroded surface measured in the 0.7 μm images in 3D (2.93 ± 0.45%, mean ± SD) was similar to the percent eroded surface measured through traditional two-dimensional histomorphometry techniques (2.47 ± 0.36%, p = 0.07 in a paired t-test). No significant differences were observed between measurements of cavities made by the two observers (p>0.25). Inter-observer variation accounted for less than 10% of the variance in measurements (Table 1), suggesting that measurement variance was dominated by inter-specimen differences (within group) rather than inter-observer differences (between groups).
Table 1.
Inter-observer variation in resorption cavity measures are shown (n=5).
| Difference Between Observers (mean ± SD) |
Paired t-test (p value) |
Between-group variance (Inter-observer) |
Within Group Variance | |
|---|---|---|---|---|
| ES/BS (%) | 0.16 ± 0.65 | 0.60 | 1.90% | 98.1% |
| Number of Cavities | 1.40 ± 3.13 | 0.37 | 9.10% | 90.9% |
| Number of Cavities/BS (1/mm2 *10−7) | 1.0 ± 2.0 | 0.25 | 4.30% | 95.7% |
| Mean Cavity Area (μm2* 103) | −608 ± 5169 | 0.80 | 0.80% | 99.2% |
Resorption cavities in the highest resolution images (0.7 μm) were readily visible (Figure 2). As image resolution decreased, resorption cavities became more difficult to observe (Figure 2). No resorption cavities were observed in the 11.2 μm images due to the inability to observe eroded surfaces in the two-dimensional cross-sections (Figure 2). The number of resorption cavities observed declined non-linearly with voxel size (Figure 3, Table 2). While no significant differences in the number of cavities were found between the 0.7 μm and 1.4 μm images, a 58% difference in number of cavities was observed between the 1.4 μm and the 2.8 μm images. Consistent with the decline in the number of resorption cavities, the percent eroded surface (ES/BS) measured in the three-dimensional images also declined with increasing voxel size. Small but significant differences in bone volume fraction (BV/TV) and specific surface (BS/TV) were observed among the image resolutions. The mean cavity surface area was increased in lower resolution images (Table 2). As voxel size increased, cavity surface area increased and showed a more uniform distribution (Figure 4). Errors in labeling resorption cavities increased when voxel size exceeded 1.4 μm. In the 1.4 μm image sensitivity was 79% and fewer than 10% of cavities that were labeled were characterized as false positive. However, in the 2.8 μm images, sensitivity was 20% and 42% of the cavities that were identified were classified as false positives. Greater rates of error were observed in more coarse images (Table 2).
Figure 2.
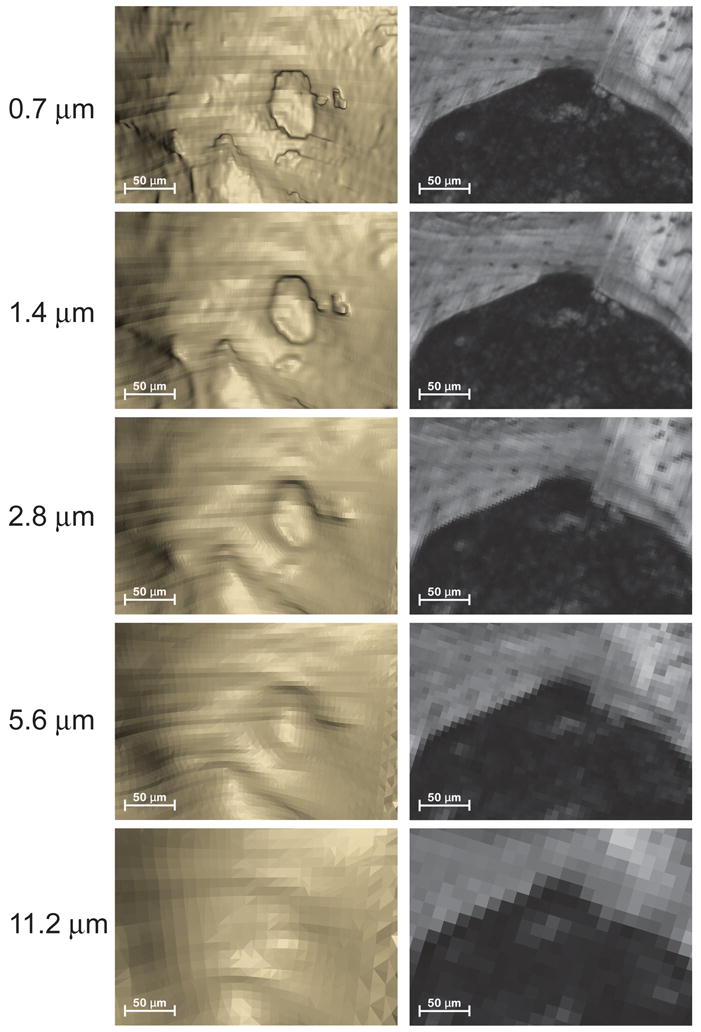
A region of cancellous bone with a resorption cavity is shown at each of the image resolutions considered in the study. The three-dimensional image is shown on the left and a single cross-section from the image is shown on the right. As the voxel size increases the resorption cavity becomes increasingly difficult to observe and bone surface irregularities characteristic of resorption cavities become more difficult to distinguish from other bone surfaces. In images with the largest voxel size the eroded surfaces were not discernable from other bone surfaces and no cavities were found.
Figure 3.
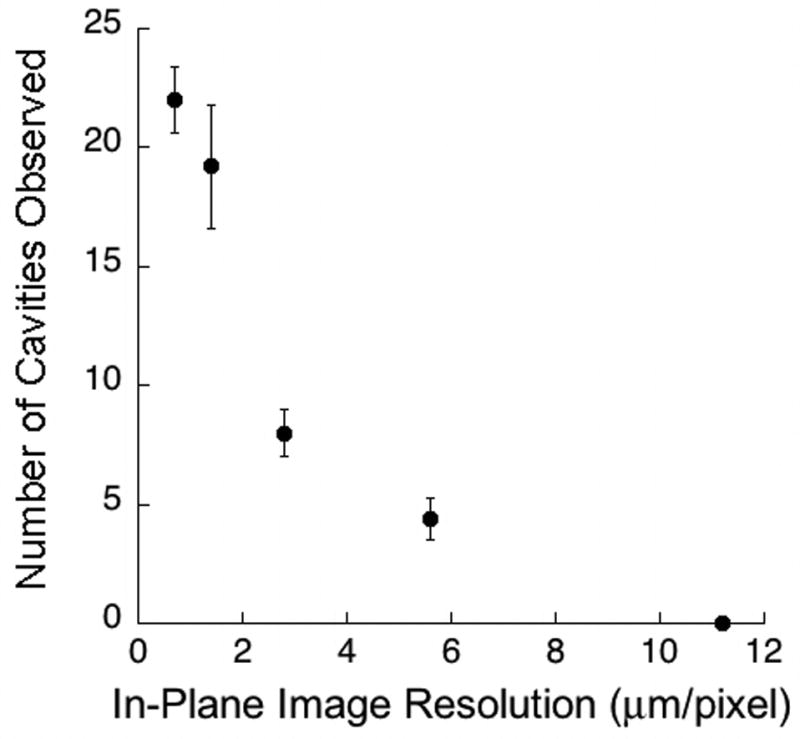
The relationship between the average number of cavities observed in each specimen and the in-plane resolution of the images is shown. There was a non-linear decline in the number of cavities observed as voxel size increased. Error bars represent standard deviations.
Table 2.
Measurements made from three-dimensional images of rat vertebral cancellous bone were performed at five different image voxel sizes (Mean ± SD, n=5 specimens). Results with the same superscript letter are not significantly different from one another (p > 0.05, paired t-test with Bonferroni multiple comparisons). No cavities were observed in images with the largest voxel size.
| Image Voxel Size | |||||
|---|---|---|---|---|---|
| 0.7 μm | 1.4 μm | 2.8 μm | 5.6 μm | 11.2 μm | |
| BV/TV (%) | 33.77 ± 5.80a | 34.27 ± 5.84b | 34.86 ± 5.84c | 35.97 ± 6.02d | 38.52 ± 6.11e |
| BS/TV (1/mm) |
14.92 ± 2.55a | 13.61 ± 2.49b | 12.62 ± 2.46a,b,c | 12.13 ± 2.47c | 10.95 ± 2.23c |
| ES/BS (%) | 2.93 ± 0.45a | 2.74 ± 0.51a,b | 2.26 ± 0.48b | 1.01 ± 0.30c | 0.00d |
| Number of Cavities | 22.00 ± 1.41a | 19.20 ± 2.59a | 8.00 ± 1.00b | 4.40 ± 0.89c | 0.00d |
| Number of Cavities/BS (1/mm2) | 1.52 ± 0.36a | 1.47 ± 0.40a | 0.65 ± 0.15 | 0.37 ± 0.09 | 0.00 |
| Mean Cavity Surface Area (μm2* 103) | 14.29 ± 1.91a | 16.47 ± 4.24a,c | 34.43 ± 7.31b | 27.02 ± 4.67b,c | NA |
| Sensitivity (%) | 100.00 | 78.85 ± 6.12 | 19.77 ± 6.64 | 11.20 ± 6.05 | 0.00 |
| False Positives (% cavities labeled in lower resolution not present in 0.7 μm images) | 0.00 | 9.33 ± 2.00 | 42.70 ± 16.17 | 43.67 ± 25.51 | NA |
Figure 4.
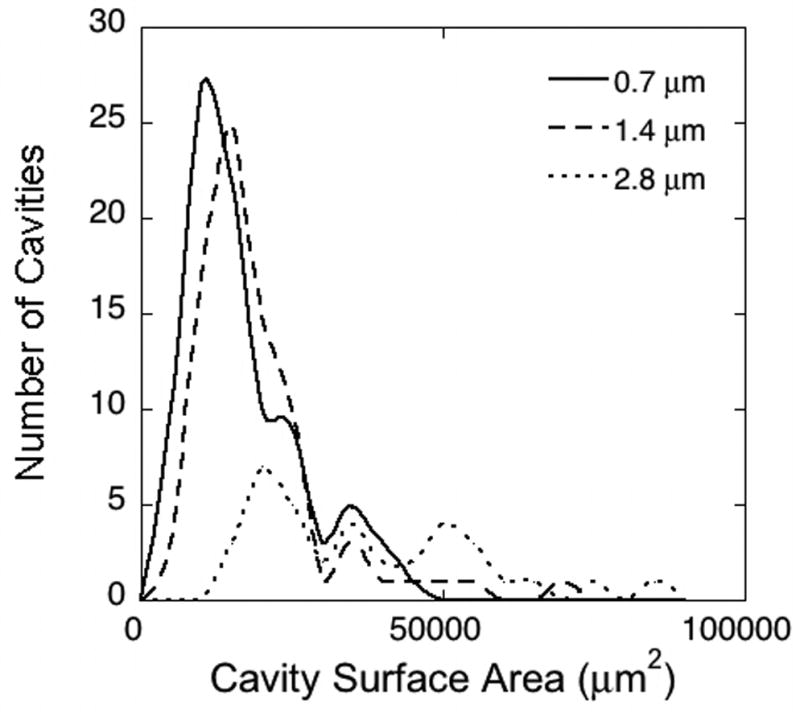
Histograms showing the distribution of cavity surface size for three different image resolutions (identified by in-plane pixel size). Cavities observed in 0.7 μm and 1.4 μm images showed a similar size distribution, while cavities observed in lower resolution images (2.8 μm shown here) were less numerous and were larger in surface size.
DISCUSSION
Based on the current analysis, the ability to detect resorption cavities in three-dimensional images of cancellous bone declines markedly when the voxel size exceeds 1.4 X 1.4 X 5.0 μm/voxel, suggesting that in-plane resolutions of 1.4 μm/pixel or better are required to reliably detect resorption cavities in three-dimensional images of cancellous bone. One implication of this finding is that if a study is to measure and quantify resorption cavities in a three-dimensional image it must utilize images with 1.4 μm/pixel or better to avoid large errors in cavity identification. Accurate quantification of cavities is necessary to understand the effects of cavities on cancellous bone biomechanics.
A strength of the current approach is that cavities are detected and confirmed in two ways: first through visualization of an indentation on the cancellous bone surface in a 3D image and second by viewing the eroded surface of the cavity using a two-dimensional cross-section. Previous approaches have identified cavities based on the indentation on the cancellous bone surface [8, 14] or identification of the eroded surface in the two dimensional cross-section (a standard histomorphometry approach) [9] but not both. For this reason we consider the current approach to be more conservative than other approaches of identifying resorption cavities (although it may be less conservative than immunohistochemical methods, see below). We are not aware of previous studies that have quantified resorption cavities in three-dimensional images of such large specimens of cancellous bone and confirmed such identifications using microscopy-based cross-sections. Additionally, no significant differences in ES/BS were observed between the new three-dimensional measure presented here and a more traditional two-dimensional method, strongly supporting the validity of the three-dimensional measurements. Another advantage to the current approach is that it can provide information on the number and surface area of individual resorption cavities in cancellous bone. Traditional, two-dimensional histomorphometry approaches cannot measure the number or size of individual resorption cavities because it is not possible to determine if two isolated eroded surfaces in a two-dimensional section are truly different resorption cavities [20]. Additionally, by examining resorption cavities in a three-dimensional image, the current approach could be used to evaluate the biomechanical effects of cavities in entire cancellous bone specimens using finite element modeling (so far only individual trabeculae have been examined). A final strength of measuring eroded surfaces using our technique is that each labeled cavity is recorded for future examination. This made it possible to directly compare labeled regions at two different resolutions and determine the number of false negative and false positive cavities.
There are a number of limitations that must be considered when evaluating the current study, however. First, the images used in the current study had voxels with aspect ratios (the ratio of largest to smallest voxel dimension) as large as 7.14. This large aspect ratio is due to limitations in the positioning repeatability of the image acquisition device, which prevent the vertical dimension of each voxel from being less than 5 μm (see Kazakia et al. for details [15]). The large aspect ratio may influence our ability to detect resorption cavities in the vertical plane of each image since bone surface irregularities are less likely to be visible in that plane. The thickness of each slice of the image, however (5 μm) is similar to that used in traditional histomorphometry, suggesting that specimen thickness is not influencing observations of eroded surfaces when viewed in-plane. However, it remains possible that images with more cubic voxels (aspect ratios closer to 1.0) may be able to reliably detect resorption cavities at a lower resolution than was possible in the current study. Second, identification of resorption cavities in the current study was performed based on bone surface morphology (eroded surfaces) alone and did not specify the presence of active osteoclastic resorption as can be achieved using tartrate-resistant acid phosphatase (TRAP) staining. While morphological identification is sufficient to identify eroded surfaces [9], confirmation of osteoclast presence is required to identify active bone resorption. The image acquisition method used in the current study does not have the capability to perform immunohistochemical assays and therefore cannot confirm osteoclastic activity using TRAP staining. However, eroded surfaces (identified based on bone surface morphology) remain a common histomorphometry classification and it is unclear if the presence of active osteoclasts would have any influence on the biomechanical effects of a resorption cavity. Lastly, evaluation of false positive and false negative rates was performed through comparison to measures made in the 0.7 μm images. It is possible that measures made at a higher resolution than 0.7 μm could be more accurate with regard to cavity detection. Traditional histomorphometry is performed through direct observation on a microscope (common 10X microscope objectives range in spatial resolution from 0.61 – 1.10 μm depending on the objective type and light wavelength). To take full advantage of this optical resolution the digital images in the current study would need a pixel size half as large as the optical resolution (~0.31–0.55 μm). We have not observed any evidence that the current study is undersampled with regard to detection of eroded surfaces. For example, measures of eroded surfaces made at 0.7 μm and 1.4 μm are relatively similar (79% of the cavities are coincident at these two resolutions and our comparisons had a power of 90% to detect a difference in ES/BS of 16% between the two groups). As a result it is unlikely that reducing the voxel size below 0.7 μm would lead to very different results, supporting the idea that measurements made at 0.7 μm are an appropriate standard.
We found that detection of resorption cavities in three-dimensional images of cancellous bone showed large errors in images with voxel sizes exceeding 1.4 μm. We believe partial volume effects are the primary cause for such errors. In lower resolution images, bone surface irregularities characteristic of an eroded surface may not be visible, preventing the observer from identifying a cavity. At the same time, the discrete nature of the digital image becomes more pronounced in lower resolution images, potentially causing the bone surface to appear irregular when it is not, leading to erroneous labeling of quiescent bone surfaces as resorption cavities. While resorption cavities are more than 20 μm deep and can be almost a millimeter in length or width [11, 21], resorption cavities are not identified in histomorphometry by their size but by the eroded surface. We measured the bone surface irregularities characterized as eroded surfaces in 0.7 μm images from our study and found such irregularities to commonly be 3–4 μm in length. At a resolution of 1.4 μm the bone surface irregularities typically occupy 2–3 pixels in plane, while in the 2.8 μm images they occupy less than 2 pixels, which we believe explains the marked increase in errors as one moves from a resolution of 1.4 μm to 2.8 μm.
Although the current study utilized images obtained through serial block face imaging implemented through serial milling, our results have implications for the use of other image acquisition methods. Imaging modalities such as micro-computed tomography (particularly synchrotron and nano-CT systems) may achieve cubic voxels of 1.4 μm or less in size and our results suggest that images obtained with these other modalities are also capable of reliably identifying resorption cavities on cancellous bone surfaces. However, there are two technical limitations that currently limit the use of these other imaging modalities for biomechanical studies of resorption cavities in cancellous bone. First, current synchrotron and nano-CT approaches show an increasingly limited field of view as image resolution is increased (i.e. only a small region of cancellous bone can be examined at 1 μm resolutions) [22]. Second, many of the existing systems can physically accommodate only very small specimens when using micron or sub-micron scale imaging due to space limitations in the scanning chambers (often the entire specimen must be less than 2 mm in diameter). Due to these limitations, most synchrotron and nano-CT systems are not able to examine an entire continuum-level specimen of cancellous bone used in biomechanics studies (3–5mm in smallest dimension [23]). Because the serial milling approach used in the current study is not subject to limitations in specimen size or image field of view [15], it is capable of imaging an entire cancellous bone specimen from a biomechanical test at resolutions required for reliably identifying resorption cavities. An additional advantage of the serial milling approach is that it may also be used to image other fluorescent markers such as labels of microscopic tissue damage or bone formation [15, 18, 24], potentially allowing spatial correlations between resorption cavities and microscopic tissue damage or regions of bone formation. A disadvantage of the serial milling approach is the time required for image acquisition (which was ~4 days/rat vertebra at the resolution used in the current study).
In their analysis of resorption cavities on individual trabeculae from rats, McNamara and colleagues used an image resolution identical to the highest resolution image in the current study (0.7 X 0.7 X 5 μm/voxel) and referred to the resorption cavities they observed as “presumptive” resorption cavities [8]. Our analysis suggests that resorption cavities are readily visible in images at this resolution and supports the idea that what McNamara and colleagues refer to as “presumptive” resorption cavities are true resorption cavities, although their detection method appeared to be based on observing indentations on the surface of a 3D image, while our approach utilized both identification of surface indentations in the 3D image as well as observations of bone surface irregularities in the gray scale image (the second step being more consistent with traditional histomorphometry).
The biomechanical importance of resorption cavities remains to be determined. In their examination of three individual trabeculae, McNamara and colleagues found resorption cavities to have a large effect on local tissue stress. In contrast, Eswaran and colleagues used a nano-CT scan (2 μm/voxel) to create a non-linear finite element model of a single canine trabecula displaying a resorption cavity [14]. When the trabecula was loaded in compression, the force-displacement curve was similar to that achieved when the same trabecula was modeled at 20 μm/voxel (although the yield strength appeared to be slightly decreased in the lower resolution image). It is unclear if the differences in these analyses are due to image resolution (0.7 X 0.7 X 5.0 μm/voxel by McNamara et al. and 2 μm/voxel by Eswaran et al.), finite element shape (tetrahedral by McNamara and colleagues v. hexahedral by Eswaran and colleagues), or differences between linear and non-linear modeling approaches (McNamara et al. used a linear modeling approach). As these studies were limited in sample size (together they analyzed a total of 4 individual trabeculae), the biomechanical importance of resorption cavities on the entire cancellous bone structure, if any, remains to be determined.
Acknowledgments
This work was supported by NIH/NIAMS R21 AR054448, T32 AR007505-22 (C.R.S.) and the Case Western Reserve University SOURCE program (E.V.K.). The authors thank Fred Douglas, Chiderah Okoye and Katherine Ehlert for assistance with handling images. Dr. Wilson has an interest in BioInVision, Inc., which may commercialize the serial milling technology.
Footnotes
Publisher's Disclaimer: This is a PDF file of an unedited manuscript that has been accepted for publication. As a service to our customers we are providing this early version of the manuscript. The manuscript will undergo copyediting, typesetting, and review of the resulting proof before it is published in its final citable form. Please note that during the production process errors may be discovered which could affect the content, and all legal disclaimers that apply to the journal pertain.
References
- 1.Garnero P. Markers of bone turnover for the prediction of fracture risk. Osteoporos Int. 2000;11 Suppl 6:S55–65. doi: 10.1007/s001980070006. [DOI] [PubMed] [Google Scholar]
- 2.Parfitt AM. High bone turnover is intrinsically harmful: two paths to a similar conclusion. The Parfitt view. J Bone Miner Res. 2002;17:1558–9. doi: 10.1359/jbmr.2002.17.8.1558. [DOI] [PubMed] [Google Scholar]
- 3.Heaney RP. Is the paradigm shifting? Bone. 2003;33:457–65. doi: 10.1016/s8756-3282(03)00236-9. [DOI] [PubMed] [Google Scholar]
- 4.Hernandez CJ. How can bone turnover modify bone strength independent of bone mass? Bone. 2008;42:1014–20. doi: 10.1016/j.bone.2008.02.001. [DOI] [PMC free article] [PubMed] [Google Scholar]
- 5.Smit TH, Burger EH. Is BMU-coupling a strain-regulated phenomenon? A finite element analysis. J Bone Miner Res. 2000;15:301–7. doi: 10.1359/jbmr.2000.15.2.301. [DOI] [PubMed] [Google Scholar]
- 6.van der Linden JC, Homminga J, Verhaar JA, Weinans H. Mechanical consequences of bone loss in cancellous bone. J Bone Miner Res. 2001;16:457–65. doi: 10.1359/jbmr.2001.16.3.457. [DOI] [PubMed] [Google Scholar]
- 7.Hernandez CJ, Gupta A, Keaveny TM. A biomechanical analysis of the effects of resorption cavities on cancellous bone strength. J Bone Miner Res. 2006;21:1248–55. doi: 10.1359/jbmr.060514. [DOI] [PMC free article] [PubMed] [Google Scholar]
- 8.McNamara LM, Van der Linden JC, Weinans H, Prendergast PJ. Stress-concentrating effect of resorption lacunae in trabecular bone. J Biomech. 2006;39:734–41. doi: 10.1016/j.jbiomech.2004.12.027. [DOI] [PubMed] [Google Scholar]
- 9.Parfitt AM, Drezner MK, Glorieux FH, Kanis JA, Malluche H, Meunier PJ, Ott SM, Recker RR. Bone histomorphometry: standardization of nomenclature, symbols, and units. Report of the ASBMR Histomorphometry Nomenclature Committee. J Bone Miner Res. 1987;2:595–610. doi: 10.1002/jbmr.5650020617. [DOI] [PubMed] [Google Scholar]
- 10.Boyde A, Hobdell M. Scanning electron microscopy of bone. Calcif Tissue Res. 1968;Suppl:4–4B. [PubMed] [Google Scholar]
- 11.Mosekilde L. Consequences of the remodelling process for vertebral trabecular bone structure: a scanning electron microscopy study (uncoupling of unloaded structures) Bone Miner. 1990;10:13–35. doi: 10.1016/0169-6009(90)90046-i. [DOI] [PubMed] [Google Scholar]
- 12.Jones SJ, Boyde A. Histomorphometry of Howship’s lacunae formed in vivo and in vitro: depths and volumes measured by scanning electron and confocal microscopy. Bone. 1993;14:455–60. doi: 10.1016/8756-3282(93)90179-e. [DOI] [PubMed] [Google Scholar]
- 13.Ito M, Ejiri S, Jinnai H, Kono J, Ikeda S, Nishida A, Uesugi K, Yagi N, Tanaka M, Hayashi K. Bone structure and mineralization demonstrated using synchrotron radiation computed tomography (SR-CT) in animal models: preliminary findings. J Bone Miner Metab. 2003;21:287–93. doi: 10.1007/s00774-003-0422-x. [DOI] [PubMed] [Google Scholar]
- 14.Eswaran SK, Allen MR, Burr DB, Keaveny TM. A computational assessment of the independent contribution of changes in canine trabecular bone volume fraction and microarchitecture to increased bone strength with suppression of bone turnover. J Biomech. 2007;40:3424–31. doi: 10.1016/j.jbiomech.2007.05.013. [DOI] [PMC free article] [PubMed] [Google Scholar]
- 15.Kazakia GJ, Lee JJ, Singh M, Bigley RF, Martin RB, Keaveny TM. Automated high-resolution three-dimensional fluorescence imaging of large biological specimens. J Microsc. 2007;225:109–17. doi: 10.1111/j.1365-2818.2007.01721.x. [DOI] [PubMed] [Google Scholar]
- 16.Odgaard A. Three-dimensional methods for quantification of cancellous bone architecture. Bone. 1997;20:315–28. doi: 10.1016/s8756-3282(97)00007-0. [DOI] [PubMed] [Google Scholar]
- 17.Slyfield CR, Tomlinson RE, Tkachenko EV, Niemeyer KE, Pattanacharoenphon CG, Steyer G, Kazakia GJ, Wilson DL, Hernandez CJ. Transactions of the Orthopaedic Research Society. San Francisco, CA, USA: Orthopaedic Research Society; 2008. 3D visualization and measurement of resorption cavities in cancellous bone; p. 956. [Google Scholar]
- 18.Slyfield CR, Niemeyer KE, Tkachenko EV, Tomlinson RE, Steyer G, Pattanacharoenphon CG, Kazakia GJ, Wilson DL, Hernandez CJ. 3D surface texture visualization of bone tissue through epi-fluorescence-based serial block face imaging. J Microsc. 2009 doi: 10.1111/j.1365-2818.2009.03204.x. In Press. [DOI] [PMC free article] [PubMed] [Google Scholar]
- 19.Russ JC. The Image Processing Handbook. 5. Boca Raton, FL, USA: CRC Press; 2007. [Google Scholar]
- 20.Hauge EM, Mosekilde L, Melsen F. Stereological considerations concerning the measurement of individual osteoid seams and resorption cavities. Bone Miner. 1994;26:89–90. doi: 10.1016/s0169-6009(08)80165-1. [DOI] [PubMed] [Google Scholar]
- 21.Garrahan NJ, Croucher PI, Compston JE. A computerised technique for the quantitative assessment of resorption cavities in trabecular bone. Bone. 1990;11:241–5. doi: 10.1016/8756-3282(90)90076-b. [DOI] [PubMed] [Google Scholar]
- 22.Peyrin F, Salome M, Cloetens P, Laval-Jeantet AM, Ritman E, Ruegsegger P. Micro-CT examinations of trabecular bone samples at different resolutions: 14, 7 and 2 micron level. Technol Health Care. 1998;6:391–401. [PubMed] [Google Scholar]
- 23.Hernandez CJ, Keaveny TM. A biomechanical perspective on bone quality. Bone. 2006;39:1173–81. doi: 10.1016/j.bone.2006.06.001. [DOI] [PMC free article] [PubMed] [Google Scholar]
- 24.Bigley RF, Singh M, Hernandez CJ, Kazakia GJ, Martin RB, Keaveny TM. Validity of serial milling-based imaging system for microdamage quantification. Bone. 2008;42:212–5. doi: 10.1016/j.bone.2007.09.043. [DOI] [PubMed] [Google Scholar]


