

Abstract
Non-typeable (NT) or capsule-deficient, Haemophilus influenzae (Hi) is a common commensal of the upper respiratory tract of humans and can be pathogenic resulting in diseases such as otitis media, sinusitis and pneumonia. The lipopolysaccharide (LPS) of NTHi is a major virulence factor that displays substantial intra-strain and inter-strain variation of its oligosaccharide structures. To investigate the genetic basis of LPS variation we sequenced internal regions of each of seven genes required for the biosynthesis of either the inner or the outer core oligosaccharide structures. These sequences were obtained from 25 representative NTHi isolates from episodes of otitis media. We found abundant evidence of recombination among LPS genes of NTHi, a finding in marked contrast to previous analyses of biosynthetic genes for capsular polysaccharide, a well-documented virulence factor of Hi. We found mosaic sequences, linkage equilibrium between loci and a lack of congruence between gene trees. These high rates were not confined to LPS genes since evidence for similar amounts of recombination was also found in eight housekeeping genes in a subset of the same 25 isolates. These findings provide a population based foundation for a better understanding of the role of NTHi LPS as a virulence factor and its potential as a candidate vaccine.
Keywords: LPS biosynthetic genes, Housekeeping genes, Recombination, Non-typeable Haemophilus influenzae, Bacterial population biology, Otitis media
1. Introduction
Haemophilus influenzae (Hi) is a common and exclusively human commensal of the nasopharynx found in up to 80% of the population. It is also pathogenic and causes both acute and chronic diseases. The most common are localised respiratory infections, for example, otitis media (OM), sinusitis, pneumonia and bronchitis. These diseases usually occur when mucociliary and other host clearance mechanisms are impaired. Most of these infections are caused by capsule-deficient or non-typeable (NT) strains of Hi. In contrast, encapsulated Hi, especially those of serotype b, cause invasive bacteremic infections such as meningitis. Whereas there is a considerable body of information on the pathogenesis and population biology of serotype b disease, the biology of infection caused by NTHi is less well understood. Studies of the natural population of Hi indicate that encapsulated strains have a relatively clonal population structure (Musser et al., 1990; Smith-Vaughan et al., 1998; Moor et al., 1999; Feil et al., 2001). In contrast, with few exceptions, NTHi are genetically distinct and encompass greater diversity (Musser et al., 1986; Porras et al., 1986; Smith-Vaughan et al., 1997; Bolduc et al., 2000).
Lipopolysaccharide (LPS) is the predominant surface antigen of Hi and a key molecule implicated in virulence. It is made up of lipid A, a relatively conserved oligosaccharide inner core (Phillips et al., 1993; Masoud et al., 1997) and a highly variant outer core (Patrick et al., 1987; Zamze and Moxon, 1987; Risberg et al., 1999; Campagnari et al., 1987; Fig. 1). Hi LPS lacks evidence of any structural analogues of the repeating side chains (O antigens) of the enterobacteriaceae. Hi LPS structure is extremely diverse, especially that of the outer core, a function of both allelic variation and molecular switching (reviewed in Hood and Moxon, 2002). LPS phenotype is also demonstrably affected by nutrient conditions to which must be added the potential contribution of regulatory and stochastic events during biosynthesis, commonly referred to as microheterogeneity (Langford and Moxon, 1993; Hood and Moxon, 1999). This diversity has implications for the role of LPS in commensal and virulence behaviour and also for its candidacy as a vaccine (Moxon et al., 1998).
Fig. 1.
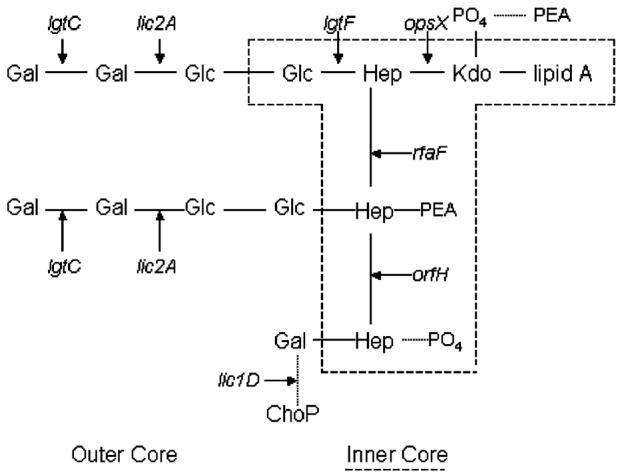
LPS structure of Hi strain RM7004 indicating the inner and outer core LPS biosynthetic genes used in this study. Note that the genes lgtC and lic2A add sugars to two different locations in the LPS structure. (Abbreviations–Galactose (Gal); Glucose (Glc); Heptose (Hep); 2-keto-3-deoxyoctulosonic acid (Kdo); Phosphate (PO4); Phosphoethanolamine (PEA); phosphocholine (ChoP)).
The present study sought to investigate further the extent and origins of the genetic diversity of LPS since this is crucial in determining the well documented phenotypic heterogeneity of the outer and inner core sugars. To this end, we analysed a sub-set of NTHi OM isolates obtained by tympanocentesis from young Finnish children (Hood et al., 1999). We show that these isolates are representative of the diversity in the natural population of NTHi using classical phylogenetic analysis. Through analysis of selected LPS biosynthetic gene sequence, we identified evidence for abundant recombination as one source of this diversity. However, we found no convincing evidence that host immune selection is a factor resulting in LPS diversity. The lack of congruence found in trees of LPS gene sequence in NTHi contrasts markedly with the previously published results obtained for the biosynthetic genes for capsular polysaccharides (Musser et al., 1988) and the apparently clonal population structure of encapsulated strains. These findings have implications for understanding the role of LPS in the pathogenesis of diseases caused by NTHi and the candidacy of LPS as a vaccine for disease control.
2. Materials and methods
2.1. Bacterial isolates
The 25 NTHi isolates used in this study were isolated from children enrolled as part of a series of studies relating to conjugate pneumococcal vaccines conducted by the Finnish Otitis Media Study Group during 1994–1995, previously described by Hood et al. (1999). These 25 OM isolates, selected from a population of 102 that were obtained directly from the middle ear by tympanocentesis of Finnish children with OM, were seen to span a Hi species-level ribotyping dendrogram comprising >400 strains of both typeable and non-typeable Hi collected from around the world over a 35-year period (Bolduc, 1999, Doctoral Thesis. Combining phylogeny and selective DNA sequencing to examine a vaccine candidate. Microbiology Department, Boston University School of Medicine, Boston, MA; Bolduc et al., 2000; Bouchet and Goldstein, unpublished data; Fig. 2). The isolates used in the ribotyping study were; (i) invasive encapsulated serotypes a–f (19%); (ii) invasive NTHi (15%); (iii) respiratory (lung) NTHi (22%); (iv) OM NTHi (35%), and (v) misc. NTHi (9%). Infection sites of encapsulated strains included middle ear, lung, sputum, CSF, blood, and eye. Diverse geographic sources from which isolates were collected included Australia, Canada, Dominican Republic, France, Gambia, Ghana, Holland, India, Kenya, Malaysia, Norway, New Guinea, Sweden, UK and USA. Briefly, EcoRI-based restriction fragment length polymorphism (RFLP; Goldstein et al., 1995) analysis of the ribosomal RNA genes (ribotype) was carried out on the isolates to create a database describing the banding profiles. This was then converted (Nei and Li, 1979; Nei, 1987) into dendrograms using the unweighted pair group method using arithmetic averages (UPGMA; Swofford et al., 1996). The choice of EcoRI restriction endonuclease was based upon in silico analysis of the Hi genome sequence for appropriately conserved restriction sites, one each within the 16S and 23S genes of all 6 Hi ribosomal operons (Fleischmann et al., 1995). As such, EcoRI specific polymorphisms typically reflect upstream and downstream sequence changes in neutral genes flanking the six ribosomal operons. Studies employing the multi-locus sequence typing (MLST) approach (Maiden et al., 1998; Enright and Spratt, 1999) using a sub-set of the chosen isolates provide confirmation of the ribotype RFLP-based population structure (Feil et al., 2001).
Fig. 2.
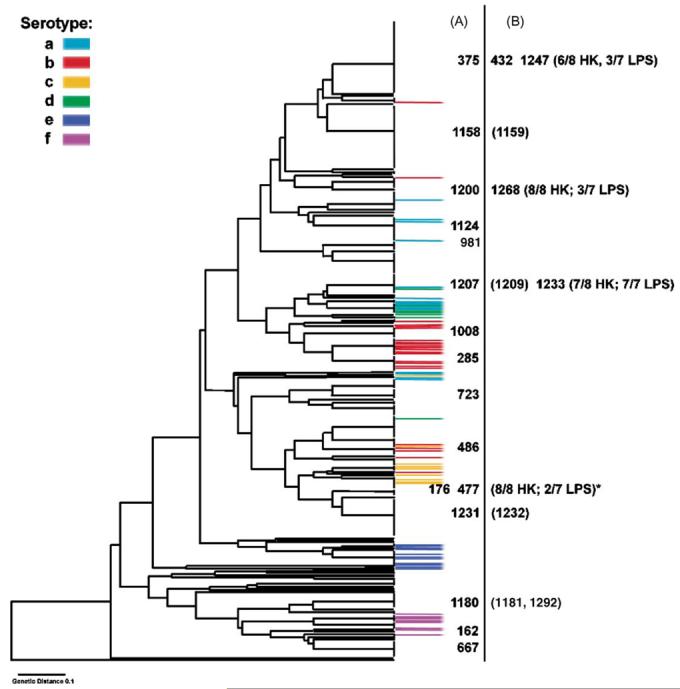
Species-level Hi ribotype dendrogram based on >400 strains to indicate the genetic diversity of a set of 25 Finnish non-typeable isolates obtained from children with otitis media. The isolates in the vertical column A, indicated by numbers, are the core set of the 16 non-redundant isolates selected on the basis of their ribotype for the analysis of linkage equilibrium and congruence. The isolates in column B are either: (i) genetically identical isolates to those in column A taken from the same patient on the same day (isolate number in parenthesis); or (ii) isolates that have the same ribotype as those in column A. In the case of the latter, the numbers of lipopolysaccharide (LPS) and housekeeping (HK) alleles with identical nucleotide sequences are shown in parentheses. An exceptional difference between ribotype and LPS allele sequence was found between isolates 176 and 477 marked (⋆).
This species-level dendrogram afforded the opportunity to select similar isolates as well as isolates with highly divergent RFLP profiles (ribotypes). A total of 16 ribotyping lineages were sampled and of these, seven ribotyping lineages were sampled more than once. These included isolates selected from the same patient on either the same day or within a time period of less than 1 year. Samples taken on the same day were obtained from the right and left middle ear respectively of four patients (isolates 1158 and 1159, 1207 and 1209, 1231 and 1232, and 1180 and 1181). Each pair of isolates obtained on the same day always shared the same ribotyping lineages, but in the majority of cases where isolates were obtained after a period of time, they did not. Isolate 285 was obtained from the same patient as 1158 and 1159, but 10 months earlier. Isolates 162 and 375 were obtained from the same patient but on different dates, 3 months apart. Isolate 486 was obtained from the same patient as 1124 but 7 months earlier. Isolate 1292 was isolated from the same patient as 1180 and 1181, but 1 month later. The remaining 11 samples were single isolates from different children. The core set of 16 non-redundant isolates were selected on the basis of their ribotype for the analysis of linkage equilibrium and congruence.
2.2. DNA sequencing
Oligonucleotide primers for PCR amplification and sequencing of LPS loci were designed where possible to investigate the central portion of the gene, using the Hi KW20 genome sequence. The loci and their functions are listed in Table 1, the primer sequences, each listed in the 5′ to 3′ orientation, are as follows; lgtCfwd, TAAATCAGGAAAATAAGACC; lgtCrev, ATTATTGTATTTATTCATCC; rfaFfwd, GTAAGGCGATTGAAATGC; rfaFrev, ATAGCGCCACAGCATAGC; opsXfwd, CAGGGCCTGAATCTGGCG; opsXrev, GATGCGCTATTAAATATGC; orfHfwd, AACGCACTGCTCAAATGC; orfHrev, TGCGCCTGCGACTAAATG; lgtFfwd, CATTTTAGATTCTGGCAGC; lgtFrev, TACGCGGCTATTGTGGCG; lic1Dfwd, GGAAGATATCCTTGCTC; lic1Drev, CAAGACCAATATAATCGC; lic2Afwd, CTCCATATTACATAAT; lic2Arevi, TGGATTCAGTTGATAGAC; lic2Arevii, CGCTTGGAGTTCTTGAATAC.
Table 1.
(A and B). Summary of genetic variability found in coding-region fragments of genes in a defined population of 25 OM causing isolates of NTHi (Fig. 2)
| Gene | Gene Function | Sequence length (L) |
Segregating sites (S) |
S/L | Mean pairwise distance (±S.E.) |
Maximum pairwise divergence |
Total alleles |
dN/dS |
|---|---|---|---|---|---|---|---|---|
| (A) LPSO | ||||||||
| Inner core | ||||||||
| opsX | Heptosyl transferase | 447 | 55 | 0.123 | 0.031 (0.005) | 0.065 | 18 | 0.125 |
| 53 | 0.119 | 0.032 (0.005) | * | 15 | 0.123 | |||
| rfaF | Heptosyl transferase | 466 | 78 | 0.167 | 0.078 (0.009) | 0.146 | 9 | 0.113 |
| * | * | 0.080 (0.009) | 0.148 | 8 | 0.110 | |||
| orfH | Heptosyl transferase | 399 | 51 | 0.128 | 0.043 (0.006) | 0.091 | 10 | 0.237 |
| * | * | * | * | * | * | |||
| lgtF | Glycosyl transferase | 474 | 56 | 0.118 | 0.042 (0.006) | 0.07 | 14 | 0.064 |
| * | * | 0.043 (0.006) | * | 12 | 0.065 | |||
| Outer core | ||||||||
| lic2A | Glycosyl transferase | 388 | 16 | 0.041 | 0.013 (0.003) | 0.031 | 11 | 0.411 |
| * | * | * | 0.028 | 10 | 0.402 | |||
| lgtC | Glycosyl transferase | 388 | 39 | 0.101 | 0.061 (0.006) | 0.214 | 17 | 0.108 |
| 37 | 0.095 | 0.037 (0.006) | 0.072 | 15 | 0.136 | |||
| lic1D | Phosphocholine transferase | 273 | 68 | 0.249 | 0.093 (0.010) | 0.222 | 12 | 0.140 |
| * | * | 0.094 (0.010) | * | * | 0.156 | |||
| (B) HK | ||||||||
| adk | Adenylate kinase | 449 | 21 | 0.047 | 0.011 (0.003) | 0.025 | 10 | 0.045 |
| atpG | ATP synthase F1 epsilon subunit | 479 | 25 | 0.052 | 0.016 (0.003) | 0.042 | 10 | 0.150 |
| frdB | Fumarate reductase | 490 | 32 | 0.065 | 0.021 (0.004) | 0.051 | 9 | – |
| fucK | l-Fucose permease | 347 | 22 | 0.063 | 0.019 (0.004) | 0.046 | 11 | 0.252 |
| mdh | Malate dehydrogenase | 406 | 42 | 0.103 | 0.032 (0.005) | 0.059 | 14 | 0.028 |
| nrfC | Nitrite reductase | 406 | 5 | 0.012 | 0.005 (0.002) | 0.01 | 6 | 0.292 |
| pgi | Glucose-6-phosphate isomerase | 469 | 58 | 0.124 | 0.040 (0.006) | 0.068 | 11 | 0.068 |
| recA | Recombinase A | 427 | 19 | 0.044 | 0.014 (0.004) | 0.035 | 9 | – |
Results of analysis of 7 LPS biosynthetic genes are shown in (A). Upper and lower column values for LPS genes are those obtained using either all the isolates in the study (25) or only the core set of non-redundant strains (16) respectively (Fig. 2). Identical values are marked with an asterisk. Results of analysis of 8 genes with house-keeping functions in the core set of 16 non-redundant isolates (B). For dN/dS, the symbol (–) signifies an absence of non-synonymous substitutions.
Primers for housekeeping (HK) loci adk, pgi, recA, fucK, and mdh have been described elsewhere (Feil et al., 2001) the remainder were; atpGUP, ATGGCAGGTGCAAAAGAGAT; atpGDN, TTGTACAACAGGCTTTTGCG; nrfCUP, AACTTTGTTTCTGGCATGGG; nrfCDOWN, CGTGAAACTGCACTTGTTGG; frdBUP, CTTATCGTTGGTCTTGCCGT; frdBDN, TTGGCACTTTCCACTTTTCC. PCR conditions were as follows: 94 °C for 1 min, 50 °C for 1 min, 72 °C for 1 min (30 cycles). Sequencing reactions were carried out using the ABI PRISM BigDye™ terminator cycle sequencing kit (Perkin-Elmer) and the following conditions: 96 °C for 30 s, 50 °C for 15 s, 60 °C for 4 min (25 cycles). Sequencing products were ethanol precipitated as per manufacturer's instructions and 4 μl loading buffer were added. Samples were denatured for 3 min at 95°C and snap chilled before loading (2 μl) onto a 4.25% gel on a ABI 377 Automated Sequencer. Chromas (Version 1.44, Conor McCarthy, Qld, Australia) and the GCG GAP program (Wisconsin Package Version 10.0, Genetics Computer Group (GCG), Madison, WI) were used to confirm and edit trace files. Every PCR product was sequenced in both the forward and reverse directions prior to phylogenetic analysis.
2.3. Phylogenetic analysis and tests for recombination
Alignments of sequence were generated using the CLUSTALX program (Thompson et al., 1997). Unweighted parsimony and maximum likelihood (ML) trees were constructed using the 4.0b2 version of PAUP* (Swofford, 1999). Molecular Evolutionary Genetics Analysis (MEGA) software (Kumar et al., 2001) was used to calculate molecular evolutionary parameters (S, S/L, π, dN/dS) and to build neighbour joining (NJ) trees. Sequence Output (http://www.mlst.net) was used to score all unique alleles, and these allelic profiles were imported into the START program to apply the Sawyer's (Sawyer, 1989; Drouin et al., 1999) and Homoplasy (Maynard Smith and Smith, 1998) Tests for recombination (http://outbreak.ceid.ox.ac.uk/software.htm). Linkage equilibrium was tested using these allelic profiles and software available at http://www.mlst.net/indexassoc/indexassoc.htm.
All phylogenetic trees used in the congruence analysis were reconstructed by the ML method using the ModelTest application (Posada and Crandall, 1998) to select the optimised model for each gene. This is the only addition to the previously published procedure (Holmes et al., 1999; Feil et al., 2001). Briefly, this method generates 200 random trees from a given gene tree and the difference in log likelihood values between the real tree and each random tree is recorded. The difference in log likelihood values of all other independent genes can then be compared to this ‘null’ distribution. All genes with scores that fall outside the 99th percentile of the random tree distribution are considered congruent, while those that fall within the distribution of the random trees are considered non-congruent. Models, data and trees are available from the authors on request.
3. Results
To examine DNA sequence level diversity in the LPS of NTHi OM isolates, we sequenced internal fragments (273–474 bp) of the coding regions of each of seven LPS biosynthetic genes: opsX, rfaF, orfH, lgtF, lic2A, lgtC, and lic1D. These genes were selected because each had been shown to be present in all 25 isolates (data not shown) and because they included representative genes for the synthesis of both inner core (opsX, rfaF, orfH and lgtF) and outer core (lic2A, lgtC and lic1D) LPS structures (Fig. 1).
We analysed the sequence data to determine whether or not there was greater allelic diversity between genes responsible for production of inner core, whose structure is relatively conserved across all Hi strains, as compared to outer core LPS structures, for which previous studies have shown substantial structural variation between different strains. Within the sub-set of 25 OM isolates, the variability in the sequence of the seven different LPS biosynthetic genes was assessed by several methods of analysis (Table 1). The extent of allelic diversity among the different genes varied but did not correlate with whether the role of the gene was in synthesising inner or outer core structures. For example, the greatest S/L values were seen for rfaF (inner core) and lic1D (outer core), while the lowest value was for lic2A (outer core).
The dN/dS ratios were calculated as an indication of diversifying selection resulting from the host immune mechanisms. For all genes, non-synonymous (dN) substitutions were less frequent than synonymous substitutions (dS). Further, there were differences in the ratios of predicted amino acid substitutions, suggesting that NTHi LPS genes are evolving under different intensities of stabilising selection, irrespective of whether the genes direct the synthesis of the inner or outer core LPS. Taken together, these data provided no evidence to support a role for selection in the observed allelic diversity, although some effects cannot be excluded.
In the absence of evidence for diversifying selection through immune selection, we investigated the possible role of recombination. Three lines of evidence for recombination within natural populations of bacteria include the presence of mosaic sequences, lack of linkage disequilibrium, and lack of gene tree congruence (Feil and Spratt, 2001). We used methods suitable for each of these to detect evidence for past recombination events in this set of NTHi isolates.
3.1. Distribution of polymorphisms within gene alignments
To detect mosaic sequences we constructed gene alignments to identify evidence of recombination. A compelling example of mosaicism was observed in rfaF (Fig. 3); strain 486 shared the same sequence as that of 13 others (designated clade A) for the first 266 bases of the sequenced fragment, but from the 267th base the sequence of 486 shared the same polymorphic sites as the remaining 11 isolates (clade B). The sequence of 486 is therefore a mosaic of two ancestral sequences, one from clade A and the other from clade B. Application of the maximum Chi-squared test demonstrated significant P-values for rfaF and lic1D (Table 2). Evidence of recombination, where original breakpoints may have been obscured by the accumulation of more recent recombination events, was also detected in the alignments of the three genes lgtC, opsX and lgtF by the Sawyer's Test (P = 0.0162, P = 0.0168 and P = 0.0009, respectively).
Fig. 3.

Polymorphic sites in a fragment of the LPS biosynthesis gene of rfaF of NTHi; the consensus sequence is shown for the uppermost allele and in subsequent alleles only sites which differ from this are identified. The polymorphic sites are numbered above the sequences in vertical format and the isolate numbers indicated on the left-hand side. The mosaic sequence is highlighted in bold type. Group A comprises 13 isolates that share the same sequence as isolate 486 for the first 266 bases. Group B comprises 11 isolates that share the same sequence as isolate 486 from base 267–426.
Table 2.
The significance values of the mosaics apparent from alignments of LPS and HK sequences
| Locus | Parent 1 | Parent 2 | Recombinant | P-value |
|---|---|---|---|---|
| LPS | ||||
| rfaF | 723 | 1200 | 486 | <0.0001 |
| lic1D | 1268 | 1124 | 285/486 | <0.0001 |
| HK | ||||
| frdB | 486 | 981 | 1207 | <0.007 |
These values were calculated using the maximum Chi-squared test (Maynard Smith, 1992). The tests were based on the presence of two parental and one derived sequence and was implemented using the START package available from http://www.mlst.net (Jolley et al., 2001).
3.2. Linkage disequilibrium
Genetic exchange brings alleles into linkage equilibrium whereas the detection of non-random association between alleles at different loci indicates a clonal population structure. The existence of linkage disequilibrium between genes in natural populations at different loci has previously been used as evidence that there are relatively low rates of successful recombination in encapsulated Hi (Feil and Spratt, 2001). We tested for linkage disequilibrium by scoring the unique alleles found in our set of 16 non-redundant isolates (Fig. 2) and calculated the Index of Association. One thousand randomised populations in linkage equilibrium were generated and compared against the real population variance (http://www.mlst.net/indexassoc/indexassoc.htm; Maynard Smith et al., 1993). No evidence of linkage disequilibrium was detected between the 7 LPS biosynthetic loci of these 16 isolates, indicating a non-clonal population structure with respect to these genes.
3.3. Statistical analysis of congruence
To investigate congruence between gene trees and to examine the evolutionary history of the LPS biosynthetic genes, we built phylogenetic trees using parsimony, NJ and ML methods. Strong phylogenetic signals were detected in all seven genes and all three methods yielded similar topology for each gene tree (trees not shown). However, trees constructed from different genes were not congruent. Comparison of each LPS gene tree and the ribotype dendrogram revealed that only phylogenetic relationships between the most closely related isolates were repeatedly reconstructed; deeper lineages of all these reconstructed phylogenies lacked congruence. In all four cases, where samples were obtained from the same patient on the same day, the isolates were shown to be genetically identical. Isolates 1292 and 1180/1181, taken from the same patient 4 weeks apart, were found to be identical. In one instance, genetic identity was also observed between isolates 1207/1209 (same patient, same day) and 1233 (unrelated sample). In two of the three remaining ribotype lineages where more than one isolate was studied, genetic similarity was observed but in the third instance, isolates 176 and 477, the lineages were genetically distinct.
To quantify the levels of congruence between gene trees, we applied a recently published method of analysis (Holmes et al., 1999; Feil et al., 2001). This test compared the difference in log likelihood score between two gene trees to the difference obtained between one of the gene trees and 200 trees of random topology. Each pairwise comparison was then scored as either “congruent”, if the difference in log likelihood fell outside the value of the 99th percentile of the random distribution, or “non-congruent” if the tree for one gene was no more similar to the tree for another gene than the 99th percentile ML value of 200 random trees. The test was applied to the 16 ‘non-redundant isolates’ in our set of 25 isolates (Fig. 2) and the results confirmed a lack of congruence between gene trees (Tables 3A and 4A). The single congruence detected was between lgtC and rfaF. Although the log likelihood score of this comparison was outside the 99th percentile, it was still within the distribution of likelihood scores of the 200 random trees i.e. the tree for lgtC was no more similar to that of rfaF than that of several of the random trees.
Table 3.
(A and B). Gene trees that show congruence with LPS (A) and HK (B) genes as detected by maximum likelihood analysis
| Gene | –ln L of ML tree | Difference in –ln L of 200 random trees |
99th percentile difference –ln L in random trees |
Loci outside 99th percentile of random trees |
|---|---|---|---|---|
| (A) LPS | ||||
| lgtC | 1040.3252 | 1164.782–1280.110 | 133.985 | – |
| lgtF | 1205.9899 | 1342.066–1530.054 | 165.237 | recA |
| lic1D | 721.80891 | 930.051–1159.706 | 228.545 | – |
| lic2A | 628.33857 | 680.501–729.394 | 63.015 | – |
| opsX | 1110.7999 | 1157.505–1222.735 | 60.007 | – |
| orfH | 937.505 | 1052.719–1179.271 | 131.605 | – |
| rfaF | 1085.994 | 1097.034–1644.086 | 238.262 | lgtC |
| (B) HK | ||||
| adk | 826.45541 | 843.9–873.200 | 19.237 | recA |
| atpG | 789.42661 | 850.229–890.475 | 66.041 | adk, recA |
| frdB | 914.477 | 991.745–1055.983 | 84.8 | lic1D, rfaF |
| fucK | 608.51935 | 649.869–710.558 | 63.11 | – |
| mdh | 941.7424 | 1011.817–1103.795 | 80.676 | – |
| nrfC | 601.00862 | 622.325–654.129 | 23.994 | lgtF |
| pgi | 1147.1943 | 1235.6–1326.292 | 110.348 | – |
| recA | 746.86076 | 795.898–850.431 | 51.735 | adk, fucK |
Shown for each of the 15 genes is the range of the distribution of the difference in –ln L value of 200 random ML trees generated for each gene. Gene trees of other loci showing significant congruence are listed as being outside the 99th percentile.
Table 4.
(A–D): raw data (–ln L scores) used to detect congruence between LPS genes (A), HK genes (D) and between HK and LPS genes (B and C)
| Genes | A |
B |
||||||||||||||
|---|---|---|---|---|---|---|---|---|---|---|---|---|---|---|---|---|
| 99th percentile | lgtC | lgtF | lic1D | lic2A | opsX | orfH | rfaF | adk | atpG | frdB | fucK | mdh | nrfC | pgi | recA | |
| lgtC | 1174.31 | 1040.296 | 1256.608 | 1215.106 | 1272.72 | 1265.016 | 1203.525 | 1240.123 | 1247.63 | 1264.49 | 1255.39 | 1276.2 | 1267.209 | 1227.759 | 1267.011 | 1254.39 |
| lgtF | 1371.227 | 1455.056 | 1205.904 | 1432.648 | 1410.365 | 1458.329 | 1446.472 | 1464.792 | 1419.29 | 1442.15 | 1460.4 | 1476.44 | 1389.782 | 1411.043 | 1507.035 | 1365.61 |
| lic1D | 950.354 | 1010.145 | 1097.026 | 721.809 | 1166.46 | 1131.343 | 956.074 | 1168.531 | 1116.39 | 1107.86 | 1078.65 | 1166.41 | 991.47 | 1013.917 | 1135.37 | 1127.48 |
| lic2A | 691.354 | 721.935 | 695.999 | 719.19 | 628.339 | 724.617 | 747.436 | 724.297 | 727.839 | 722.327 | 714.335 | 728.122 | 712.175 | 728.164 | 711.53 | 721.09 |
| opsX | 1170.807 | 1205.096 | 1195.637 | 1222.643 | 1223.427 | 1110.779 | 1206.383 | 1216.664 | 1204.83 | 1214.09 | 1212.26 | 1200.65 | 1207.361 | 1220.648 | 1215.833 | 1210.99 |
| orfH | 1069.11 | 1082.647 | 1117.735 | 1078.394 | 1170.96 | 1100.572 | 937.505 | 1140.778 | 1151.21 | 1149.41 | 1176.28 | 1130.41 | 1121.082 | 1095.766 | 1137.09 | 1128.51 |
| rfaF | 1324.256 | 1301.702 | 1497.781 | 1490.038 | 1508.285 | 1473.83 | 1508.638 | 1085.994 | 1494.32 | 1508.17 | 1324.9 | 1397.19 | 1508.258 | 1390.806 | 1559.247 | 1338.5 |
| Genes | C |
D |
||||||||||||||
| 99th percentile | lgtC | lgtF | lic1D | lic2A | opsX | orfH | rfaF | adk | atpG | frdB | fucK | mdh | nrfC | pgi | recA | |
| adk | 845.693 | 859.978 | 857.501 | 865.96 | 866.328 | 864.421 | 872.654 | 849.855 | 826.455 | 846.413 | 857.302 | 855.583 | 866.231 | 848.557 | 866.328 | 839.487 |
| atpG | 855.468 | 867.215 | 858.72 | 875.94 | 879.66 | 879.367 | 864.98 | 858.832 | 842.371 | 789.427 | 855.872 | 878.18 | 876.593 | 875.132 | 874.922 | 838.865 |
| frdB | 999.277 | 1040.484 | 1051.545 | 997.957 | 1044.914 | 1044.914 | 1044.914 | 987.983 | 1025.53 | 1037.55 | 914.477 | 1012.23 | 1042.412 | 1027.861 | 1006.132 | 1023.32 |
| fucK | 671.629 | 704.608 | 699.362 | 701.409 | 700.442 | 692.159 | 701.919 | 676.879 | 693.287 | 701.738 | 677.79 | 608.519 | 702.775 | 696.255 | 698.142 | 691.265 |
| mdh | 1022.419 | 1070.301 | 1063.812 | 1044.332 | 1068.579 | 1062.483 | 1063.941 | 1100.856 | 1093.1 | 1074.21 | 1089.64 | 1097.03 | 941.742 | 1043.386 | 1059.997 | 1080.28 |
| nrfC | 625.002 | 634.99 | 622.331 | 634.36 | 640.033 | 643.766 | 627.935 | 629.041 | 630.86 | 633.226 | 646.317 | 629.799 | 634.14 | 601.009 | 640.033 | 630.55 |
| pgi | 1257.542 | 1317.508 | 1313.219 | 1274.952 | 1326.292 | 1317.7 | 1319.929 | 1325.737 | 1312.38 | 1307.88 | 1268.33 | 1317.51 | 1322.769 | 1317.509 | 1147.194 | 1316.92 |
| recA | 798.595 | 815.327 | 817.199 | 823.072 | 824.363 | 827.048 | 819.788 | 801.518 | 791.26 | 802.526 | 809.986 | 781.904 | 817.822 | 805.382 | 820.749 | 746.861 |
The vertical list of genes had their gene trees randomised and the 99th percentile cutoff within this distribution of 200 random trees scores (Table 3) is reported. The –ln L scores of all other gene trees in this study were compared against this cutoff (the lower the score, the better the tree). Scores below the 99th percentile of random trees are highlighted in bold and demonstrate congruence with the ML tree against which they are compared. lgtc, lgtF, lic2A, opsX, orfH and rfaF are LPS biosynthetic genes; adk, atpG, frdB, fucK, mdh, nrfC, pgi and recA are housekeeping genes.
Given the evidence for recombination in the DNA sequences of seven LPS biosynthetic genes, we did a similar analysis of HK (neutral) genes. The rationale was that neutral genes are under stabilising selection and therefore would be helpful in indicating the rate at which neutral genetic variation accumulates (Feil and Spratt, 2001).
3.4. Analysis of 8 genes with house-keeping functions
The amount of variation between HK genes of different function was variable; mdh and pgi showed the greatest allelic variation and nrfC the least (Table 1B). The dN/dS ratios observed showed no evidence for positive selection, although the degree of functional constraint showed a 10-fold variation between the genes.
Two mosaic sequences (adk and frdB loci) were observed and application of the maximum Chi-squared test demonstrated significant P-values for both (Table 2B). This was confirmed in frdB by the Sawyer's test (P = 0.0009) in which there was significant evidence for recombination at pgi (P = 0.0023). No evidence of linkage disequilibrium was found between the neutral loci.
The analysis of HK gene tree congruence using ML is summarised in Tables 3B and 4D. Five pairwise congruences were detected within this set of eight HK genes. Two of these comparisons, those involving the genes adk and recA, were reciprocal.
3.5. Comparison of genetic variation and recombination in LPS genes and HK genes
The results obtained from the above analyses for LPS and HK genes were compared. A trend for increased genetic variation was observed in LPS genes of isolates of the same ribotype lineage, as compared to their HK loci (Fig. 2). There was no significant difference in the total number of alleles or dN/dS ratios between the two groups of genes but, S/L and π were significantly different at the P = 0.05 level (Mann–Witney test; 2-tailed).
The 7 LPS and 8 HK genes assayed in this study demonstrated comparable rates of recombination. No difference was detected between the number of significant pairwise congruences for LPS (1/42) and HK genes (5/56; t-test P = 0.147). Comparisons of HK to LPS gene ML tree congruence (Table 4B and C) revealed 4 instances of congruence, none of which was reciprocal. As with lgtC and rfaF, three of these had ML values within the distribution of the random trees for the gene and the fourth (rfaF and frdB) was only marginally outside of this range.
4. Discussion
We have characterised a collection of NTHi isolates, obtained by tympanocentesis from children with OM, by sequencing internal fragments of seven LPS and eight HK genes. Our main finding is that these OM NTHi isolates, selected to represent the genetic diversity in the natural population of Hi, show evidence of high rates of recombination in both LPS and HK genes. These isolates were characterised by ribotyping and then integrated into a previously constructed phylogenetic tree. This tree included both encapsulated and capsule-deficient strains obtained from individuals with asymptomatic carriage or disease (Fig. 2). The allelic profiles of these 15 genes (data not shown) were used to build a UPGMA tree. This confirmed that the ribotyping tree was consistent with results obtained by multi-locus sequence typing. Isolates from the same ribotype lineage share most or all of their LPS and HK alleles, while isolates from different ribotyping lineages are highly divergent. We found that the UPGMA tree reconstructed only the ‘tips’ of the ribotype dendrogram, but not deeper branches, indicating that recombination has to a great extent obscured the phylogenetic relationships between distantly related isolates.
The present studies provide direct evidence for high rates of recombination. Capsule and LPS are major virulence factors and both involve a large number of biosynthetic genes to synthesise, transport and assemble these macromolecules on the bacterial cell surface. In the case of the capsular polysaccharides, the key genes are clustered in a single locus (cap), whereas for LPS, the relevant biosynthetic genes are scattered over many regions of the chromosome. The population structure of encapsulated strains is clonal, indicating that recombination is constrained. The linkage disequilibrium and non-random associations between HK and capsule genes is in marked contrast to our findings in the present set of NTHi isolates where inter-strain recombination is not constrained. We found mosaic sequences, non-congruence of gene trees and linkage equilibrium, findings that strengthen the currently available data on the population structure of NTHi. Previous studies (Musser et al., 1986; Porras et al., 1986) have noted greater diversity of NTHi as compared to encapsulated strains, but previous work has not specifically addressed the extent of recombination. Indeed, Porras et al. concluded that the NTHi isolates that they studied retained a distinctly clonal population structure (Porras et al., 1986).
Genes involved in the biosynthesis of O-antigen repeat units of LPS, for example in Salmonella and Escherichia coli, evolve at a higher rate compared to the HK genes of a particular genome (Reeves, 1993; Stevenson et al., 1994). We hypothesised that since sugars of the inner core of LPS are relatively highly conserved, the diversity of these genes would be similar to that of HK genes. This conclusion appears to be confirmed by the results of our study. However, in contrast to the inner core, we hypothesised that the genes required for synthesis of outer core structures of the LPS molecule would show more variability, a reflection of diversifying selection by host immune responses. We did observe some increase in the extent of genetic variation for LPS as compared to HK genes, but when lic1D (a gene involved in the addition of phosphocholine) was omitted from the analysis, this removed the significance of the difference between LPS and HK genes. Sequences from additional loci are required to test further whether there might be differences in the evolutionary histories between genes encoding the enzymes responsible for the assembly of LPS inner and outer core structures.
The extent of recombination occurring in NTHi has implications for understanding inter-strain differences in virulence. Variations in the molecular environment of LPS structures, such as phosphocholine or sialic acid, have been shown to affect virulence in vitro and in animal models (Lysenko et al., 2000; Hood et al., 1999; Tong et al., 2001). Thus, exchange of alleles through recombination is presumably relevant to the evolution of differences in pathogenic behaviour of NTHi strains, such as the remarkable emergence of highly virulent clones responsible for Brazilian Purpuric Fever (Brazilian Purpuric Fever Study Group, 1987).
The NTHi isolates used in this study are concurrently being used as a representative sub-set of strains relevant to developing a vaccine against diseases caused by NTHi, especially OM. It is clearly helpful to have an appreciation of the extent of recombination occurring within natural populations of Hi because of its potential to introduce variation into LPS epitopes that are candidates for inclusion in LPS-based vaccines.
Acknowledgements
A.J.C. is funded by a research agreement with Aventis-Pasteur. D.F. was supported for part of this study as a Sloan/NSF Postdoctoral Fellowship in Molecular Evolution at the University of Oxford. M.E.D., D.W.H. and E.R.M. are funded by a Programme Grant from the Medical Research Council. R.G. and V.B. are funded by a research grant award to R.G. from the N.I.H. N.I.D.C.D. The authors wish to thank Juhani Eskola and the Finnish Otitis Media Study Group for the provision of strains used in this study.
Footnotes
Nucleotide sequence data reported in this paper are available in the GenBank™ database under the accession numbers AF535871–AF536173 (sequences reported by Feil et al., 2001 and included in analyses reported in this paper are available in the GenBank™ database under accession numbers AF322666–AF322669, AF322679–AF322682, AF322703, AF322719–AF322725, AF322740, AF322751, AF322757–AF322762, AF322777, AF322787, AF322791–AF322796, AF322814, AF322824, AF322827–AF322832).
References
- Bolduc GR, Bouchet V, Jiang R, Geisselsoder J, Truong-Bolduc Q, Rice PA, Pelton SI, Goldstein R. Variability of OMP P1 and its evaluation as a vaccine candidate against experimental otitis media due to non-typeable Haemophilus influenzae: an unambiguous, multifaceted approach. Infect. Immun. 2000;68:4505–4517. doi: 10.1128/iai.68.8.4505-4517.2000. [DOI] [PMC free article] [PubMed] [Google Scholar]
- Campagnari AA, Gupta MR, Dudas KC, Murphy TF, Apicella MA. Antigenic diversity of lipooligosaccharides of non-typable Haemophilus influenzae. Infect. Immun. 1987;55:882–887. doi: 10.1128/iai.55.4.882-887.1987. [DOI] [PMC free article] [PubMed] [Google Scholar]
- Drouin G, Prat F, Ell M, Clarke GD. Detecting and characterizing gene conversions between multigene family members. Mol. Biol. Evol. 1999;16:1369–1390. doi: 10.1093/oxfordjournals.molbev.a026047. [DOI] [PubMed] [Google Scholar]
- Enright MC, Spratt BG. Multilocus sequence typing. Trends Microbiol. 1999;7:482–487. doi: 10.1016/s0966-842x(99)01609-1. [DOI] [PubMed] [Google Scholar]
- Feil EJ, Holmes EC, Bessen DE, Chan MS, Day NP, Enright MC, Goldstein R, Hood DW, Kalia A, Moore CE, Zhou J, Spratt BG. Recombination within natural populations of pathogenic bacteria: short-term empirical estimates and long-term phylogenetic consequences. Proc. Natl. Acad. Sci. U.S.A. 2001;98:182–187. doi: 10.1073/pnas.98.1.182. [DOI] [PMC free article] [PubMed] [Google Scholar]
- Feil EJ, Spratt BG. Recombination and the population structures of bacterial pathogens. Ann. Rev. Microbiol. 2001;55:561–590. doi: 10.1146/annurev.micro.55.1.561. [DOI] [PubMed] [Google Scholar]
- Fleischmann RD, Adams MD, White O, Clayton RA, Kirkness EF, Kerlavage AR, et al. Whole-genome random sequencing and assembly of Haemophilus influenzae Rd. Science. 1995;269:496–512. doi: 10.1126/science.7542800. [DOI] [PubMed] [Google Scholar]
- Goldstein R, Sun L, Jiang RZ, Forstner J, Campanelli C. Structurally variant classes of pilus appendage fibers coexpressed from Burkholderia (Pseudomonas) cepacia. J. Bacteriol. 1995;177:1039–1052. doi: 10.1128/jb.177.4.1039-1052.1995. [DOI] [PMC free article] [PubMed] [Google Scholar]
- Holmes EC, Urwin R, Maiden MCJ. The influence of recombination on the population structure and evolution of the human pathogen Neisseria meningitidis. Mol. Biol. Evol. 1999;16:741–749. doi: 10.1093/oxfordjournals.molbev.a026159. [DOI] [PubMed] [Google Scholar]
- Hood DW, Moxon ER. Lipopolysaccharide phase-variation in Haemophilus and Neisseria. In: Brade H, Opal SM, Vogel SN, Morrison. DC, editors. Endotoxin in Health and Disease. Marcel Dekker; New York: 1999. pp. 39–54. [Google Scholar]
- Hood DW, Makepeace K, Deadman ME, Rest RF, Thibault P, Martin A, Richards JC, Moxon ER. Sialic acid in the lipopolysaccharide of Haemophilus influenzae: strain distribution, influence on serum resistance and structural characterization. Mol. Microbiol. 1999;33:679–692. doi: 10.1046/j.1365-2958.1999.01509.x. [DOI] [PubMed] [Google Scholar]
- Hood DW, Moxon ER. Gene variation and gene regulation in bacterial pathogenesis. In: Hodgson DA, Thomas CM, editors. Signals, Regulons and Cascades: Control of Bacterial Gene Expression. Society for General Microbiology Symposium. Vol. 61. Cambridge University Press; Cambridge: 2002. pp. 19–40. [Google Scholar]
- Jolley KA, Feil EJ, Chan MS, Maiden MC. Sequence type analysis and recombinational tests START. Bioinformatics. 2001;17:1230–1231. doi: 10.1093/bioinformatics/17.12.1230. [DOI] [PubMed] [Google Scholar]
- Kumar S, Tamura K, Jakobsen IB, Nei M. MEGA2: molecular evolutionary genetics analysis software. Bioinformatics. 2001;17:1244–1245. doi: 10.1093/bioinformatics/17.12.1244. [DOI] [PubMed] [Google Scholar]
- Langford PR, Moxon ER. The dilution rate affects the outer membrane protein and lipopolysaccharide composition of Haemophilus influenzae type b grown under iron limitation. J. Bacteriol. 1993;175:2462–2464. doi: 10.1128/jb.175.8.2462-2464.1993. [DOI] [PMC free article] [PubMed] [Google Scholar]
- Lysenko E, Richards JC, Cox AD, Stewart A, Martin A, Kapoor M, Weiser JN. The position of phosphorylcholine on the lipopolysaccharide of Haemophilus influenzae affects binding and sensitivity to C-reactive protein-mediated killing. Mol. Microbiol. 2000;35:234–245. doi: 10.1046/j.1365-2958.2000.01707.x. [DOI] [PubMed] [Google Scholar]
- Maiden MC, Bygraves JA, Feil E, Morelli G, Russell JE, Urwin R, Zhang Q, Zhou J, Zurth K, Caugant DA, Feavers IM, Achtman M, Spratt BG. Multilocus sequence typing: a portable approach to the identification of clones within populations of pathogenic microorganisms. Proc. Natl. Acad. Sci. U.S.A. 1998;95:3140–3145. doi: 10.1073/pnas.95.6.3140. [DOI] [PMC free article] [PubMed] [Google Scholar]
- Masoud H, Moxon ER, Martin A, Krajcarski D, Richards JC. Structure of the variable and conserved lipopolysaccharide oligosaccharide epitopes expressed by Haemophilus influenzae serotype b strain Eagan. Biochemistry. 1997;36:2091–2103. doi: 10.1021/bi961989y. [DOI] [PubMed] [Google Scholar]
- Maynard Smith J. Analyzing the mosaic structure of genes. J. Mol. Evol. 1992;34:126–129. doi: 10.1007/BF00182389. [DOI] [PubMed] [Google Scholar]
- Maynard Smith J, Smith NH, O'Rourke M, Spratt BG. How clonal are bacteria? Proc. Natl. Acad. Sci. U.S.A. 1993;90:4384–4388. doi: 10.1073/pnas.90.10.4384. [DOI] [PMC free article] [PubMed] [Google Scholar]
- Maynard Smith J, Smith NH. Detecting recombination from gene trees. Mol. Biol. Evol. 1998;15:590–599. doi: 10.1093/oxfordjournals.molbev.a025960. [DOI] [PubMed] [Google Scholar]
- Moor PE, Collignon PC, Gilbert GL. Pulsed-Field gel electrophoresis used to investigate genetic diversity of Haemophilus influenzae type b isolates in Australia shows differences between aboriginal and non-aboriginal isolates. J. Clin. Microbiol. 1999;37:1524–1531. doi: 10.1128/jcm.37.5.1524-1531.1999. [DOI] [PMC free article] [PubMed] [Google Scholar]
- Moxon ER, Hood D, Richards JC. Bacterial lipopolysaccharides: candidate vaccines to prevent Neisseria meningitidis and Haemophilus influenzae infections. In: Axford JS, editor. Advances in Experimental Medicine and Biology. Glycoimmunology 2. Vol. 435. Plenum Press; New York: 1998. pp. 237–243. [DOI] [PubMed] [Google Scholar]
- Musser JM, Barenkamp SJ, Granoff DM, Selander RK. Genetic relationships of serologically non-typable and serotype b strains of Haemophilus influenzae. Infect. Immun. 1986;52:183–191. doi: 10.1128/iai.52.1.183-191.1986. [DOI] [PMC free article] [PubMed] [Google Scholar]
- Musser JM, Kroll JS, Moxon ER, Selander RK. Clonal population structure of encapsulated Haemophilus influenzae. Infect Immun. 1988;56:1837–1845. doi: 10.1128/iai.56.8.1837-1845.1988. [DOI] [PMC free article] [PubMed] [Google Scholar]
- Musser JM, Kroll JS, Granoff DM, Moxon ER, Brodeur BR, Campos J, et al. Global genetic structure and molecular epidemiology of encapsulated Haemophilus influenzae. Rev. Infect. Dis. 1990;12:75–111. doi: 10.1093/clinids/12.1.75. [DOI] [PubMed] [Google Scholar]
- Nei M. Molecular Evolutionary Genetics. Columbia University Press; New York: 1987. Phylogenetic trees; pp. 287–326. [Google Scholar]
- Nei M, Li WH. Mathematical model for studying genetic variation in terms of restriction endonucleases. Proc. Natl. Acad. Sci. U.S.A. 1979;76:5269–5273. doi: 10.1073/pnas.76.10.5269. [DOI] [PMC free article] [PubMed] [Google Scholar]
- Brazilian Purpuric Fever Study Group Brazilian purpuric fever. Lancet. 1987;ii:757–761. [PubMed] [Google Scholar]
- Patrick CC, Kimura A, Jackson MA, Hermanstorfer L, Hood A, McCracken GH, Jr., Hansen EJ. Antigenic characterization of the oligosaccharide portion of the lipooligosaccharide of non-typable Haemophilus influenzae. Infect. Immun. 1987;55:2902–2911. doi: 10.1128/iai.55.12.2902-2911.1987. [DOI] [PMC free article] [PubMed] [Google Scholar]
- Phillips NJ, Apicella MA, Griffiss JM, Gibson BW. Structural studies of the lipooligosaccharides from Haemophilus influenzae type b strain A2. Biochemistry. 1993;32:2003–2012. doi: 10.1021/bi00059a017. [DOI] [PubMed] [Google Scholar]
- Posada D, Crandall KA. ModelTest: testing the model of DNA substitution. Bioinformatics. 1998;14:817–818. doi: 10.1093/bioinformatics/14.9.817. [DOI] [PubMed] [Google Scholar]
- Porras O, Caugant DA, Gray B, Lagergard T, Levin BR, Svanborg-Eden C. Difference in structure between type b and non-typable Haemophilus influenzae populations. Infect. Immun. 1986;53:79–89. doi: 10.1128/iai.53.1.79-89.1986. [DOI] [PMC free article] [PubMed] [Google Scholar]
- Reeves P. Evolution of Salmonella O antigen variation by interspecific gene transfer on a large scale. Trends Genet. 1993;9:17–22. doi: 10.1016/0168-9525(93)90067-R. [DOI] [PubMed] [Google Scholar]
- Risberg A, Masoud H, Martin A, Richards JC, Moxon ER, Schweda EKH. Structural analysis of the lipopolysaccharide oligosaccharide epitopes expressed by a capsule-deficient strain of Haemophilus influenzae Rd. Eur. J. Biochem. 1999;261:171–180. doi: 10.1046/j.1432-1327.1999.00248.x. [DOI] [PubMed] [Google Scholar]
- Sawyer S. Statistical tests for detecting gene conversion. Mol. Biol. Evol. 1989;6:526–538. doi: 10.1093/oxfordjournals.molbev.a040567. [DOI] [PubMed] [Google Scholar]
- Smith-Vaughan HC, Sriprakash JD, Mathews JD, Kemp DJ. Non-encapsulated Haemophilus influenzae in aboriginal infants with otitis media: prolonged carriage of P2 porin variants and evidence for horizontal P2 gene transfer. Infect. Immun. 1997;64:1468–1474. doi: 10.1128/iai.65.4.1468-1474.1997. [DOI] [PMC free article] [PubMed] [Google Scholar]
- Smith-Vaughan HC, Sriprakash KS, Leach AJ, Mathews JD, Kemp DJ. Low genetic diversity of Haemophilus influenzae type b compared to non-encapsulated H. influenzae in a population in which H. influenzae is highly endemic. Infect. Immun. 1998;66:3403–3409. doi: 10.1128/iai.66.7.3403-3409.1998. [DOI] [PMC free article] [PubMed] [Google Scholar]
- Stevenson G, Neal B, Liu D, Hobbs M, Packer NH, Batley M, Redmond JW, Lindquist L, Reeves P. Structure of the O antigen of Escherichia coli K-12 and the sequence of its rfb gene cluster. J. Bacteriol. 1994;176:4144–4156. doi: 10.1128/jb.176.13.4144-4156.1994. [DOI] [PMC free article] [PubMed] [Google Scholar]
- Swofford DL. Phylogenetic Analysis Using Parsimony (* and Other Methods). Version 4. Sinauer Associates; Sunderland, MA: 1999. [Google Scholar]
- Swofford DL, Olsen GJ, Waddell PJ, Hillis DM. Phylogenetic inference. In: Hillis DM, Moritz C, Mable BK, editors. Molecular Systematics. Sinauer Associates; Sunderland, MA: 1996. pp. 407–514. Chapter 11. [Google Scholar]
- Thompson JD, Gibson TJ, Plewniak F, Jeanmougin F, Higgins DG. The ClustalX windows interface: flexible strategies for multiple sequence alignment aided by quality analysis tools. Nucl. Acids Res. 1997;25:4876–4882. doi: 10.1093/nar/25.24.4876. [DOI] [PMC free article] [PubMed] [Google Scholar]
- Tong HH, Blue LE, James MA, Chen YP, Demaria TF. Evaluation of phase variation of non-typeable Haemophilus influenzae lipooligosaccharide during nasopharangeal colonization and development of otitis media in the chinchilla model. Infect. Immun. 2001;68:4593–4597. doi: 10.1128/iai.68.8.4593-4597.2000. [DOI] [PMC free article] [PubMed] [Google Scholar]
- Zamze SE, Moxon ER. Composition of the lipopolysaccharide from different capsular serotype strains of Haemophilus influenzae. J. Gen. Microbiol. 1987;133:1443–1451. doi: 10.1099/00221287-133-6-1443. [DOI] [PubMed] [Google Scholar]