

Abstract
We have modeled tumor-induced angiogenesis; our model includes the phenomena of the migratory response of endothelial cells (ECs) to tumor angiogenic factors, and the interaction of ECs with the extracellular matrix (ECM). ECs switch between growth, differentiation, motility, or apoptotic behavior in response to the local topology and composition of the ECM. Assuming the ECM medium as a statistically inhomogeneous medium (some area support sprout growth, some not), we show that the ECM can be a natural barrier to angiogenesis. We study vascular network formation for several ECM distributions and topologies, and we find an analogy with percolation. A threshold exists, under which sprouts cannot reach the tumor. During the growth of the vascular network, a competition exists between the attraction exerted by tumor and the preferred path created by the ECM. We also examined the influence of branching on the tumor vascularization. Branching is a natural phenomenon which helps the tumor become vascularized. By increasing the number of sprouts, the vascular network increases the probability of reaching the tumor, as it can explore more pathways. Our simulations show after two branching events, the vascular network is very likely to reach the tumor.
Keywords: Angiogenesis, Chemotaxis, Apoptosis, Extracellular matrix, percolation, endothelial cell
1-INTRODUCTION
The migration of vascular endothelial cells (ECs) plays an important role in tumor-induced angiogenesis (Folkman, 1976). ECs are precursors for new capillariy formation (Bischoff, 1997; Carmeliet and Jain, 2000) and form the lining of all blood vessels. The migration of ECs allows movement and growth at the sprouting tip of new capillaries (Sholley et al., 1984; Stokes et al., 1991) and in this process, interactions between cell and extracellular matrix (ECM), and particularly cell adhesion, are essential. The major hypothesis in my paper is: locally ECM gives not the same response for capillary growth.
ECM is a highly heterogeneous network composed of polysaccharide chains, fibrous proteins (collagen and elastin), fibronectin, and laminin. Inside and around the tumor, the collagen shows many degrees of organization, which affects the distribution of different matrix molecules (Berk et al., 1997; Pluen et al., 2001), (Nehls and Herrmann, 1996). This heterogeneity can affect many biological events. One can be cell migration, controlled via integrin distribution. Palecek has demonstrated that there is a direct relationship between maximum cell migration speed, receptor and ligand concentrations, and the affinity of the receptor for its ligand (Palecek et al., 1997). If the ECM ligands are at high concentrations, there must also be either low integrin expression level or low integrin-ligand affinities to achieve maximum speed, and vice versa. So, migration occurs at an intermediate level of cell adhesiveness which depends of the integrin distribution, i.e. the ECM organization.
Another issue to consider is the effect of the ECM topology on cell shape (Berthiaume et al., 1996; Chen et al., 1997). The productive contact between the substrate and the cell is directly correlated to the ECM composition. If the cell protusion makes a productive contact with the substrate, the cell can move forward. If attachment does not occur, the protusions are retracted away for the leading edge. At the cellular level, orientation of the fiber will also influence the shape and the direction of the cell migration. Moreover, the literature gives us many clues regarding the influence of the ECM topology on the cell behavior (Pizzo et al., 2005) and local disruption of the ECM can lead to cell apoptosis (Sympson et al., 1994). Ingber’s studies clearly shown that, regardless the type of matrix protein or integrin used to mediate adhesion, local geometry (distribution of the ECM proteins) will govern cell growth (Chen et al., 1997). The ECM mesh gives support to cells, and allows them to proliferate and self-organize into a vascular network (Kanda et al., 2004; Reinhart-King et al., 2005). Local disruption of ECM induces cell apoptosis in adjacent cells and regulates vascular morphogenesis (Nehls and Herrmann, 1996).
Chemotactic and haptotactic forces and their effects on the EC are generally used to model tumor-induced angiogenesis. Previous mathematical models based on random walk theory simulated tumor-induced angiogenesis, to study the shape and growth rate of such vascular networks (Anderson and Chaplain, 1998; Chaplain, 2000; Levine et al., 2001; Shim et al., 2005; Sun et al., 2005; Tong and Yuan, 2001). In this cases, cell migration is regulated by two major forces: chemotactic forces (Terranova et al., 1985) that lead the cell to the tumor depending on the concentration gradient of several growth factors, and haptotactic forces (Carter, 1967; Herbst et al., 1988) due to local adhesion between the cell and the extracellular matrix (ECM) via integrins (Luscinskas and Lawler, 1994). The migration of ECs in response to a gradient of growth factors (e.g., FGF, EGF, and VEGF), or more generally cell migration under a chemotactic gradient, has been extensively studied and equations defining cell locomotion have been produced (Chaplain and Stuart, 1993; Stokes et al., 1991). The haptotactic force refers to the directed migration of ECs from a less adherent surface to a more adherent one and may play a role in dictating EC migration during angiogenesis (Huttenlocher et al., 1996). Local ECM mechanical signaling is essential for capillary formation. Depending on the types and distribution of matrix proteins in the ECM, the ECM can also control the EC apoptotic response (Chen et al., 1997; Deroanne et al., 2001; Ingber, 2002).
This paper presents a stochastic model for tumor vascularization which takes into account the heterogeneous nature of the ECM. We model ECM as a two-phase random medium, where ECs respond differently at each phase: one phase allow capillary formation, the other not. The excluded region need not promote apoptosis; they could just be regions that are not conductive to migration. We have studied the perfusion and the vascularization of a tumor as a function of the distribution and the number of these regions. Our stochastic simulation is a random walk model where the probability of a sprout moving in a given direction is associated with the ECs chemotactic and apoptotic response in that direction. Our model also simulates branching and anastomoses, so that we recreate a vascular network. The probability of having vascular tumor in one of our simulations was measured and correlated with the ECM surface fraction.
Our results show different probability of tumor perfusion or vascularization, depending on the ECM heterogeneity, i.e. distribution and density, and more specifically on whether ECM can sustain percolation between the capillary and the tumor. We present a new look at the geometry of the ECM and how this geometry may regulate angiogenesis
MATHEMATICAL MODEL
In this model, we concentrate on capillary network development and the ECM influence on the vascular network. We define three variables in the model. Capillary presence is represented by an indication function, n (with a value 0 or 1 depending of the presence or not of the capillary). The TAF concentration profile between the tumor and the capillary is denoted by c(x,y). The heterogeneity of ECM is represented by a two phase medium and an indication function, di,j (with a value 0 or 1 depending on the possibility for the ECM to sustain sprout formation). With these three variables, we model the network formation surrounding a tumor.
Model geometry
A classic Folkman tumor model was used: a capillary segment of length d and a tumor area located at a distance d from the capillary. The total domain is a square of area d2, the tumor is at the rightcenter of the domain (half-circle of radius d/20) and the capillary on the left (Figure 1a). All of the boundaries have no flux conditions for cells and TAF (symmetric conditions).
Figure 1.

(a) Geometry and boundary condition of the TAF medium study. (b) TAF concentration profile approximates a gradient produced by a circular tumor source.
Transport of angiogenic factors
Angiogenesis begins with the release of a tumor angiogenic factors (TAF) by tumor cells. Transport of TAF in the ECM involves diffusion, endothelial cell uptake, and chemical inactivation. Finally, a TAF concentration gradient is established between the tumor and the capillary. A partial differential equation of TAF transport in the ECM was previously developed by Anderson and Chaplain (Anderson and Chaplain, 1998):
where C, Dc, and θ are the concentration of TAF, the diffusion coefficient of the TAF, and the decay rate, respectively. With estimates of these parameters and the cell diffusion (Dcell~10−10cm2/s, (Stokes et al., 1991)), it is estimated that the TAF diffuses much faster than the cells and we can reasonably assure the TAF distribution to be in a steady state during the simulation. In the simulation, we approximate the concentration profile by:
where r0 represents the size of the tumor and ν a free parameter (ν=0.158). The distribution of TAF in the ECM is shown in the figure 1b.
Sprout formation and growth
Sprout formation may occur from pre-existing capillaries. The release of TAF by the tumor cells degrade the vessel basement membranes via matrix metalloproteinases (Murphy et al., 1993). Following the disruption of the parent vessel basement membrane, budding sprouts appear. The direction and the growth rate of the new sprout is dictated by the migration and proliferation of the EC localized at the tip of the sprout. The direction of the ECls in the sprout tip is determined by the chemotactic response of the EC and the local interaction between the EC and the ECM.
Growth
Sprout extension depends on the TAF concentration around the tip of the sprout; it must be above a certain threshold to increase cell proliferation (Dellian et al., 1996). Tong et al (Tong and Yuan, 2001) suggest the following function to describe the growth,
where Ct is the concentration threshold (Ct = 0.001) and α the slope of this function (α = 10). In the stochastic model, at each step, f(C) is the probability to have an elongation of length ℓ.
Migration
Even if the direction of the sprout depends on the chemotactic response of the EC in a certain direction, it is the apoptotic response which allows the sprout to grow. The apoptotic response of the EC depends highly on the local physical and chemical properties of the ECM (rigidity, composition, and orientation of the ECM fibers). Since, the ECM in our model is a statistically heterogeneous, only some parts of the ECM are able to support ECs and allow sprout growth. In our simulation ECM is modeled as a square lattice where each site is a box of area ℓ2 and is characterized by a uniform random probability p. If p is higher than a value p0, then the ECM is able to locally support the growth of a sprout. If p is lower than p0, then this area does not allow capillary formation and the sprout cannot go in that direction. Figure 2 shows a typical map of the ECM distribution. We define ECM surface fraction, φ as the ratio area in the square lattice that can support capillary growth and the total area.
Figure 2.

spatial distribution of the ECM material in the study domain. The surface fraction is 0.5.
The sprout direction is determined by the movement of the ECs at the tip. The movement of the sprout is dictated by a combination of random motility and chemotaxis. A discrete model of cell movement is used and the motion of the sprout depends on five coefficients (staying at the same place or moving through the next neighbor). Each coefficient gives the probability for the sprout to go in one of the four possible directions (P1–P4) or to stay at the same position (P0).
Pi is the sum of a random value (random walk) and a chemotactic response in the direction i multiplied by a factor k (k=50). di,j is the apoptotic response of the EC to the ECM.
During the formation of the vascular network, the sprout must be able to form anastomoses with other sprouts and also to create branches. It is the succession of these events that will create a real microvascular network:
-Two sprouts are assumed to form anastomoses when the tip of one sprout meets another sprout. In this case, the growth of the tip stops and the tip merges with the other sprout.
-A new branch appears from existing new tips and the division is due to the presence of TAF. In our stochastic model, the probability to have a branching is proportional to the concentration of TAF (Pbranching=B*C(x,y), B =0.2)
RESULTS
Using this stochastic model, we performed several simulations to study the growth of capillaries toward a tumor. We focus on how the distribution of the ECM (for different surface fraction and tomography) affects the tumor induced angiogenesis. We examine two different cases: a perfused tumor without branching and anastomoses, and a vascularized tumor with branching or anastomoses.
In this section we examine how the ECM surface fraction, φ, affects the ability of the sprout to reach the tumor. In this part, the sprouts do not have the capacity to form the anastomoses and branches which would be necessary for a real vascular network. We assume that sprout formation is a stochastic process.
The simulations start with a fixed number of budding sprouts located randomly on the primary vessel. Each sprout grows independently of the others until it reaches the tumor or cannot move because no favorable site is available in its vicinity. A sprout successfully perfuses the tumor when the head of the sprout reaches the tumor. Figures 3a and 3b show a tumor perfused by five capillaries, generated from five budding sprouts. We define the perfusion percentage as the number of events which gives a perfused tumor, divided by the total number of simulations for the same surface fraction. To collect statistical values, two thousand simulations were completed for each surface fraction, and for each simulation a new random ECM is generated.
Figure 3.

Two-dimensional simulation of tumor perfusion by five initial sprouts. φ=1 (a) and φ=0.9 (b).
For a surface fraction of one (i.e., a homogeneous ECM), the sprout trajectories are uniquely determined by the gradient of TAF and a random walk; all the sprouts can perfuse the tumor (figure 4). A homogeneous ECM does not present any obstacles for the sprout during growth. However a decrease of the ECM surface fraction creates areas that can block the growth of the sprout in one direction. Figure 4 represents the percentage of the sprouts that perfuse the tumor versus the ECM surface fraction.
Figure 4.

Perfusion percentage for different ECM surface fraction density value. The simulations were made for different box edge (ℓ). The number of initial sprout is 2.
For two initial sprouts, a surface fraction threshold around 0.75 is observed under which the tumor is not able to attract the sprouts and be perfused. The value is independent of the size of the box (ℓ) that defines the ECM heterogeneity. Below this threshold, the tumor is not perfused. So, this heterogeneous distribution of the ECM creates a barrier for the angiogenesis. Moreover, the probability to perfuse the tumor at a given surface fraction, as shown in figure 5a is highly dependant on the initial budding sprout number. Fitting these curves with the following function, , we can calculate two parameters: the slope (λ) and the shift (φo).
Figure 5.

Perfusion percentage with different number of initial sprouts for different surface fraction (a) and dimensionless surface fraction (b). The size of the lattice ℓ=d/100.
Both of these parameters could easily be expressed with a power law, λ = α0.Nβ0, where N is the number of sprouts. We calculate α0=12 and β0=0.26 (the functions are shown in frame of the figure 5b). Because the differences between the curves depend only of the initial number of sprouts, we use a special dimensionless surface fraction in order to obtain only one curve (figure 5b):
In the second simulation, we allow the vascular network to include anastomoses and branching. The simulation of a vascular network begins with N budding sprouts. These sprouts grow and form several branches and anastomoses. At the end of the simulation, the tumor is vascularized by several sprouts, exceeding the initial number of budding sprouts (figure 6).
Figure 6.

simulations of a vascular network in ECM for two different surface fractions (φ=1 (a) and φ=0.9 (b)). The branching probability coefficient worth 0.2.
As previously, a tumor is vascularized when, at least, one sprout reaches the tumor. The vascularization percentage is defined as the ration of the number of simulations that results in vascularized tumor and the total number of simulations performed with a fixed surface fraction. There, two thousand simulations were performed and for each simulation a new random ECM was generated.
Figure7 shows that below a threshold surface fraction, the vascular network cannot be developed. The value of the threshold appears to be independent of the box size that defined the medium heterogeneity of the ECM. Moreover the vascularization threshold depends of the initial sprout bud number. The Figure 8 shows different curves of vascularization percentage for different initial sprout number. Fitting this curve with the same error function, we can characterize these curves with two coefficients: λ(slope) and φ0 (shift). In table 1, we present the values of these parameters for different initial sprout number.
Figure 7.

Vascularization percentage for different ECM surface fraction density value. The simulations start with one initial sprout and the probability of branching equal 0.2. The simulations were made for different box edge (ℓ).
Figure 8.

Vascularization percentage of the tumor for different surface fraction and different initial number of sprouts.
Table 1.
slope and the shift values for perfusion percentage curves.
| Initial number of sprouts | ||||||||
|---|---|---|---|---|---|---|---|---|
| 1 | 2 | 3 | 4 | 5 | 7 | 10 | 20 | |
| λ | 11.6 | 14.33 | 16.11 | 16.91 | 17.72 | 18.71 | 18.83 | 20.25 |
| φ0 | 0.87 | 0.85 | 0.83 | 0.83 | 0.82 | 0.81 | 0.81 | 0.80 |
The differences between the curves in the figure 8 depend only on the initial number of sprout. We apply the same dimensionless surface fraction method as previously in order to obtain only one “master” curve: φ* = λγ1.φ or φ* = a1.φ.Nb1 (α1=13 and β1=0.164 and we adjusted the parameter γ in order to unite the curves (γ1=0.140)). Figure 9 shows the previous curves with this special dimensionless surface fraction method. Now, the value for the shift is: .
Figure 9.
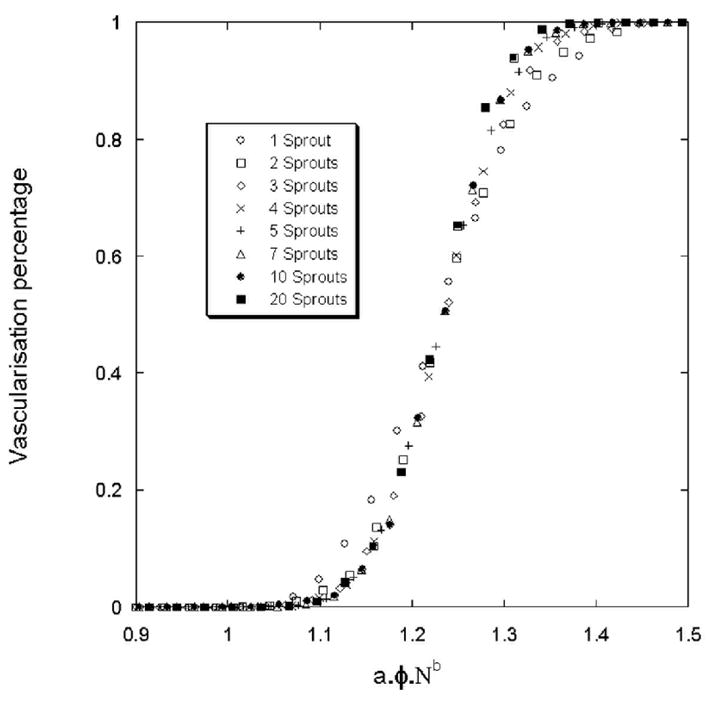
Vascularization percentage for a tumor. The branching probability is 0.2.
Nevertheless, for the same surface fraction value, very different vascular solutions can be found. Figures 10a, 10b, 10c, 10d show four simulations for the same surface fraction (φ=0.8) but with four different ECM distributions. The differences between these vascular networks suggest that not only the surface fraction is important for setting-up angiogenesis, but also the topology of the ECM. It is clear that during the growth of the vascular network, a competition exists between the attraction exerted by tumor and the preferred path created by the ECM. Around the threshold of vascularization, the number of favorable paths for the sprout to reach the tumor is limited. Depending on the ECM organization, the sprout either stops or continues it growth.
Figure 10.

Simulated vascular network for the same ECM surface fraction (φ=0.8) but with four different ECM distributions. The number of initial bud sprouts is 5.
The branching phenomenon during the tumor induced angiogenesis process is also a natural process. As the number of sprouts increase, the vascularization percentage increases. In figure 11, we have sorted the simulations in two categories: sprout growths that reach the tumor and those that doe not reach the tumor. For each category, we have measured the number of final sprout (the initial number was one). As shown in figure 11, the tumor is not vascularized when the number of sprouts is lower than two and the tumor is vascularized when the number of sprout is higher than 9. After few branching events, the tumor is vascularized regardless of the local ECM distribution. Therefore, it is the early stages of the vascular budding that determines if the tumor will be vascularized. Once the sprout is mature enough to branch, the inhibiting effect of the ECM is overcome and the tumor will be vascularized.
Figure 11.

Total final number of sprouts for a vascularized and an unvascularized tumor. All the simulations have started with one budding sprout.
Another way to describe this phenomenon is to measure the local fraction surface at the tip of the sprout. For each simulation, this value is imposed for the entire domain, but locally, this value will fluctuate around this value. A study of this fluctuation gives for a surface fraction of 0.86 of the domain, a local mean value of 0.86±0.07 while we have a value of 0.84±0.06 for the local surface fraction located around the tip of the sprout that does not reach the tumor.
DISCUSSION
The quantitative analysis of vascular networks sprouting from a vessel segment is useful for understanding the underlying mechanisms of vascular morphology. The events involved in the progression from a single cell to a capillary involve essential cell/cell interactions. These interactions are initiated and maintained by a sequence of signals that ultimately result in the formation of a mature capillary. But the morphology of the full vascular network surrounding a tumor is unknown. Different parameters have been used to characterize such networks (fractal dimension, vascular density) and analogies have been made with several model disordered systems. According to Baish et al (Baish et al., 1996; Gazit et al., 1997), a vascular network based on a percolation model explains why these heterogeneous networks have higher resistance than homogeneous network. In a percolation network, the fractal dimension is higher than tissue normal vascular networks and is closer to tumor vessel network observed in vivo (Baish et al., 1996). Diffusion limited aggregation describes more successfully the in vivo growth of vascular networks rather than vascular networks induced by tumor (Landini and Misson, 1993). Also an in vitro study have shown that a fractal dimensions of cellular network fit a diffusion limited cluster aggregation model and depend on the cell concentration (Amyot et al., 2005), i.e cell proliferation will increase the network fractal dimension.
All of these models display properties similar to vascular networks; however they are all based on the assumption that the ECM is a homogeneous medium. Indeed, the ECM is formed form different fibers including collagen and elastin. In the presence of integrin, ECs adhere to these fibers and the ECM mesh. In vivo, it has been demonstrated that in vivo: a preexisting basement membrane in the ECM is the favored path for the perfusion of the tumor by a new capillary (Baluk et al., 2003).
The purpose outcome of tumor-induced angiogenesis is for vessels to perfuse the tumor. In our simulation, we take the number of sprouts that reach a tumor as a measure of tumor perfusion. This growth was through a disordered system, i.e. the distribution of macromolecules in the ECM. This is similar to a typical percolation problem that consists of a threshold concentration (pc) that allows percolation from one edge to the other. Generally, the percolation theory studies the size (fractal dimension) of the percolated domain and, from the scaling theory; we know that the correlation length (ξ) is the only characteristic length in percolation. All the laws and relationships in percolation used this parameter. In our model, we don’t have an exact percolation system. When the sprout grow and invade a site, just the site is occupied, not all the cluster related to this site. Here, our problem have analogies with directed percolation problem: the capillary will try to find his way to reach the tumor through the ECM, but in the same time, the growth of the capillary have to follow the chemotactic gradient and this exclude some pathway. Due to the particular way of capillary growth, only the tip advance and invade the next site. Sometimes, the tip can invade two sites, but only because of the branching phenomena. The structure of the created cluster is strongly anisotropic and two characteristic correlation lengths ξ⊥ and ξ▪ exist, perpendicular and parallel to the main direction. In each case, the critical behavior of both correlation lengths is described by ξ⊥~|pc-p|−ν ⊥ and ξ▪~|pc-p|−ν ▪ with ν⊥≠ν▪ and both are different from the exponent ν. Numerical estimates for pc and ν were obtained for various two dimensional lattices and worth respectively 1.7334±0.001 and 1.0972±0.0006 (Bunde and Havlin, 1991; Domany, 1981; Essam et al., 1986). This lead to a percolation threshold of 0.8228 which very close to our values (Domany, 1981). Thus, the percolation threshold is higher than the regular percolation theory could predict. For example, with a lattice composed by triangle randomly distributed this value is pc=0.6527 (Bunde and Havlin, 1991), 0.67637 for a “Swiss cheese” model (Quintanilla and Torquato, 1996) and 0.5927 for a square lattice (Bunde and Havlin, 1991). Depending of the percolation definition, these values can be very different. In fact, percolation recovers many fields: epidemics, forest fires, kinetics gelation, invasion percolation, directed percolation, percolation and in each case the characteristic correlation length change. In our case, we have a directed percolation where only the last invaded spot can invade the next one. Also, one spot is invaded by step, except if the capillary splits and creates a new branch.
In this paper, we have shown how the ECM topology can block the vascularization of the tumor. Different ECM compositions, as defined by ECM surface fraction, will give different probabilities of vascularization regardless of the initial number of sprouts. We have also examined the importance of branching in this process. By looking where and when the ECM inhibits tumor vascularization, we have shown that the ECM composition around the capillary is essential for the establishment of angiogenesis. If the ECM around the capillaries stops the migration of EC, the tumor will not be vascularized. But if the ECM around the tumor can support angiogenesis, the tumor will be vascularized. Because of the branching, a vascular network will surround the tumor, increasing the probability for a sprout to find a favorable path through the tumor. At the end, the tumor will be vascularized.
Footnotes
Publisher's Disclaimer: This is a PDF file of an unedited manuscript that has been accepted for publication. As a service to our customers we are providing this early version of the manuscript. The manuscript will undergo copyediting, typesetting, and review of the resulting proof before it is published in its final citable form. Please note that during the production process errors may be discovered which could affect the content, and all legal disclaimers that apply to the journal pertain.
References
- Amyot F, Camphausen K, Siavosh A, Sackett D, Gandjbakhche A. Quantitative method to study the network formation of endothelial cells in response to tumor angiogenic factors. IEE Proc-Syst Biol. 2005;152:61–66. doi: 10.1049/ip-syb:20045036. [DOI] [PubMed] [Google Scholar]
- Anderson AR, Chaplain MA. Continuous and discrete mathematical models of tumor-induced angiogenesis. Bull Math Biol. 1998;60:857–99. doi: 10.1006/bulm.1998.0042. [DOI] [PubMed] [Google Scholar]
- Baish JW, Gazit Y, Berk DA, Nozue M, Baxter LT, Jain RK. Role of tumor vascular architecture in nutrient and drug delivery: an invasion percolation-based network model. Microvasc Res. 1996;51:327–46. doi: 10.1006/mvre.1996.0031. [DOI] [PubMed] [Google Scholar]
- Baluk P, Morikawa S, Haskell A, Mancuso M, McDonald DM. Abnormalities of basement membrane on blood vessels and endothelial sprouts in tumors. Am J Pathol. 2003;163:1801–15. doi: 10.1016/S0002-9440(10)63540-7. [DOI] [PMC free article] [PubMed] [Google Scholar]
- Berk DA, Yuan F, Leunig M, Jain RK. Direct in vivo measurement of targeted binding in a human tumor xenograft. Proc Natl Acad Sci U S A. 1997;94 :1785–90. doi: 10.1073/pnas.94.5.1785. [DOI] [PMC free article] [PubMed] [Google Scholar]
- Berthiaume F, Moghe PV, Toner M, Yarmush ML. Effect of extracellular matrix topology on cell structure, function, and physiological responsiveness: hepatocytes cultured in a sandwich configuration. Faseb J. 1996;10:1471–84. doi: 10.1096/fasebj.10.13.8940293. [DOI] [PubMed] [Google Scholar]
- Bischoff J. Cell adhesion and angiogenesis. J Clin Invest. 1997;99:373–6. doi: 10.1172/JCI119168. [DOI] [PMC free article] [PubMed] [Google Scholar]
- Bunde A, Havlin S. Fractal and disordered systems. Springer-Verlag; 1991. [Google Scholar]
- Carmeliet P, Jain RK. Angiogenesis in cancer and other diseases. Nature. 2000;407:249–57. doi: 10.1038/35025220. [DOI] [PubMed] [Google Scholar]
- Carter SB. Haptotactic islands: a method of confining single cells to study individual cell reactions and clone formation. Exp Cell Res. 1967;48:189–93. doi: 10.1016/0014-4827(67)90298-4. [DOI] [PubMed] [Google Scholar]
- Chaplain MA. Mathematical modelling of angiogenesis. J Neurooncol. 2000;50:37–51. doi: 10.1023/a:1006446020377. [DOI] [PubMed] [Google Scholar]
- Chaplain MA, Stuart AM. A model mechanism for the chemotactic response of endothelial cells to tumour angiogenesis factor. IMA J Math Appl Med Biol. 1993;10:149–68. doi: 10.1093/imammb/10.3.149. [DOI] [PubMed] [Google Scholar]
- Chen CS, Mrksich M, Huang S, Whitesides GM, Ingber DE. Geometric control of cell life and death. Science. 1997;276:1425–8. doi: 10.1126/science.276.5317.1425. [DOI] [PubMed] [Google Scholar]
- Dellian M, Witwer BP, Salehi HA, Yuan F, Jain RK. Quantitation and physiological characterization of angiogenic vessels in mice: effect of basic fibroblast growth factor, vascular endothelial growth factor/vascular permeability factor, and host microenvironment. Am J Pathol. 1996;149:59–71. [PMC free article] [PubMed] [Google Scholar]
- Deroanne CF, Lapiere CM, Nusgens BV. In vitro tubulogenesis of endothelial cells by relaxation of the coupling extracellular matrix-cytoskeleton. Cardiovasc Res. 2001;49:647–58. doi: 10.1016/s0008-6363(00)00233-9. [DOI] [PubMed] [Google Scholar]
- Domany E, Kinzel W. Directed Percolation in Two Dimensions: Numerical Analysis and an Exact Solution. Pysical Review Letters. 1981;47:5–8. [Google Scholar]
- Essam JW, De’Bell K, Adler J, Bhatti FM. Analysis of extended series for bond percolation on the directed square lattice. Physical Review B Condensed Matter. 1986;33:1982–1986. doi: 10.1103/physrevb.33.1982. [DOI] [PubMed] [Google Scholar]
- Folkman J. The vascularization of tumors. Sci Am. 1976;234:58–64. 70–3. doi: 10.1038/scientificamerican0576-58. [DOI] [PubMed] [Google Scholar]
- Gazit Y, Baish JW, Safabakhsh N, Leunig M, Baxter LT, Jain RK. Fractal characteristics of tumor vascular architecture during tumor growth and regression. Microcirculation. 1997;4:395–402. doi: 10.3109/10739689709146803. [DOI] [PubMed] [Google Scholar]
- Herbst TJ, McCarthy JB, Tsilibary EC, Furcht LT. Differential effects of laminin, intact type IV collagen, and specific domains of type IV collagen on endothelial cell adhesion and migration. J Cell Biol. 1988;106:1365–73. doi: 10.1083/jcb.106.4.1365. [DOI] [PMC free article] [PubMed] [Google Scholar]
- Huttenlocher A, Ginsberg MH, Horwitz AF. Modulation of cell migration by integrin-mediated cytoskeletal linkages and ligand-binding affinity. J Cell Biol. 1996;134:1551–62. doi: 10.1083/jcb.134.6.1551. [DOI] [PMC free article] [PubMed] [Google Scholar]
- Ingber DE. Mechanical signaling and the cellular response to extracellular matrix in angiogenesis and cardiovascular physiology. Circulation Research. 2002;91:877–87. doi: 10.1161/01.res.0000039537.73816.e5. [DOI] [PubMed] [Google Scholar]
- Kanda S, Miyata Y, Kanetake H. Role of focal adhesion formation in migration and morphogenesis of endothelial cells. Cell Signal. 2004;16:1273–81. doi: 10.1016/j.cellsig.2004.03.010. [DOI] [PubMed] [Google Scholar]
- Landini G, Misson G. Simulation of corneal neovascularization by inverted diffusion limited aggregation. Invest Ophthalmol Vis Sci. 1993;34:1872–5. [PubMed] [Google Scholar]
- Levine HA, Pamuk S, Sleeman BD, Nilsen-Hamilton M. Mathematical modeling of capillary formation and development in tumor angiogenesis: penetration into the stroma. Bull Math Biol. 2001;63:801–63. doi: 10.1006/bulm.2001.0240. [DOI] [PubMed] [Google Scholar]
- Luscinskas FW, Lawler J. Integrins as dynamic regulators of vascular function. Faseb J. 1994;8:929–38. doi: 10.1096/fasebj.8.12.7522194. [DOI] [PubMed] [Google Scholar]
- Murphy AN, Unsworth EJ, Stetler-Stevenson WG. Tissue inhibitor of metalloproteinases-2 inhibits bFGF-induced human microvascular endothelial cell proliferation. J Cell Physiol. 1993;157:351–8. doi: 10.1002/jcp.1041570219. [DOI] [PubMed] [Google Scholar]
- Nehls V, Herrmann R. The configuration of fibrin clots determines capillary morphogenesis and endothelial cell migration. Microvasc Res. 1996;51:347–64. doi: 10.1006/mvre.1996.0032. [DOI] [PubMed] [Google Scholar]
- Palecek SP, Loftus JC, Ginsberg MH, Lauffenburger DA, Horwitz AF. Integrin-ligand binding properties govern cell migration speed through cell-substratum adhesiveness. Nature. 1997;385:537–40. doi: 10.1038/385537a0. [DOI] [PubMed] [Google Scholar]
- Pizzo AM, Kokini K, Vaughn LC, Waisner BZ, Voytik-Harbin SL. Extracellular matrix (ECM) microstructural composition regulates local cell-ECM biomechanics and fundamental fibroblast behavior: a multidimensional perspective. J Appl Physiol. 2005;98:1909–21. doi: 10.1152/japplphysiol.01137.2004. [DOI] [PubMed] [Google Scholar]
- Pluen A, Boucher Y, Ramanujan S, McKee TD, Gohongi T, di Tomaso E, Brown EB, Izumi Y, Campbell RB, Berk DA, et al. Role of tumor-host interactions in interstitial diffusion of macromolecules: cranial vs. subcutaneous tumors. Proc Natl Acad Sci U S A. 2001;98:4628–33. doi: 10.1073/pnas.081626898. [DOI] [PMC free article] [PubMed] [Google Scholar]
- Quintanilla J, Torquato S. Clustering properties of d-dimensional overlapping spheres. Physical Review E Statistical Physics, Plasmas, Fluids, and Related Interdisciplinary Topics. 1996;54:5331–5339. doi: 10.1103/physreve.54.5331. [DOI] [PubMed] [Google Scholar]
- Reinhart-King CA, Dembo M, Hammer DA. The dynamics and mechanics of endothelial cell spreading. Biophys J. 2005;89:676–89. doi: 10.1529/biophysj.104.054320. [DOI] [PMC free article] [PubMed] [Google Scholar]
- Shim EB, Kwon YG, Ko HJ. Computational analysis of tumor angiogenesis patterns using a two-dimensional model. Yonsei Med J. 2005;46:275–83. doi: 10.3349/ymj.2005.46.2.275. [DOI] [PMC free article] [PubMed] [Google Scholar]
- Sholley MM, Ferguson GP, Seibel HR, Montour JL, Wilson JD. Mechanisms of neovascularization. Vascular sprouting can occur without proliferation of endothelial cells. Lab Invest. 1984;51:624–34. [PubMed] [Google Scholar]
- Stokes CL, Lauffenburger DA, Williams SK. Migration of individual microvessel endothelial cells: stochastic model and parameter measurement. J Cell Sci. 1991;99 (Pt 2):419–30. doi: 10.1242/jcs.99.2.419. [DOI] [PubMed] [Google Scholar]
- Sun S, Wheeler MF, Obeyesekere M, Patrick CW., Jr A deterministic model of growth factor-induced angiogenesis. Bull Math Biol. 2005;67:313–37. doi: 10.1016/j.bulm.2004.07.004. [DOI] [PubMed] [Google Scholar]
- Sympson CJ, Talhouk RS, Alexander CM, Chin JR, Clift SM, Bissell MJ, Werb Z. Targeted expression of stromelysin-1 in mammary gland provides evidence for a role of proteinases in branching morphogenesis and the requirement for an intact basement membrane for tissue-specific gene expression. J Cell Biol. 1994;125:681–93. doi: 10.1083/jcb.125.3.681. [DOI] [PMC free article] [PubMed] [Google Scholar]
- Terranova VP, DiFlorio R, Lyall RM, Hic S, Friesel R, Maciag T. Human endothelial cells are chemotactic to endothelial cell growth factor and heparin. J Cell Biol. 1985;101:2330–4. doi: 10.1083/jcb.101.6.2330. [DOI] [PMC free article] [PubMed] [Google Scholar]
- Tong S, Yuan F. Numerical simulations of angiogenesis in the cornea. Microvasc Res. 2001;61:14–27. doi: 10.1006/mvre.2000.2282. [DOI] [PubMed] [Google Scholar]