

Abstract
Despite increasingly widespread use of recombinant adeno-associated virus (AAV) and lentiviral (LV) vectors for transduction of neurons in a wide range of brain structures and species, the diversity of cell types within a given brain structure is rarely considered. For example, the ability of a vector to transduce neurons within a brain structure is often assumed to indicate that all neuron types within the structure are transduced. We have characterized the transduction of mouse somatosensory cortical neuron types by recombinant AAV pseudotyped with serotype 1 capsid (rAAV2/1) and by recombinant lentivirus pseudotyped with the VSV glycoprotein. Both vectors utilized human synapsin (hSyn) promoter driving DsRed-Express. We demonstrate that high titer rAAV2/1 efficiently transduces both cortical excitatory and inhibitory neuronal populations, but use of lower titers exposes a strong preference for transduction of cortical inhibitory neurons and layer 5 pyramidal neurons. In contrast, we find that VSV-G- LV-hSyn principally labels excitatory cortical neurons at the highest viral titer generated. These findings demonstrate that endogenous tropism of rAAV2/1 and VSV-G- LV can be used to obtain preferential gene expression in mouse somatosensory cortical inhibitory and excitatory neuron populations, respectively.
Introduction
Recombinant adeno-associated viruses (AAVs) and lentiviruses (LVs) hold promise as gene therapy vectors and are valuable experimental tools due to their perceived low toxicities and stable long-term transgene expression (McCown, 2005). These vectors are particularly useful in the nervous system due to their ability to infect non-dividing cells (Naldini et al., 1996, Miao et al., 2000). Such vectors have opened up an extensive range of possibilities due to their ability to cause expression of virtually any gene. Furthermore, one of the chief advantages of genetic methods is the ability to target gene expression to particular cell types, for example within complex neuropil, which contains many distinct cell types with their axonal and dendritic arbors intimately intertwined.
Cell type specific gene expression can be achieved by many different approaches. The most successful approaches to date have involved the generation of transgenic mouse lines using bacterial artificial chromosome or “knock-in” technologies (Hanks et al., 1995, Heintz, 2001). These strategies take advantage of large stretches of regulatory genomic DNA or endogenous genetic regulatory elements to generate expression of a transgene which mimics expression of an endogenous gene. Although these methods are extremely useful, transgenic methods are not practical in humans or in most mammalian species other than rodents. Thus, it is desirable to also have the ability to generate cell type specific expression from viral vectors. Using viral vectors, selectivity can be achieved by natural or engineered tropism (Bowles et al., 2003, Muller et al., 2003, Perabo et al., 2003, Rabinowitz et al., 2004, Warrington et al., 2004, Choi et al., 2005, Maheshri et al., 2006, Perabo et al., 2006, Wu et al., 2006a, Li et al., 2008, Van Vliet et al., 2008), or insertion of gene regulatory elements into the viral genome (Chen et al., 1999, Cucchiarini et al., 2003, Dittgen et al., 2004, Zheng and Baum, 2005, Hioki et al., 2007). However, these approaches are still in their infancy and not well understood.
As viral vector technologies become increasingly sophisticated and as they are combined with other approaches, such as cell type specific promoters, there is an increasing level of complication involved in understanding why a particular approach is or is not successful. As a result it is important not only to understand the individual factors that influence cell type specific expression, but also how they interact.
Despite the potential for variable tropism observed between viral serotypes and the likely dependence on viral titer, there have been few careful studies of the cell types that are transduced within a given brain area. And studies carefully examining the relationships between viral tropism, titer, and cell type specific regulatory elements are even more rare or non-existent. Some studies have described the ability to selectively transduce a particular cell type when using a putative cell type specific promoter in a given vector. However, without direct comparisons of gene expression patterns observed between specific and general promoters, it is not possible to determine whether expression in the targeted cell type resulted from selectivity conferred by the promoter versus viral tropism, or a combination of both. Here we describe the transduction efficiencies of rAAV2/1 (AAV2 backbone packaged with AAV1 capsid) and VSV (vesicular stomatitis virus)-G-pseudotyped LV in the adult mouse somatosensory cortex.
Experimental Procedures
Virus Promoters
The human synapsin I promoter (hSyn) (Kugler et al., 2003a), was the 469bp human sequence chrX:47,364,154-47,364,622 (UCSC March 2006 assembly). The mouse α-calcium/calmodulin-dependent protein kinase II promoter (mCAMK) (CKa13) (Dittgen et al., 2004) was the 1289bp mouse sequence chr18:61,084,084-61,085,372 (UCSC July 2007 assembly) cloned from pLenti-CaMKIIa-hChR2-EYFP-WPRE, courtesy of K. Deisseroth. The hybrid CMV/chicken β-actin promoter (CAG) promoter (Niwa et al., 1991), was the ~1700bp sequence cloned from pCAG-GFP, courtesy of D.D. O’Leary.
Virus Production
Promoters were cloned into either AAV or LV transfer vectors. Components of AAV include: ITR- AAV2 inverted terminal repeat, SD/SA- splice donor/acceptor sequence (human beta globin) (Kaspar et al., 2002), red fluorescent protein DsRed-Express(Mikkelsen et al., 2003) (RFP), and BGH- bovine growth hormone poly (A) signal. Components of LV (modified version of pCSC-SP-PW(Marr et al., 2004)) include: LTR- long terminal repeat, Psi- element for viral genome packaging, RRE- Rev response element, cPPT- central polypurine tract, WPRE- woodchuck hepatitis virus posttranscriptional regulatory element, U3PPT- upstream border of the 3′ long terminal repeat polypurine tract. Plasmids were purified using endotoxin-free maxiprep kits (Qiagen, Valencia, CA). Recombinant rAAV2/1 serotype was produced by BBS/CaCl2 or polyethyleneimine (PEI) mediated co-transfection of 293T cells with the AAV2 ITR flanked transfer vector, pXR1 (AAV type-1) and pXX6-80 (Ad5 genome) (Rabinowitz et al., 2002). Cells were harvested and lysed, treated with benzonase (Sigma-Aldrich D9542, St. Louis, MO), and virus was concentrated and purified by iodixanol gradient centrifugation and harvested in the 40% iodixanol band (Zolotukhin et al., 1999). Virus dilutions were in 40% iodixanol. Lentivirus was produced by BBS/CaCl2 mediated co-transfection of 293T cells with the hSyn transfer vector and plasmids pMDL, pRev, and pVSVG (Naldini et al., 1996). Media was collected and virus concentrated through multiple centrifugation steps (Tiscornia et al., 2006).
Virus Titration
Viral genomes were quantified using a qPCR cycler (ABI 7900HT, Applied Biosystems, Foster City, CA) and SYBR Green with DsRed-Express specific primers 5′-AGGACGTCATCAAGGAGTTC and 5′-TCTGGGTGCCCTCGTAG and serially diluted virus. AAV genomic DNA was isolated by lysing AAV in 2M NaOH for 30min at 56C, and neutralizing with HCl. LV was incubated with DNase I (NEB, Ipswich, MA), and RNA isolated (QIAamp MinElute Virus Spin kit, Qiagen, Valencia, CA), followed by reverse transcription (Superscript III kit, Invitrogen, Carlsbad, CA). Viral DNA was diluted and compared to a standard curve created from a known quantity of transfer vector. Infectious titers were determined by infecting confluent 293T cells with six ten-fold dilutions of virus, followed 60 hours later by two PBS washes, trypsinization, centrifugation to isolate cells, DNA isolation by proteinase K digestion in SNET lysis buffer (20mM Tris (pH 8), 1mM EDTA, 1% SDS, 0.4M NaCl) at 55C for 12 hours, followed by phenol/chloroform extraction and alcohol precipitation. qPCR was performed in the same manner as used to determine the genomic titer. Since isolation of DNA from the infected cells was not 100% efficient and differed between samples, infectious titers were calculated by normalizing the qPCR titer by the efficiency of DNA isolation. Since nearly all isolated nucleic acid was cellular in origin and not viral, and assuming cell numbers were equal between samples, DNA isolation efficiency was estimated by the concentration of nucleic acid as determined by spectrophotometry. The isolation efficiency of cellular genomic DNA and viral DNA was assumed to be the same. Individual normalization factors were calculated as the ratios of the concentrations of precipitated nucleic acid divided by the highest concentration value of all precipitated nucleic acid preparations. Thus, this normalization method presumably underestimates infectious titer by the amount of our most efficient nucleic acid isolation procedure. Average normalization ratios for rAAV2/1-hSyn-RFP batch 1, rAAV2/1-hSyn-RFP batch 2, rAAV2/1-CAG-RFP. rAAV2/1-mCAMK-RFP, and VSV-G- LV-hSyn-RFP were 2.2, 1.5, 1.7, 1.4 and 2.0, respectively. Even though LV integrates and AAV largely remains episomal, both forms of DNA can be isolated via this procedure using SNET buffer lysis, phenol/chloroform extraction and alcohol precipitation.
Virus Injections
GAD67-GFP (Δneo) mice (Tamamaki et al., 2003) were injected with viruses following procedures approved by the Salk Institute Animal Care and Use Committee. In this study these transgenic mice are referred to as GAD67-GFP knock-in mice. Because we could not obtain robust and consistent GAD or GABA antibody staining in mice, we used GFP expression in GAD67 knock-in mice, produced by Tamamaki et al (Tamamaki et al., 2003), as an inhibitory neuron marker for co-label studies. Produced by inserting enhanced GFP cDNA into the ATG translation initiation codon of the glutamate decarboxylase 67 (GAD67) locus, GAD67-GFP knock-in mice express enhanced GFP in GABAergic neurons under the control of the endogenous GAD67 gene promoter. Tamamaki et al found 80–90% of the GFP-labeled cells were positive for GAD67 or GABA immunoreactivity in the somata, and almost all labeled cells were immunoreactive if the neuropil was also included. Conversely, basically all of the GAD67-immunoreactive cells labeled with GFP in the perikarya or neuropil. These animals were reported to exhibit normal growth, behavior and no abnormality at the macroscopic level. GABA content was significantly lower than in wildtype mice at birth, but not at the 6–7 week-old stage. GAD67-GFP knock-in mice produced by crossing GAD67-GFP knock-in mice with wildtype C57BL/6 or ICR mice were injected between 10 and 30 weeks old. Animals were anesthetized using a cocktail of ketamine and xylazine, and/or isoflurane. Virus was stereotaxically injected into somatosensory cortex, 0.5mm posterior to bregma, 3–3.5mm lateral to the midline, at depths of 0.75μm and 0.45μm from the surface. Virus was delivered via a glass micropipette (~30-50μm tip diameter) using air pressure pulses applied via a Picospritzer II (General Valve Corporation, Fairfield, NJ) at 20psi, with 1 pulse per second. Virus was injected for 5 minutes per depth, which usually corresponded to 1–2ul of virus. The pulse duration was adjusted to modulate the flow rate.
Histology and Immunohistochemistry
2–3 weeks following injection, animals were perfused with PBS followed by 4% paraformaldehyde in phosphate buffer. Brains were post-fixed in 4% paraformaldehyde for 16 hours and sunk in 30% sucrose in PBS. 25–35μm thick sections cut on a freezing microtome were stained with one or more of the following antibodies: Chicken anti-GFP (Aves LabsGFP-1020 1:500, Tigard, OR), Rabbit anti-DsRed (Clontech 632496 1:200, Mountain View, CA), and Mouse anti-NeuN (Millipore MAB377 1:100, Billerica, MA). As secondary antibodies we used one or more of Cy2 (Jackson Immuno 703-225-155 1:100, West Grove, PA), AlexaFluor 568 (Invitrogen A11036 1:100, Carlsbad, CA), and Cy5 (Jackson Immuno 715-175-151 1:100) fluorophore conjugated antibodies raised against the appropriate species. Mounted sections were counterstained with 10μM DAPI (Sigma-Aldrich D9542, St. Louis, MO) in PBS. Sections were dehydrated through xylenes and coverslipped using Krystalon (EMD Chemicals, Gibbstown, NJ).
Imaging and Cell-Counting
The data described in Results are based on observations of label from at least 3, and typically 4–5 viral vector injections, for each vector (see Table 2). In most cases a single injection was analyzed from each animal, however, in some cases a second injection was made and analyzed from the opposite hemisphere. In all cases, reporter gene expression was restricted to the injected hemisphere, with no evidence of retrograde infection via axon terminals. For the purpose of statistical analyses, each injection was considered as an independent sample, as the variability between injections is presumed to be far greater than the variability between animals. For each injection analyzed, tissue sections were scanned to identify the region with the highest density of labeling and this was considered the center of the injection site. Neurons expressing reporter from the injected vector were counted in this section and up to 8 adjacent sections and scored for co-label with GFP (inhibitory neurons) and RFP (virus label) and/or NeuN. The total numbers of labeled cells counted and scored varied between sections and layers due to differences in labeling density for different vectors. Statistical analysis was performed using two tailed, unequal variance Welch’s t-tests. Typically, about 700 neurons were counted for each injection (range: average of ~1600 neurons per injection for AAV-hSyn 1:5 to ~350 neurons per injection for AAV-CAG) and a total of more than 1400 neurons for each vector. An exception was AAV-hSyn diluted 125-fold, for which relatively few cells were labeled and only 543 cells were scored from a single injection analyzed.
Table 2. Virus expression counts in GAD67-GFP mice.
The number of animals, injections, sections, and cells counted are shown for somatosensory cortical layers 2/3–6. The average, maximum and minimum numbers of cells counted are shown for each virus. Inhibitory neurons are defined by GAD67-GFP+ (GAD67+) expression. Excitatory neuron counts are indicated by “exc”.
| # counted cells | Summary | ||||||||||||||
|---|---|---|---|---|---|---|---|---|---|---|---|---|---|---|---|
| Virus | # of animals |
# of inject- ions |
# of total sections |
L2/3 exc |
L2/3 GAD67+ |
L4 exc |
L4 GAD67+ |
L5 exc |
L5 GAD67+ |
L6 exc |
L6 GAD67+ |
Total # of cells |
Avg cells/ inj |
Max cells/ inj |
Min cells/ inj |
| AAV-hSyn 1:1 | 3 | 4 | 10 | 1398 | 286 | 798 | 141 | 935 | 230 | 495 | 89 | 4372 | 1093 | 1807 | 384 |
| AAV-hSyn 1:5 | 2 | 5 | 15 | 1464 | 924 | 244 | 216 | 1803 | 687 | 700 | 353 | 6391 | 1278 | 2608 | 405 |
| AAV-hSyn 1:25 | 4 | 5 | 25 | 146 | 557 | 21 | 372 | 432 | 911 | 99 | 247 | 2785 | 557 | 725 | 446 |
| AAV-hSyn 1:125 | 1 | 1 | 9 | 6 | 149 | 4 | 87 | 98 | 184 | 2 | 13 | 543 | 543 | 543 | 543 |
| AAV-hSyn (batch 2) | 4 | 4 | 28 | 332 | 864 | 130 | 465 | 981 | 790 | 96 | 150 | 3808 | 952 | 1413 | 481 |
| AAV-CAG | 4 | 7 | 18 | 188 | 500 | 32 | 249 | 831 | 431 | 107 | 150 | 2488 | 355 | 580 | 229 |
| AAV-mCAMK | 3 | 3 | 17 | 486 | 120 | 63 | 31 | 533 | 107 | 96 | 21 | 1457 | 486 | 757 | 108 |
| LV-hSyn | 5 | 5 | 27 | 807 | 66 | 889 | 37 | 836 | 71 | 562 | 41 | 3309 | 662 | 727 | 562 |
To count and score labeled cells, fluorophores were independently imaged at 10× or 20× magnification using either a Nikon TE300 with a Bio-Rad radiance 2100 system or an Olympus BX51 with a Bio-Rad Radiance 2100MP system at 3 confocal planes. Images were projected and merged into RGB color space. Independent RGB channels were linearly adjusted in Adobe Photoshop to optimize image brightness. Quantification of overlap of perikarya and/or neuropil cell labeling was done using the RGB separated confocal images in Adobe Photoshop. Cortical layers were determined by DAPI or NeuN staining.
Results
The studies described here focus on the ability of rAAV2/1 (AAV) and VSV-G- LV (LV) vectors to transduce inhibitory versus excitatory mouse somatosensory cortical neurons, and of the mCAMK promoter to preferentially drive gene expression in excitatory mouse somatosensory cortical neurons. All viral vectors used expression of the red fluorescent protein, DsRed-Express (Clontech) (Mikkelsen et al., 2003) (referred to as RFP) as a reporter (Table 1). To facilitate identification of GABAergic inhibitory neurons without confounds related to GAD or GABA antibody specificity and staining reliability, all vectors were assessed following injections into the somatosensory cortex of transgenic mice in which green fluorescent protein (GFP) was inserted into the glutamate decarboxylase 67 (GAD67) locus (Tamamaki et al., 2003). In these mice, almost all of the GFP-positive cells showed GAD67 immunoreactivity in the perikarya or neuropil (Tamamaki et al., 2003). Conversely, basically all of the GAD67-immunoreactive cells labeled with GFP in the perikarya or neuropil. In the typical experiment (see Experimental Procedures for details), cortical injections of the viral vector were followed by a period of 2–3 weeks to allow for reporter gene expression. Animals were then perfused and the brains sectioned and double-stained for anti-GFP and anti-RFP with appropriate fluorescent secondary antibodies to amplify the green and red signals, respectively (Table 2). Sections were also counterstained with DAPI to allow for identification of cortical layers. In selected cases, anti-NeuN, a neuron specific antibody (Peterson et al., 1996), was used to allow for quantification of neurons versus glia. Labeled neurons were quantified and scored as single, double, or triple stained using confocal microscopy (e.g. Fig. 1).
Table 1.
Genomic and infectious titers.
| Virus | Genomic titera | Relative genomic titerb | Infectious titerc | Relative infectious titerb |
|---|---|---|---|---|
| rAAV2/1-hSyn-RFP (batch 1) 1:1 | 8.4 × 10¹² | 100.0% | 8.1 × 10¹⁰ | 100.0% |
| rAAV2/1-hSyn-RFP (batch 1) 1:5 | 1.7 × 10¹² | 20.0% | 1.6 × 10¹⁰ | 20.0% |
| rAAV2/1-hSyn-RFP (batch 1) 1:25 | 3.4 × 10¹¹ | 4.0% | 3.2 × 10⁹ | 4.0% |
| rAAV2/1-hSyn-RFP (batch 2) | 1.2 × 10¹¹ | 1.5% | 1.1 × 10¹⁰ | 13.2% |
| rAAV2/1-CAG-RFP | 5.8 × 10¹¹ | 6.8% | 4.2 × 10⁹ | 5.2% |
| rAAV2/1-mCAMK-RFP | 2.6 × 10¹¹ | 3.0% | 3.3 × 10⁹ | 4.1% |
| VSV-G- LV-hSyn- RFP | 3.5 × 10¹¹ | 4.1% | 2.9 × 10⁹ | 3.5% |
Determined using qPCR from lysed virus (genome copies/ml).
Normalized to rAAV2/1-hSyn-RFP (batch 1) 1:1.
Determined using qPCR from infected 293T cells (infectious particles/ml).
Figure 1. Virus injections in GAD67-GFP mice.

GAD67-GFP mice injected with AAV and LV. The left column, (a–c), illustrates GAD67-GFP expression in somatosensory cortex corresponding to the AAV-CAG-RFP injection shown in the next column. Subsequent columns show virus expression: AAV-CAG-RFP (d–f), AAV-hSyn-RFP diluted 1:25 (g–i), AAV-hSyn-RFP 1:1 (j–l), and LV-hSyn-RFP (m–o). The first row (a,d,g,j,m) shows expression patterns through all cortical layers. Close-up images centered on layers 2/3 and 5 are shown in rows 2 (b,e,h,k,n) and 3 (c,f,i,l,o), respectively. GAD67-GFP label is shown in green, and virus expression in red. Co-labeled cells are of varied yellow hue. Examples of co-labeled inhibitory neurons are shown by upward pointing arrows, excitatory neurons by downward pointing arrows, and non-neuronal cells by boxes. Dorsal (D) and medial (M) directions are indicated by the orientation grid. Orientation of rows 2 and 3 are as in b. Scale bars in a and b are both 50 μm. Scale bar in a applies to a,d,g,j,m. Scale bar in b applies to b,c,e,f,h,i,k,l,n,o.
Transduction of cortical neurons was tested with three different promoters driving RFP expression in AAV. These included the hybrid CMV/chicken β-actin promoter (CAG) (Niwa et al., 1991), the human synapsin promoter (hSyn) (Kugler et al., 2003a), and the mouse α-calcium/calmodulin-dependent protein kinase II promoter (mCAMK) (Dittgen et al., 2004). LV was tested using only the hSyn promoter. Genomic and infectious titers (Table 1) were determined using qPCR from lysed virus and infected 293T cells, respectively (see Experimental Procedures for further details). AAV-CAG, AAV-mCAMK, LV-hSyn and 1:25 diluted AAV-hSyn viruses were of similar infectious titer.
AAV biased expression towards inhibitory neurons
The CAG promoter in AAV drove expression in excitatory and inhibitory neurons, and glia (Figs. 1d–f). Quantification of neuron expression required staining for NeuN to exclude abundant populations of glial cells (Fig. 2). The percentages of transduced neurons which were either excitatory or inhibitory were quantified and compared to expected values as follows. The percentage of transduced neurons that were inhibitory was expressed as the number of triple-labeled (GFP, RFP and NeuN) neurons divided by the total number of transduced neurons (double-labeled RFP and NeuN). The remaining neurons were assumed to be excitatory. Expected values (assuming random transduction) were estimated by quantifying NeuN expression in GAD67-GFP mice. Cells double-labeled (GFP and NeuN) were counted as inhibitory, and the remaining NeuN cells as excitatory. Because neuronal labeling varied depending on cortical layers, labeled neurons and expected values were quantified for each distinct cortical layer. The calculated expected inhibitory percentages for layers 2/3, 4, 5 and 6 were 15%, 10%, 21% and 12%, respectively. Quantification of expression from AAV-CAG showed that in cortical layers 2/3, 4 and 6, reporter expression was strongly biased towards inhibitory neurons compared to excitatory neurons (Fig. 3). The percentages of inhibitory neurons that expressed RFP were 75% in layer 2/3, 88% in layer 4, and 60% in layer 6, which were 5–9-fold higher than expected in these layers. In contrast, the percentage of inhibitory neurons in layer 5 was only 36%, which is closer to the expected value of 21% in that layer. (Layer 1 neurons are only inhibitory and data are therefore not shown.) Welch’s t-test analysis indicate the distributions of AAV-CAG are significantly different than the expected values in all layers, including layer 5 (p=0.004) (Fig. 3).
Figure 2. NeuN labeling distinguishes neurons from glia in rAAV2/1-CAG-RFP sections.
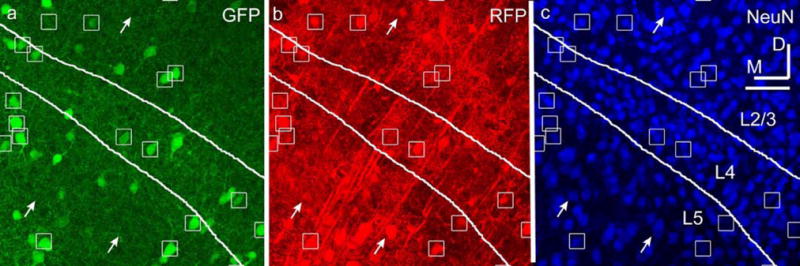
(a) GAD67-GFP expression. (b) rAAV2/1-CAG-RFP expression. (c) NeuN labels neurons. All three panels are images of the same section. A subset of inhibitory neurons is marked with boxes and excitatory neurons with arrows. Layers 2/3, 4, and 5 are indicated. Dorsal (D) and medial (M) directions are indicated. Scale bar is 50 μm.
Figure 3. Differences in promoter, titer and virus type affect excitatory and inhibitory neuron labeling.

Percentages of excitatory neuron label are shown in dark grey and inhibitory neuron label in light grey. Distributions are shown separately for mouse somatosensory cortical layers 2/3, 4, 5 and 6, for each viral vector tested. The thick horizontal lines indicate percentages of inhibitory/excitatory neurons expected from unbiased transduction. Error bars indicate the standard deviation. Welch’s t-test statistics comparing virus to unbiased transduction values are indicated by the corresponding p-values. Some error bars for expected values are smaller than the thickness of the lines. Sample sizes are the number of viral injections. AAV-CAG (rAAV2/1 with CAG promoter), n=6. AAV-hSyn 1:1 (undiluted rAAV2/1 with human synapsin promoter), n=4. AAV-hSyn 1:25 (diluted 25-fold), n=5. LV-hSyn (VSV-G-pseudotyped lentivirus with human synapsin promoter), n=5. AAV-mCAMK (rAAV2/1 with mouse α-CaMKII promoter), n=2–3.
These observations indicate that under the conditions tested (titer and promoter), rAAV2/1 can selectively label inhibitory relative to excitatory neurons with a bias up to 9-fold relative to expected values. We hypothesized that the higher proportions of inhibitory neurons observed with the AAV-CAG vector described above were related to the relatively low titer of that virus (see Table 1).
Proportion of excitatory and inhibitory neuron label depended on AAV titer
To systematically and quantitatively test the role of AAV viral titer, we used the hSyn promoter in order to avoid complications related to the transduction of glial cells. The hSyn promoter has been shown to drive near perfect neuron restrictive transgene expression in rat brain in adenovirus (Ralph et al., 2000, Glover et al., 2002), AAV (Kugler et al., 2003b) and LV (Hioki et al., 2007). Our use of AAV-hSyn in mice also successfully eliminated glia expression (data not shown). As hypothesized, high titer AAV-hSyn (see titer in Table 1) labeled vast quantities of neurons, including excitatory and inhibitory neurons in all cortical layers at proportions indistinguishable from their expected distributions (Figs. 1j–l, 3 and 4).
Figure 4. Dilution rAAV2/1 vector shifts labeling towards inhibitory neurons.

Excitatory and inhibitory neuron expression is quantified as a function of viral titer. Dilution of rAAV2/1-hSyn causes a shift in expression towards inhibitory neurons. Distributions of rAAV2/1-hSyn expression at 1:1 (diamond, n=4), 1:5 (square, n=5), 1:25 (triangle, n=5), and 1:125 (circle, n=1), and 1:8 equivalent batch 2 version (x, n=4) are shown for somatosensory layers 2/3, 4, 5 and 6. The thick horizontal bars indicate expected neuron distributions from unbiased neuron transduction. Standard deviations are indicated, except for the 1:125 dilution which consists of cells counted from only one viral vector injection.
Of the dilutions of AAV-hSyn tested, only the highest titer showed labeling that was not biased towards inhibitory neurons. Twenty-five fold dilution of this virus resulted in a clear shift towards greater percentages of labeled inhibitory neurons compared to excitatory neurons in all layers, including layer 5 (Figs. 1g–i, 3 and 4). At 1:25 dilution, the bias towards inhibitory neurons was most pronounced in layers 2/3 and 4, where 81% and 95% of labeled neurons were inhibitory, respectively. The percentage of labeled neurons that were inhibitory was lowest in layer 5 (69%), but this still represents a 3-fold higher percentage than expected by chance and twice the percentage observed with AAV-CAG. The expression difference between 1:25 diluted AAV-hSyn and AAV-CAG, which are similar in titer, is pronounced in layer 5 (p=0.001), suggesting the possibility of an influence of the CAG promoter in this layer.
Lower titer virus resulted in higher proportions of inhibitory versus excitatory neuron label. A systematic difference in expression was seen across all layers when comparing between dilutions of 1:1, 1:5 and 1:25 of AAV-hSyn (Fig. 4). Percentages of inhibitory neurons labeled at 1:5 dilution were intermediate to the values at 1:1 and 1:25. Very few cells were labeled with the 1:125 dilution, and only one animal was injected; but nevertheless a clear bias towards inhibitory neuron labeling was still apparent. Finally, a different batch of the AAV-hSyn (batch 2) with an infectious titer equivalent to a 1:8 dilution of the highest titer AAV, resulted in a labeling bias towards inhibitory neurons that was intermediate to the 1:5 and 1:25 dilutions.
LV predominantly labeled excitatory neurons
Results with VSV-G-pseudotyped LV contrasted sharply with those from rAAV2/1. Using the same hSyn promoter, LV at the highest titer produced, predominantly labeled excitatory cortical neurons (Figs. 1m–o and 3). LV-hSyn only co-labeled with GFP-labeled inhibitory neurons in 7%, 4%, 8% and 6% of neurons in layers 2/3, 4, 5 and 6, respectively. In all cortical layers, the percentages of labeled neurons that were inhibitory were lower than expected, by about half. T-test statistics indicate a difference from expected with p ≤0.04 in all layers, and lower in layers 2/3, 5 and 6 (p=0.013 for layer 2/3; p=0.011 for layer 5; p=0.013 for layer 6).
The observation that LV-hSyn expression is biased towards excitatory neurons further supports the conclusion that preferential transduction of inhibitory neurons with low titer AAV-hSyn is due to preferential transduction and not the result of a bias in transcription introduced by the hSyn promoter. The contrast between vectors further suggests that VSV-G- LV might preferentially transduce excitatory versus inhibitory cortical neurons at the titer tested. However, an alternative possibility is suggested by the observation that in the case of some LV-hSyn injections, we observed fewer and less bright GFP expression at the center of LV injections (Fig. 5). This suggested that the LV injections could have resulted in selective inhibitory cell damage or changes in gene expression. However, diminished NeuN antibody label in this area suggested pan-neuronal damage. Cells were not counted at the centers of injection where GFP or NeuN labeling was abnormal. These observations are discussed further below.
Figure 5. Labeling is impaired at the center of some LV injections.

Decreased GFP and NeuN labeling indicate neuron toxicity or decreased gene expression at the center of some LV injections. GAD67-GFP+ cells are shown in green (a), LV-hSyn-RFP+ cells are shown in red (b), NeuN+ neurons are shown in blue (c), and DAPI+ cells are shown in blue (d). The impaired region delineated in white, defined by decreased GFP or NeuN label, is not included in the double labeling counts. The center of the injection is marked by the arrow shown in d. Dorsal (D) and lateral (L) directions are indicated. Scale bar is 50 μm.
A previous study by Dittgen et al (2004) described selective expression of reporter in excitatory neurons using a 1.3kb mouse α-CaMKII (mCAMK) promoter in VSV-G- LV. Our observations with LV-hSyn suggest that the observed bias might be due, at least in part, to selective transduction with LV (or reduction in the number or labeling of inhibitory neurons) rather than entirely due to transcriptional regulation by the mCAMK promoter. To further test the ability of the mCAMK promoter to bias transcription and reporter gene expression towards excitatory neurons, we used the same 1.3kb mCAMK promoter in AAV. The infectious titer used was similar to the titer that biased expression towards inhibitory neurons when using the hSyn and CAG promoters (see Table 1). Under these conditions, the mCAMK promoter consistently drove gene expression in both inhibitory and excitatory neurons (Figs. 3 and 6), indicating that in the AAV context this promoter does not restrict expression only to excitatory neurons in mouse somatosensory cortex. Nevertheless, the mCAMK promoter appears to introduce a strong transcriptional bias towards excitatory neurons (Fig. 3). In particular, the percentages of RFP expressing neurons that were inhibitory were far lower with the AAV-mCAMK vector than with the AAV-CAG or AAV-hSyn vectors at similar titers (p<0.05 for both in all layers).
Figure 6. mCAMK promoter drives expression in inhibitory neurons in rAAV2/1.
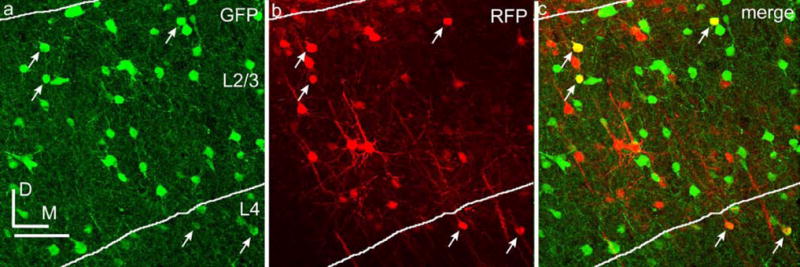
GAD67-GFP+ cells are shown in green (a), rAAV2/1-mCAMK-RFP+ cells are shown in red (b), and co-labeled cells are shown in yellow (c). Arrows indicate co-labeled inhibitory neurons. Dorsal (D) and medial (M) directions are indicated. Scale bar is 50 μm.
Discussion
Determining whether cell type specificity of gene expression following injections of viral vectors into the brain is conferred by transcriptional regulation by the promoter versus viral tropism, or a combination of both, requires a careful assessment of each factor. Specificity arising from a promoter can only be determined in viruses capable of infecting a broad range of cell types. Likewise, viral tropism can only be determined using a general purpose promoter. These two ideal situations are difficult to obtain, and in reality these two variables are at best minimally confounded.
In the studies described here, we attempted to assess the tropism of rAAV2/1 and VSV-G- LV in mouse somatosensory cortex by using putative general neuronal promoters, CAG and hSyn. The results indicate that these promoters are capable of driving gene expression in both excitatory and inhibitory neurons, but that the proportions of inhibitory/excitatory neurons expressing reporter depend on the titer of AAV and also differ between AAV and LV. High titer rAAV2/1-hSyn labels excitatory and inhibitory neurons in proportions consistent with their constituency. Yet, a dilution of the virus results in a shift away from excitatory neurons. In contrast, LV-hSyn at the highest titer that we could produce, fails to label large numbers of inhibitory neurons. Because these different vectors label different cell types even when using the same promoter (hSyn), we attribute these differences to differential tropism of viral vectors (AAV vs. LV). The most conservative interpretation of these results is that rAAV2/1 preferentially transduces inhibitory relative to excitatory mouse somatosensory cortical neurons, while VSV-G-pseudotyped LV efficiently transduces excitatory neurons, and that hSyn conveys no bias.
Nevertheless, other extreme possibilities cannot be entirely ruled out. For example, if hSyn conveys a bias towards excitatory neurons, then there might potentially be no bias conveyed by LV tropism. But if this were the case, then the tropism of AAV towards inhibitory neurons must be even stronger than was observed.
Importantly, following LV injections we sometimes observed fewer and less brightly labeled GAD67-GFP positive cells near injection centers. This suggested that the LV injections could have resulted in selective inhibitory cell damage or changes in gene expression. However, diminished NeuN antibody label suggests that these injections caused cell damage to both inhibitory and excitatory neurons. DAPI staining density appeared normal, suggesting glial cell encroachment to damaged regions. Enhanced by the activity of WPRE in LV, cell death might have resulted from exceedingly high levels of DsRed-Express (RFP) expression. More likely however, since many lowly expressing GFP cells resided in regions without any RFP expression, impurities in the LV preparation would more likely be the cause of cell death. In contrast to AAV purification with an iodixanol gradient, LV was prepared by pelleting centrifugation, which can concentrate impurities along with the virus. Another caveat is that impurities in the LV preparation could possibly influence LV tropism. Regions with obvious neuron damage or diminished gene expression, as assessed by diminished GFP or NeuN label, were not counted in the results. However, because we assessed inhibitory and excitatory distributions from GFP expression, the observed rates of RFP and GFP double-labeling could underestimate inhibitory neuron transduction in peripheral areas with less obvious impairment. While the effect is apparent in inhibitory neurons, we could not directly assess LV mediated effects on gene expression in the excitatory neuron population. If the effect is uniformly applicable to all neuron types, our results indicating LV bias towards excitatory neurons would be supported. On balance, the results suggest that tropism of LV towards excitatory neurons is likely, but these confounds prevent a definitive conclusion. Either way, caution is warranted when using LV to target cortical inhibitory neurons.
In addition to the differences in proportions of cell types expressing reporter with different vectors under transcriptional control from the same promoter, we also observed differences when using different promoters with the same vector (low titer AAV). Results were similar for CAG and hSyn promoters, except in cortical layer 5, where the 1:25 diluted AAV-hSyn resulted in a far higher proportion of inhibitory neurons expressing reporter (69%) than with AAV-CAG (36%). Informal observations of the morphology of the layer 5 excitatory neurons suggest that they are mostly tall-tufted pyramids (Larsen and Callaway, 2006), suggesting that the CAG promoter may generate a transcriptional bias towards expression in this particular cell type.
The mCAMK promoter was able to generate a far more clear, although incomplete, bias towards gene expression in excitatory cortical neurons, relative to results with hSyn in AAV of similar titer (see Fig. 3, AAV-hSyn 1:25 vs. AAV-mCAMK). Nevertheless, it is clear that this promoter in AAV did not restrict gene expression exclusively to excitatory neurons. The use of an AAV titer that biases transduction towards inhibitory neurons makes this fact far more apparent than it would be with LV, which appears to favor transduction (or survival) of excitatory neurons. Indeed, we used the same 1.3kb mCAMK promoter described in LV by Dittgen et al (2004). Dittgen et al (2004) observed that the mCAMK promoter restricted expression to cortical pyramidal neurons, identified by a characteristic apical dendrite and dendritic branching in layer 1, suggesting that the promoter was capable of generating a nearly exclusive bias towards excitatory neurons. Given the likelihood that both AAV and LV have strong and opposite biases towards transduction of inhibitory versus excitatory cortical neurons, the present results do not allow an accurate quantification of the extent of the transcriptional bias that is likely introduced by the mCAMK promoter. Nevertheless, our results suggest that some of the bias towards excitatory neurons observed by Dittgen et al (2004) could be due to LV tropism.
Tropism of rAAV2/1 can be due to both extra- and intra-cellular factors including receptor mediated viral entry, intracellular trafficking to the nucleus, virion uncoating, and conversion from single to double stranded DNA. Identifying any of these specific factors responsible for virus tropism may be difficult to determine due to the complexities involved in transduction, but surface receptor molecules can provide specific entry pathways. Sialic acid residues are abundant on the surface of cells, and variants of these residues are primary receptor sites for many viruses (Olofsson and Bergstrom, 2005). α-2,3 and α-2,6 sialic acids present on N-linked glycoproteins are primary receptors for both AAV1 and AAV6 cellular transduction (Wu et al., 2006b). However, additional receptors mediating cell-entry and/or differences in post-entry mechanisms are probable, since AAV6 has been shown to be more efficient than AAV1 for liver transduction (Grimm et al., 2003). The abundances of α-2,3 and α-2,6 sialic acids on excitatory and inhibitory neurons are not known, and may provide an explanation for the bias we observe.
Another explanation for differences in AAV and LV tropism are the compositions of the AAV and LV transgene constructs. The AAV ITR and LV LTR have inherent promoter activity, and may themselves contribute to biased transgene expression. In addition, our AAV constructs used a splice donor/acceptor sequence from human -globin (SD/SA)(Kaspar et al., 2002) and a bovine growth hormone poly (A) signal, elements not found in the LV construct. These elements might unequally affect transgene expression among neurons types.
Most viral tropism studies do not characterize transduction beyond tissue regions (brain, heart, etc) and general cell type classifications. The brain is a diverse cellular environment, and characterization of a virus or promoter must take into account cell type heterogeneities. Our results demonstrate tropism between neurons in mouse somatosensory cortex, but other brain areas and other species may not show the same differential tropism. We are not aware of previous reports on the transduction efficiencies of rAAVs in cortical neuron subtypes, but Haberman et al (Haberman et al., 2002) have illustrated how differing transgene expression in inhibitory and primary output neurons of rat inferior collicular cortex can alter the outcome of receptor based gene therapy. When using AAV to deliver antisense cDNA for the NMDA receptor 1, they found that reduction in seizure sensitivity differed as a result of the specificity of the promoter used. Haberman et al’s results illustrate the need to characterize viral activity at more detailed levels to determine the abilities of viruses and promoters to function in the necessary cell types. In other cases too, greater cell type specific expression of therapeutic agents will minimize potential interactions posed by undesired expression in other cell types.
An imbalance of excitatory and inhibitory activity in cortex is likely a cause of many epileptic events (Haberman et al., 2003, Richichi et al., 2004). Since lower titer rAAV2/1 biases expression towards inhibitory neurons in mouse somatosensory cortex, targeted expression predominately to these inhibitory neurons may not require cell type specific promoters. Also, since rAAV2/1 efficiently labels inhibitory neurons at low titers, we reason that rAAV2/1 may be a suitable vector for testing promoters for subtypes of cortical inhibitory neurons. In addition, LV may be well suited for determining if an inhibitory neuron cell type promoter is also active in excitatory neurons.
Acknowledgments
We thank Timothy Liu for his help with virus injections and tissue processing. This work was supported by the NIH Neuroplasticity of Aging Training Grant AG000216 (awarded to UCSD), Chapman Charitable Trust, Aginsky Research Scholarship, and NIH Grants DA011828 and MH063912 to EMC.
Comprehensive List of Abbreviations
- AAV
adeno-associated virus
- rAAV2/1
recombinant AAV with serotype 2 backbone packaged with serotype 1 capsid
- LV
lentivirus
- VSV-G- LV
lentivirus pseudotyped with vesicular stomatitis virus glycoprotein
- hSyn
human synapsin I promoter
- GFP
green fluorescent protein
- RFP
red fluorescent protein
- GAD67
glutamate decarboxylase 67
- mCAMK
mouse α-calcium/calmodulin-dependent protein kinase II promoter
- CAG
hybrid CMV/chicken β-actin promoter
- NeuN
neuronal nuclei antibody
Footnotes
Publisher's Disclaimer: This is a PDF file of an unedited manuscript that has been accepted for publication. As a service to our customers we are providing this early version of the manuscript. The manuscript will undergo copyediting, typesetting, and review of the resulting proof before it is published in its final citable form. Please note that during the production process errors may be discovered which could affect the content, and all legal disclaimers that apply to the journal pertain.
References
- Bowles DE, Rabinowitz JE, Samulski RJ. Marker rescue of adeno-associated virus (AAV) capsid mutants: a novel approach for chimeric AAV production. J Virol. 2003;77:423–432. doi: 10.1128/JVI.77.1.423-432.2003. [DOI] [PMC free article] [PubMed] [Google Scholar]
- Chen H, McCarty DM, Bruce AT, Suzuki K. Oligodendrocyte-specific gene expression in mouse brain: use of a myelin-forming cell type-specific promoter in an adeno-associated virus. J Neurosci Res. 1999;55:504–513. doi: 10.1002/(SICI)1097-4547(19990215)55:4<504::AID-JNR10>3.0.CO;2-0. [DOI] [PubMed] [Google Scholar]
- Choi VW, McCarty DM, Samulski RJ. AAV hybrid serotypes: improved vectors for gene delivery. Curr Gene Ther. 2005;5:299–310. doi: 10.2174/1566523054064968. [DOI] [PMC free article] [PubMed] [Google Scholar]
- Cucchiarini M, Ren XL, Perides G, Terwilliger EF. Selective gene expression in brain microglia mediated via adeno-associated virus type 2 and type 5 vectors. Gene Ther. 2003;10:657–667. doi: 10.1038/sj.gt.3301925. [DOI] [PubMed] [Google Scholar]
- Dittgen T, Nimmerjahn A, Komai S, Licznerski P, Waters J, Margrie TW, Helmchen F, Denk W, Brecht M, Osten P. Lentivirus-based genetic manipulations of cortical neurons and their optical and electrophysiological monitoring in vivo. Proc Natl Acad Sci U S A. 2004;101:18206–18211. doi: 10.1073/pnas.0407976101. [DOI] [PMC free article] [PubMed] [Google Scholar]
- Glover CP, Bienemann AS, Heywood DJ, Cosgrave AS, Uney JB. Adenoviral-mediated, high-level, cell-specific transgene expression: a SYN1-WPRE cassette mediates increased transgene expression with no loss of neuron specificity. Mol Ther. 2002;5:509–516. doi: 10.1006/mthe.2002.0588. [DOI] [PubMed] [Google Scholar]
- Grimm D, Zhou S, Nakai H, Thomas CE, Storm TA, Fuess S, Matsushita T, Allen J, Surosky R, Lochrie M, Meuse L, McClelland A, Colosi P, Kay MA. Preclinical in vivo evaluation of pseudotyped adeno-associated virus vectors for liver gene therapy. Blood. 2003;102:2412–2419. doi: 10.1182/blood-2003-02-0495. [DOI] [PubMed] [Google Scholar]
- Haberman R, Criswell H, Snowdy S, Ming Z, Breese G, Samulski R, McCown T. Therapeutic liabilities of in vivo viral vector tropism: adeno-associated virus vectors, NMDAR1 antisense, and focal seizure sensitivity. Mol Ther. 2002;6:495–500. doi: 10.1006/mthe.2002.0701. [DOI] [PMC free article] [PubMed] [Google Scholar]
- Haberman RP, Samulski RJ, McCown TJ. Attenuation of seizures and neuronal death by adeno-associated virus vector galanin expression and secretion. Nat Med. 2003;9:1076–1080. doi: 10.1038/nm901. [DOI] [PubMed] [Google Scholar]
- Hanks M, Wurst W, Anson-Cartwright L, Auerbach AB, Joyner AL. Rescue of the En-1 mutant phenotype by replacement of En-1 with En-2. Science. 1995;269:679–682. doi: 10.1126/science.7624797. [DOI] [PubMed] [Google Scholar]
- Heintz N. BAC to the future: the use of bac transgenic mice for neuroscience research. Nat Rev Neurosci. 2001;2:861–870. doi: 10.1038/35104049. [DOI] [PubMed] [Google Scholar]
- Hioki H, Kameda H, Nakamura H, Okunomiya T, Ohira K, Nakamura K, Kuroda M, Furuta T, Kaneko T. Efficient gene transduction of neurons by lentivirus with enhanced neuron-specific promoters. Gene Ther. 2007;14:872–882. doi: 10.1038/sj.gt.3302924. [DOI] [PubMed] [Google Scholar]
- Kaspar BK, Vissel B, Bengoechea T, Crone S, Randolph-Moore L, Muller R, Brandon EP, Schaffer D, Verma IM, Lee KF, Heinemann SF, Gage FH. Adeno-associated virus effectively mediates conditional gene modification in the brain. Proc Natl Acad Sci U S A. 2002;99:2320–2325. doi: 10.1073/pnas.042678699. [DOI] [PMC free article] [PubMed] [Google Scholar]
- Kugler S, Kilic E, Bahr M. Human synapsin 1 gene promoter confers highly neuron-specific long-term transgene expression from an adenoviral vector in the adult rat brain depending on the transduced area. Gene Ther. 2003a;10:337–347. doi: 10.1038/sj.gt.3301905. [DOI] [PubMed] [Google Scholar]
- Kugler S, Lingor P, Scholl U, Zolotukhin S, Bahr M. Differential transgene expression in brain cells in vivo and in vitro from AAV-2 vectors with small transcriptional control units. Virology. 2003b;311:89–95. doi: 10.1016/s0042-6822(03)00162-4. [DOI] [PubMed] [Google Scholar]
- Larsen DD, Callaway EM. Development of layer-specific axonal arborizations in mouse primary somatosensory cortex. J Comp Neurol. 2006;494:398–414. doi: 10.1002/cne.20754. [DOI] [PMC free article] [PubMed] [Google Scholar]
- Li W, Asokan A, Wu Z, Van Dyke T, Diprimio N, J SJ, Govindaswamy L, Agbandje-McKenna M, Leichtle S, Eugene Redmond D, Jr, McCown TJ, Petermann KB, Sharpless NE, Samulski RJ. Engineering and Selection of Shuffled AAV Genomes: A New Strategy for Producing Targeted Biological Nanoparticles. Mol Ther. 2008 doi: 10.1038/mt.2008.100. [DOI] [PubMed] [Google Scholar]
- Maheshri N, Koerber JT, Kaspar BK, Schaffer DV. Directed evolution of adeno-associated virus yields enhanced gene delivery vectors. Nat Biotechnol. 2006;24:198–204. doi: 10.1038/nbt1182. [DOI] [PubMed] [Google Scholar]
- Marr RA, Guan H, Rockenstein E, Kindy M, Gage FH, Verma I, Masliah E, Hersh LB. Neprilysin regulates amyloid Beta peptide levels. J Mol Neurosci. 2004;22:5–11. doi: 10.1385/JMN:22:1-2:5. [DOI] [PubMed] [Google Scholar]
- McCown TJ. Adeno-associated virus (AAV) vectors in the CNS. Curr Gene Ther. 2005;5:333–338. doi: 10.2174/1566523054064995. [DOI] [PubMed] [Google Scholar]
- Miao CH, Nakai H, Thompson AR, Storm TA, Chiu W, Snyder RO, Kay MA. Nonrandom transduction of recombinant adeno-associated virus vectors in mouse hepatocytes in vivo: cell cycling does not influence hepatocyte transduction. J Virol. 2000;74:3793–3803. doi: 10.1128/jvi.74.8.3793-3803.2000. [DOI] [PMC free article] [PubMed] [Google Scholar]
- Mikkelsen L, Sarrocco S, Lubeck M, Jensen DF. Expression of the red fluorescent protein DsRed-Express in filamentous ascomycete fungi. FEMS Microbiol Lett. 2003;223:135–139. doi: 10.1016/S0378-1097(03)00355-0. [DOI] [PubMed] [Google Scholar]
- Muller OJ, Kaul F, Weitzman MD, Pasqualini R, Arap W, Kleinschmidt JA, Trepel M. Random peptide libraries displayed on adeno-associated virus to select for targeted gene therapy vectors. Nat Biotechnol. 2003;21:1040–1046. doi: 10.1038/nbt856. [DOI] [PubMed] [Google Scholar]
- Naldini L, Blomer U, Gallay P, Ory D, Mulligan R, Gage FH, Verma IM, Trono D. In vivo gene delivery and stable transduction of nondividing cells by a lentiviral vector. Science. 1996;272:263–267. doi: 10.1126/science.272.5259.263. [DOI] [PubMed] [Google Scholar]
- Niwa H, Yamamura K, Miyazaki J. Efficient selection for high-expression transfectants with a novel eukaryotic vector. Gene. 1991;108:193–199. doi: 10.1016/0378-1119(91)90434-d. [DOI] [PubMed] [Google Scholar]
- Olofsson S, Bergstrom T. Glycoconjugate glycans as viral receptors. Ann Med. 2005;37:154–172. doi: 10.1080/07853890510007340. [DOI] [PubMed] [Google Scholar]
- Perabo L, Buning H, Kofler DM, Ried MU, Girod A, Wendtner CM, Enssle J, Hallek M. In vitro selection of viral vectors with modified tropism: the adeno-associated virus display. Mol Ther. 2003;8:151–157. doi: 10.1016/s1525-0016(03)00123-0. [DOI] [PubMed] [Google Scholar]
- Perabo L, Endell J, King S, Lux K, Goldnau D, Hallek M, Buning H. Combinatorial engineering of a gene therapy vector: directed evolution of adeno-associated virus. J Gene Med. 2006;8:155–162. doi: 10.1002/jgm.849. [DOI] [PubMed] [Google Scholar]
- Peterson DA, Lucidi-Phillipi CA, Murphy DP, Ray J, Gage FH. Fibroblast growth factor-2 protects entorhinal layer II glutamatergic neurons from axotomy-induced death. J Neurosci. 1996;16:886–898. doi: 10.1523/JNEUROSCI.16-03-00886.1996. [DOI] [PMC free article] [PubMed] [Google Scholar]
- Rabinowitz JE, Bowles DE, Faust SM, Ledford JG, Cunningham SE, Samulski RJ. Cross-dressing the virion: the transcapsidation of adeno-associated virus serotypes functionally defines subgroups. J Virol. 2004;78:4421–4432. doi: 10.1128/JVI.78.9.4421-4432.2004. [DOI] [PMC free article] [PubMed] [Google Scholar]
- Rabinowitz JE, Rolling F, Li C, Conrath H, Xiao W, Xiao X, Samulski RJ. Cross-packaging of a single adeno-associated virus (AAV) type 2 vector genome into multiple AAV serotypes enables transduction with broad specificity. J Virol. 2002;76:791–801. doi: 10.1128/JVI.76.2.791-801.2002. [DOI] [PMC free article] [PubMed] [Google Scholar]
- Ralph GS, Bienemann A, Harding TC, Hopton M, Henley J, Uney JB. Targeting of tetracycline-regulatable transgene expression specifically to neuronal and glial cell populations using adenoviral vectors. Neuroreport. 2000;11:2051–2055. doi: 10.1097/00001756-200006260-00048. [DOI] [PubMed] [Google Scholar]
- Richichi C, Lin EJ, Stefanin D, Colella D, Ravizza T, Grignaschi G, Veglianese P, Sperk G, During MJ, Vezzani A. Anticonvulsant and antiepileptogenic effects mediated by adeno-associated virus vector neuropeptide Y expression in the rat hippocampus. J Neurosci. 2004;24:3051–3059. doi: 10.1523/JNEUROSCI.4056-03.2004. [DOI] [PMC free article] [PubMed] [Google Scholar]
- Tamamaki N, Yanagawa Y, Tomioka R, Miyazaki J, Obata K, Kaneko T. Green fluorescent protein expression and colocalization with calretinin, parvalbumin, and somatostatin in the GAD67-GFP knock-in mouse. J Comp Neurol. 2003;467:60–79. doi: 10.1002/cne.10905. [DOI] [PubMed] [Google Scholar]
- Tiscornia G, Singer O, Verma IM. Production and purification of lentiviral vectors. Nat Protoc. 2006;1:241–245. doi: 10.1038/nprot.2006.37. [DOI] [PubMed] [Google Scholar]
- Van Vliet KM, Blouin V, Brument N, Agbandje-McKenna M, Snyder RO. The role of the adeno-associated virus capsid in gene transfer. Methods Mol Biol. 2008;437:51–91. doi: 10.1007/978-1-59745-210-6_2. [DOI] [PMC free article] [PubMed] [Google Scholar]
- Warrington KH, Jr, Gorbatyuk OS, Harrison JK, Opie SR, Zolotukhin S, Muzyczka N. Adeno-associated virus type 2 VP2 capsid protein is nonessential and can tolerate large peptide insertions at its N terminus. J Virol. 2004;78:6595–6609. doi: 10.1128/JVI.78.12.6595-6609.2004. [DOI] [PMC free article] [PubMed] [Google Scholar]
- Wu Z, Asokan A, Samulski RJ. Adeno-associated virus serotypes: vector toolkit for human gene therapy. Mol Ther. 2006a;14:316–327. doi: 10.1016/j.ymthe.2006.05.009. [DOI] [PubMed] [Google Scholar]
- Wu Z, Miller E, Agbandje-McKenna M, Samulski RJ. Alpha2,3 and alpha2,6 N-linked sialic acids facilitate efficient binding and transduction by adeno-associated virus types 1 and 6. J Virol. 2006b;80:9093–9103. doi: 10.1128/JVI.00895-06. [DOI] [PMC free article] [PubMed] [Google Scholar]
- Zheng C, Baum BJ. Evaluation of viral and mammalian promoters for use in gene delivery to salivary glands. Mol Ther. 2005;12:528–536. doi: 10.1016/j.ymthe.2005.03.008. [DOI] [PubMed] [Google Scholar]
- Zolotukhin S, Byrne BJ, Mason E, Zolotukhin I, Potter M, Chesnut K, Summerford C, Samulski RJ, Muzyczka N. Recombinant adeno-associated virus purification using novel methods improves infectious titer and yield. Gene Ther. 1999;6:973–985. doi: 10.1038/sj.gt.3300938. [DOI] [PubMed] [Google Scholar]