Abstract
Hemangiomas are vascular tumors that are angiogenesis-dependent. We previously showed that the transcription factor HoxA5, which is absent in activated, angiogenic endothelial cells (ECs), can block angiogenesis, and thus investigated whether restoring expression of HoxA5 blocks hemangioma growth in the mouse brain. We thus transplanted the murine hemangioma cell line EOMA or HoxA5 expressing EOMA cells into mice brain. Transplantation of EOMA cells into the mouse brain successfully induced brain hemangioma (BH) characterized by large, cyst-like spaces lined by thin walls of ECs surrounded by scant smooth muscle cell coverage. We also measured growth of vascular lesions and characterized the BH morphology. When EOMA cells expressing HoxA5 were injected, the volume of the lesions was reduced between 5 and 20-fold compared to the EOMA control group (p<0.05). Restoration of HoxA5 was associated with increased TSP-2, which inhibits angiogenesis and reduced HIF-1α expression. Our data suggest that restoring HoxA5 can attenuate experimental BH development.
Keywords: Angiogenesis, Brain, EOMA, Hemangioma, Homeobox A5, Mouse
INTRODUCTION
Hemangiomas are benign tumors of the vascular endothelium, which can be life-threatening when occurring near a vital structure or when causing intracranial hemorrhage (1). The pathogenesis of hemangiomas is unclear, although increased activities of angiogenic factors, including insulin-like growth factor 2 (2), Tie2 (3), VEGF and its receptors (4), integrins (5), and excessive remodeling of the extracellular matrix (5), have been linked to the disease. Studies on brain hemangiomas (BH) have been hampered by the lack of animal models that can recreate the human disease.
Angiogenesis, the outgrowth of new capillaries from preexisting vessels, involves EC proliferation, migration and reestablishment of new tubular structures. This is a complex process that involves spatially and temporally regulated changes in gene expression. We showed that the Homeobox (Hox) master transcriptional regulators play an important role in coordinating these changes in ECs during angiogenesis (6). We previously identified several class I Hox genes expressed in cultured EC, which can act to enhance or inhibit the angiogenic process. For example, HoxA3, D3 and B3 enhance angiogenesis by increasing EC migration, cell-extracellular matrix adhesion and morphogenesis, respectively (6-10). Indeed, we demonstrated that proliferating cutaneous hemangiomas express high levels of Hox D3 (11) and sustained expression of HoxD3 in embryonic chick membranes produced blood vessel malformations (large cavernous structures) reminiscent of hemangiomas (6).
More recently, we showed that another Hox gene, HoxA5, blocked angiogenesis and increased vascular stability. The anti-angiogenic activity of HoxA5 was associated with upregulation of the angiogenic inhibitor TSP-2, as well as a downregulation of pro-angiogenic genes such as Efna1, vascular endothelial growth factor (VEGF) receptor 2, and HIF-1α (12). TSP-2 belongs to a family of secreted multimeric extracellular glycoproteins that participate in cell-cell and cell-matrix interactions (13). TSP-2 null mice show higher blood vessel density and faster wound healing than normal mice (14), pointing to an anti-angiogenic role for TSP-2. HIF-1α is a transcription factor that is composed of α and β sub-units. In hypoxic conditions, HIF-1α is stabilized and transactivated to the nucleus where it stimulates target genes including VEGF (15, 16), one of the most important factors in the regulation of the development and differentiation of the vascular system. By acting as a capillary permeability-enhancing agent, VEGF also affects the integrity of the blood-brain barrier (17).
Interestingly, HoxA5, which is normally expressed in quiescent vessels, is absent from activated tumor vessels and in proliferating infantile hemangiomas, suggesting that loss of Hox A5 may permit vascular instability. We recently showed that the re-expression of HoxA5 in ECs derived from hemangiomas blocked the growth of cutaneous hemangiomas, stabilized adherens junctions, and reduced permeability of ECs (18), pointing to a central role of HoxA5 in coordinating a stable vascular phenotype.
The nervous system is more dependent than any other organ on a continuous supply of oxygen and nutrients, and hence is one of the most densely vascularized organs of the body. Synaptic activity and local blood flow and angiogenesis are exquisitely matched, both temporally and spatially, in order to meet the energy demands of activated neuronal populations. However, little effort has been devoted to understanding angiogenesis in the nervous system. Abnormal angiogenesis is involved in a number of neurological diseases such as arteriovenous malformations and cerebral cavernous malformations, among others (19). While specific gene defects underlying several of these disorders have been discovered, much more remains to be learned.
In an attempt to understand the pathobiology of BH, we investigated whether we can induce BH by injecting hemangioma-derived cell lines and subsequently determining whether restoring expression of the anti-angiogenic HoxA5 gene will impair BH formation. We infected a murine hemangioma cell line with a retroviral vector expressing HoxA5 and evaluated tumor growth and morphology relative to hemangioma cells lacking HoxA5. We also analyzed expression of established downstream targets of HoxA5, including TSP-2 and HIF-1α (12)
In this paper we present evidence that HoxA5 plays an important role in preventing hemangioma formation in the brain by upregulating the anti-angiogenic molecule TSP-2 and downregulating HIF-1α levels.
MATERIALS AND METHODS
Cell Culture
The murine hemangioendothelioma cell line (EOMA) CRL-2586™ was obtained from the American Type Culture Collection (ATCC, Manassas, VA). EOMA cells were maintained in Dubelco's Modified Eagle's Medium (DMEM) (Gibco, Carlsbad, CA), supplemented with 10% Fetal Bovine Serum (FBS) and 0.05 mg/ml gentamicin sulfate (Gibco).
Retroviral Vectors and Transduction
The pBABE-HA-HoxA5 retroviral vector was constructed and transduced as described in Rhoads et al (12). EOMA cells were transduced with control plasmid (pBabe) and pBabe HA-HoxA5, using 2 ml of virus-containing media in the presence of 8 μg/ml of polybrene (Sigma-Aldrich, St. Louis, MO) for 16 hours at 37°C. Twenty-four hours later, cells were selected in 1 μg/ml puromycin (Sigma-Aldrich) for 7 days, and the pooled cell population was used for subsequent experiments. Cells were used at passages 4 through 6.
RNA Isolation and Quantitative Real-time Polymerase Chain Reaction (PCR)
One μg of total RNA from transfected cells, extracted using the RNeasy isolation kit (Qiagen, Valencia, CA), was reverse-transcribed using MMuLVRT (Invitrogen, Carlsbad, CA) in a total volume of 25 μl. Quantitative real-time PCR was carried out in triplicate with a 10−20 fold dilution of first-strand cDNA using human HoxA5 and murine TSP-2 taqman probes, and primers purchased as Assays on Demand (Applied Biosystems, Foster City, CA). As a reference, we used β-glucuronidase or GUS. An ABI PRISM SDS 7000 (Applied Biosystems) was used according to the manufacturer's instructions with the following cycling protocol: one cycle at 50°C, 2 minutes; one cycle at 95°C, 10 minutes; 40 cycles at 95°C, 15 seconds; 50°C, 1 minute. Data were analyzed with an ABI Prism SDS 7000 companion software.
EOMA Cell Transplantation in the CD-1 Mouse Brain
EOMA cells were grown to 80% confluence in DMEM-10% FBS. Afterwards, they were trypsinized in 0.25% trypsin for 5 minutes at 37°C. Cells were then diluted with culture medium and centrifuged at 1200 rpm for 5 minutes at 4°C. The pellet was washed once with PBS and spun down again at 1200 rpm for 5 minutes at 4°C. Finally, EOMA and EOMA-HoxA5 cells were diluted with PBS to reach appropriate concentration for injection.
Eight-week old CD-1 male mice were anesthetized with 50mg/kg body weight ketamine and 10mg/kg body weight xylazine (Sigma Aldrich) intraperitoneally. Following induction of anesthesia, mice were placed in a stereotactic frame with a mouse hold (David Kopf Instruments, Tujunga, CA), and a burr hole was drilled to the pericranium 3 mm lateral to the sagittal suture and 1 mm posterior to the coronal suture. A 10 μl syringe (Hamilton Company, Reno, NV) was inserted into the burr hole 3 mm under the cortex. 5×10⁵ EOMA or EOMA-HoxA5 cells in a volume of 3 μl were injected stereotactically into the lateral caudoputamen at a rate of 0.2 μl/minutes. The needle was then withdrawn over the course of 5 min, the hole sealed with bone wax, and the wounds closed with suture. Animals were put back into their cages for recovery. After 1, 2 and 3 weeks, EOMA-control (n=6 for each time point) and EOMA-HoxA5 (n=6 for each time point) injected mice were sacrificed and brains were harvested for further analysis.
Hematoxylin and Eosin (H&E) and Immunofluorescence Staining
The mice were euthanized 1, 2, and 3 weeks after surgery respectively. They were perfused-fixated with 4% paraformaldehyde/phosphate-buffered saline solution. The brains were removed, dehydrated with graded alcohols, fixed in xylene, and finally embedded in paraffin blocks. The brain coronal sections were made at the thickness of 5μm for use. For H&E staining, sections were deparaffinized first in 3 changes 100% xylene for 5 minutes each, then hydrated through graded alcohol (100%, 95% and 70%, respectively; 5 min each), and rinsed in phosphate-buffered saline ready to use. We then followed standard H&E staining protocol.
Brain paraffin or frozen sections were incubated in 5% normal goat serum for 30 minutes before they were incubated in primary antibody diluted in 5% normal goat serum overnight at 4°C. Primary antibodies include rat anti-mouse CD31 (1:100 dilution, BD Pharmigen, San Jose, CA) and Licopersicum sculentum lectin (1:200, Vector Lab, Burlingame, CA) for endothelial cells, rabbit anti-mouse alpha-actin for smooth muscle cells (1:500 dilution, Santa Cruz Biotechnology, Santa Cruz, CA), anti-HIF-1α (1:100 dilution, Novus Biologicals) . The sections were incubated for one hour with either horseradish peroxidase conjugated anti-rat or -rabbit IgG (1:1000, Alexa 594 for red and Alexa 488 for green) (Invitrogen, Carlsbad, CA). Finally, slides were mounted and evaluated using a fluorescence microscope (Nikon Microphoto-SA, Melville, NY) with a filter cube (excitation filter, 450−490nm) for fluorescent isothiocyanate labeling and a filter cube (excitation filter, 515−560nm) for Texas-red. Photomicrographs for double-labeling illustrations were obtained by changing the filter cube without altering the position of the section or focus.
For quantification of the Hif1α positive cells, we chose three different sections for each mouse brain sample; the level of needle track, 0.5 mm before and 0.5 mm after the needle track, and the stained sections were taken from the corresponding levels from each brain. Three 40X images were randomly taken in the tumor area of each section. Samples were taken from at least 3 mice per group at each time point. For Hif1α positive cell quantification, the number of positive cells (red color) visible in each 40X field from each of 3 areas (a total of 3 mice per group at each time point) was counted blindly. Data are reported as the mean.
Tumor Volume Measurement
Two groups of mice (EOMA and HOXA5-treated EOMA) were sacrificed by decapitation 1 to 3 weeks following transplantation. The brains were removed and frozen immediately on dry ice for 5 minutes. Cryostat sections (20 μm thickness) distal from the frontal pole were cut and mounted on slides. The sections were dried and then stained following standard H&E staining protocol. With the use of NIH Image 1.63 software, a line was drawn around the imaged tumor on each section in order to measure the area. Total tumor volume was calculated by multiplying the tumor areas by the thickness of the sections.
Western Blot Analysis
Brain frozen tissue was resuspended in RIPA buffer, then sonicated and centrifuged at 1,200 rpm for 10 min at 4°C. Protein concentration was determined using the BCA protein assay reagent (Thermo Scientific, Rockford, IL). 40 μgs of protein from EOMA and EOMA HoxA5 tissues were separated in a 7% SDS-PAGE gel and transferred to PVDF membranes. After blocking for non-specific binding, the membrane was probed with a mouse anti-TSP-2 antibody (1:500) (BD Biosciences, San Jose, CA), followed by goat anti-mouse-HRP at 1:10000. Excess antibody was removed by extensive washing, and blots were developed by using ECL system (Amersham Biosciences, Piscataway, NJ). The membrane was then stripped and treated with a polyclonal β-actin antibody (1:1000 dilution, Abcam Inc., Cambridge, MA), followed by donkey anti-rabbit–HRP at 1:8000 dilution and detected by ECL system.
Statistical Analysis
All the experiments were performed at least 3 times. For Real-time PCR and Western blot analysis, we used a t-test for comparison. For tumor volume and average number of HIF-1 positive cells per field, we used a log transform to normalize the distribution. Data were analyzed using ANOVA (Statview 5.0) to examine tumor volume and average number of HIF-1 positive cells. There were two grouping variables: timing (one, two or three weeks after injection), and group (control or treated). Post hoc testing was performed using Fisher's PLSD. The data are presented as mean±standard deviation (SD); untransformed raw data are shown in the figures. A P value less than 0.05 was considered significant for the comparisons.
RESULTS
Structure and Morphology of EOMA-induced Brain Hemangiomas
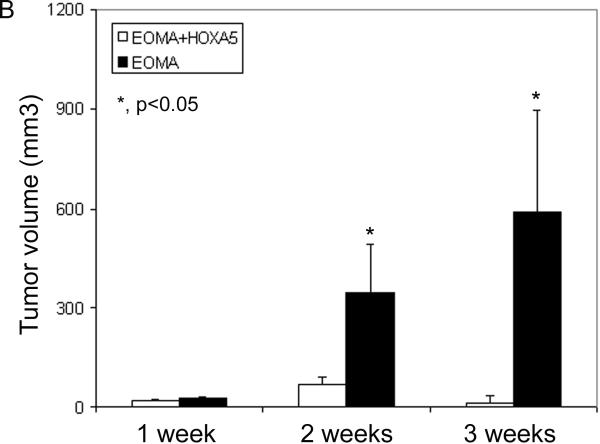
Previous work from our lab has shown that the anti-angiogenic HoxA5 gene was expressed in quiescent vessels, but its expression was markedly reduced in ECs in proliferative hemangiomas (12). Moreover, two murine hemangioma-derived cell lines, bEND-1 and EOMA, do not express HoxA5 (18). We thus decided to analyze the effect of Hox A5 expression in BH development. We used EOMA cells in our experiments because it has been shown that they form vascular lesions when injected subcutaneously into mice (20). 5×10⁵ EOMA or HoxA5 expressing EOMA cells were injected stereotactically into the lateral caudoputamen in CD-1 mice and evaluated their potential to form vascular lesions. Both HoxA5 transfected and control EOMA cells formed tumors which were composed of cords and cavernous blood filled cystic spaces (Fig. 1A). There was no grossly identifiable brain parenchyma contained within the border of the HoxA5 or control EOMA tumors. ANOVA showed that there was a significant effect on BH in both group (control vs. HoxA5, P=0.0001) and timing (P=0.0091) after injection. At 7, 14, and 21 days following injection, lesion size was assessed in these two groups (Fig. 1B). While there was no difference in lesion size between the two groups at day 7, by day 14 the lesion size in control EOMA-injected mice was 5 times larger as compared to the EOMA group expressing HoxA5 (P=0.0011). At day 21, the volume of the hemangiomas continued to increase in the EOMA group, while staying significantly reduced in the group receiving the HoxA5 expressing EOMA cells (P<0.0001) (Fig. 1B)
Figure 1.
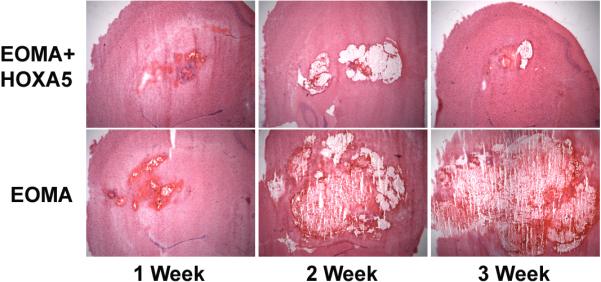
A) HoxA5 expression inhibits the growth of EOMA vascular lesions. HoxA5 (upper panels) or control transfected EOMA cells (lower panels) were stereotactically injected into the lateral caudo-putamen of adult CD1 mice and histologically examined 1, 2 and 3 weeks after injection. Photomicrographs show H&E staining of coronal sections at 1 (left side), 2 (middle) and 3 weeks (right side) following transplantation of EOMA+HoxA5 (upper panel) or EOMA cells (bottom panel) into the mouse brain. Tumors derived from HoxA5-expressing EOMA cells, were smaller than those induced by the control transfected EOMA cells. B) Bar graph shows the quantitation of the tumor volume in the EOMA+HoxA5 and EOMA groups at 1, 2, and 3 weeks after transplantation. Data are mean±SD, n=6 in each group. *p<0.05 for the difference between EOMA+HoxA5 vs. EOMA alone group for the same time point.
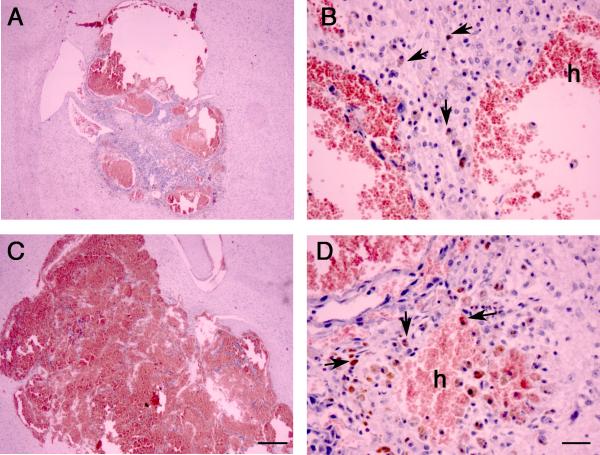
A more detailed analysis of the BH shown in Fig. 2A revealed that the pathology of the lesions is characterized by endothelial-lined channels with diameters larger than normal capillaries. The lumen of the cysts is often filled with blood and intravascular thrombosis. hese cystic spaces are prone to hemorrhage as demonstrated by the histological presence of extravascular hemorrhagic sites and hemosiderin-laden macrophages (Fig. 2A, panels B and D, arrows). The tumor cells were readily distinguishable form the parenchymal cells due to nuclear atypia and the tumor cells appear to form compact sheet-like proliferations and extended to line the walls of cystic blood filled spaces. Although we did not directly determine whether host brain tissue was incorporated into the lesions, in contrast to the control EOMA tumors, the smaller HoxA5 EOMA tumors had central solid areas which were composed mainly of enlarged cells with hyperchromatic nuclei, consistent with EOMA and not host neuroglial cells. Previous studies using transformed ECs lines engrafted into mice have shown that host ECs and leukocytes are often recruited to the growing lesions (21) and we observed that the walls of the lesions were comprised of tumor and cytologically typical ECs.
Figure 2.
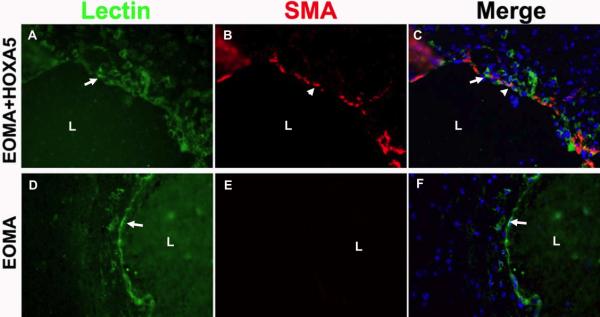
HoxA5 reduces hemorrhage and increases smooth muscle cell coverage. (A) Higher magnification of H&E staining of 3-week old lesions formed by HoxA5 (A and B) or control transfected EOMA (C and D) stereotactically injected into the lateral caudo-putamen of adult CD1 mice. The tumor edges showed acute hemorrhage (h) and chronic hemorrhage indicated by hemosiderin-laden macrophages (arrows). A,C bars=500um; B,D bar=25um. B) HoxA5 (A-C) and control transfected (D-F) EOMA cells were stereotactically injected into the caudate-putamen of adult CD1 mice and assessed by immunohistochemical staining after 14 days. Shown are photomicrographs of the edges of cavernous cystic blood-filled spaces triple labeled with FITC-lectin (A, D), Alexa 594 conjugated anti-α-SMA (B, E) and DAPI (blue in merged image C, F). Arrows point to the ECs (A, D) and arrowheads point to smooth muscle cells at the lumen (L) border. Bar=25 um.
To further analyze the BH, Licopersicum esculentum lectin immunostaining was performed to examine the EC layer. Most lectin positive cells were found in the wall of the tumor cavity, which correspond with the hemangioma structures observed in H&E staining (Fig. 2B, panels A and D) . Double labeling with anti-α-SMA demonstrated that a thin layer of smooth-muscle expressing cells were present underlying the endothelial cells of the cavernous spaces of HOXA5 EOMA tumors (Fig. 2B, panel B)- but, were only occasionally present underlying the cavernous vascular spaces of control EOMA tumors. (Fig. 2B, panel E). The number of smooth muscle cells is low compared to the number observed in normal brain vessels of the same caliber (data not shown here). The origin of the smooth muscle cells in the HOXA5 EOMA tumors appeared to be from medium-sized host cerebral vessels, since the highest concentration of α-SMA positive cells was found near peripheral morphologically normal cerebral vessels and the number of α-SMA positive cells tapered off with increasing distance from the “feeder” vessel.
HoxA5 Inhibition of Experimental BH is Accompanied by Increased TSP-2 and Reduced HIF-1α in the Lesions
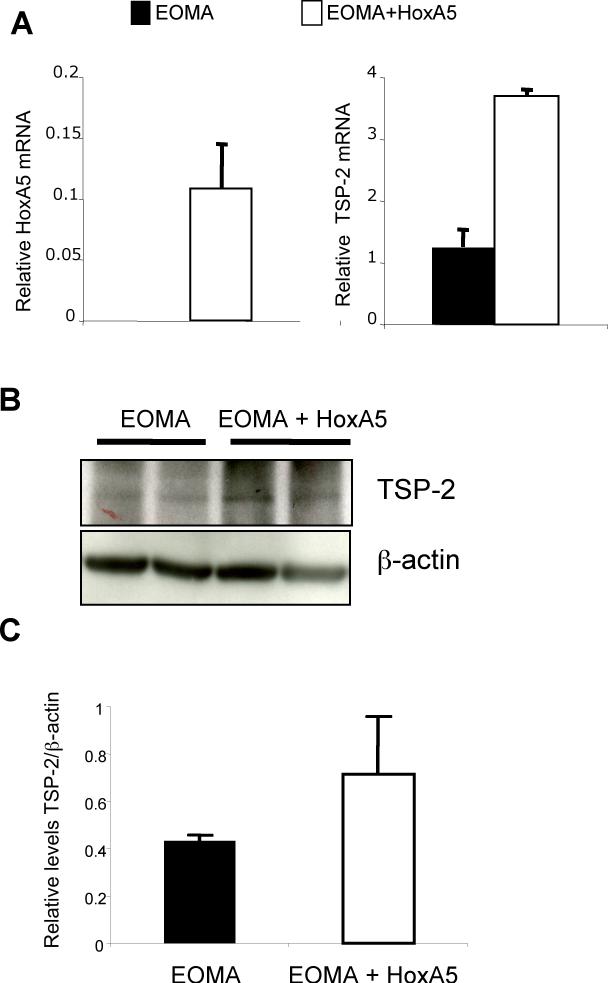
We previously showed that HoxA5 upregulates the anti-angiogenic TSP-2 gene and also downregulates HIF-1α mRNA (12). We therefore examined HoxA5 and TSP-2 mRNA levels in control EOMA cells and in EOMA cells transduced with a retrovirus expressing HoxA5. Concomitant with an increase in HoxA5 mRNA levels (Fig. 3A, left panel) we found an increase in TSP-2 mRNA, as detected by real-time PCR (Fig. 3A, right panel). Western blot analysis of BH samples at 7 days after cell injection showed a 2−3 fold increase in TSP-2 protein levels in HoxA5 expressing hemangiomas compared to the EOMA or control hemangiomas (Fig. 3B). In Fig. 3C we show a quantitative analyasis of TSP-2 levels in the HoxA5 expressing BH shown in Fig. 3B.
Figure 3.
HoxA5 increases expression of TSP-2 in BH. A) Real-time PCR showing levels of HoxA5 (left panel) and TSP-2 mRNA (right panel) in EOMA control or HoxA5-transfected EOMA cells. B) Western blot analysis shows the levels of TSP-2 protein in BH samples from mice injected with EOMA cells and HoxA5 expressing EOMA cells (upper panel). The same membrane was stripped and re-probed with β-actin to assess total protein loading. C) Quantitative analysis of relative TSP-2 levels in the Western blots for n=3 animals. p=0.109. The densitometric analysis was performed using the Image J program (rsb.info.nih.gov/ij/).
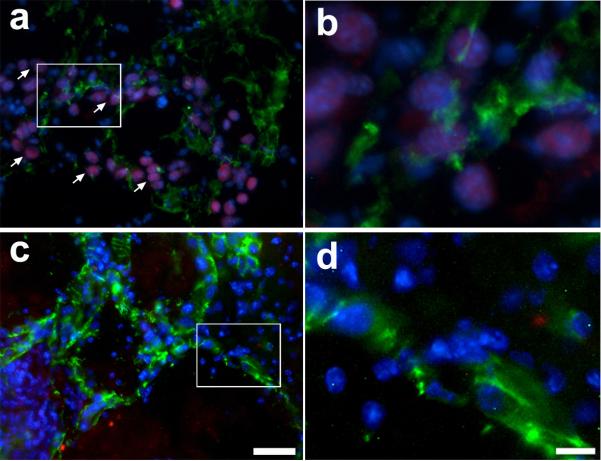
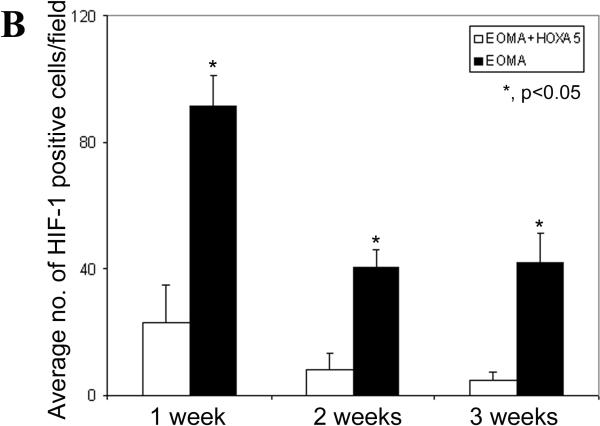
We also previously reported that HoxA5 could downregulate expression of VEGFR2 in dermal endothelial cells. Immunostaining analysis of EOMA or HoxA5-expressing EOMA cells injected into the brain, however, did not reveal any significant changes in VEGFR2 (data not shown here). In addition, we also performed immunostaining of frozen sections to identify the distribution and levels of expression of HIF-1α. Abundant HIF-1α expression was evident in the cell nuclei in BHs, as shown in red in Fig. 4A, panels a and b. In contrast, little HIF-1α was detected in the HoxA5-expressing EOMA group (Fig. 4A, panels c and d). Using ANOVA, we found a significant effect in both group (control vs. HoxA5, P<0.0001) and timing (P=0.0015) after injection. In Fig. 4B we show a quantitation of the HIF-1-α positive cells/field from samples at different time points after cell injection. The number of HIF-1α positive cells peaked at day 7 after injection of EOMA cells, whereas significantly lower but measurable levels of HIF-1α were detected in EOMA cells expressing HoxA5. HoxA5 treatment decreased HIF1α positive cell counts at one (P<0.0015), two (P<0.0006) and three (P<0.0001) weeks after injection.
Figure 4.
HoxA5 reduces HIF1α in BH. A) Photomicrographs show HIF-1α (red), CD31 (green) and dapi (blue) expression within the hemangioma-like lesion in the EOMA (a, b), or HoxA5-expressing EOMA cells (c, d) transplanted into the mouse brain after 2 weeks of injection. Arrows point to representative positive nuclei staining for HIF-1α. Scale bar (a, c) = 40 μm, (b, d) =10 μm. B) Bar graph shows the average number of HIF-1α positive cells counted per field per group at each time point. Data are mean±SD, n=6 in each group. *, p<0.05 for the difference between EOMA+HoxA5 vs. EOMA group for same time point.
DISCUSSION
Our data demonstrate that EOMA cells injected into the mouse brain reproducibly form vascular lesions resembling BH. The lumens of the cyst are often filled with blood and intravascular thrombosis. Furthermore, these vascular lesions are prone to hemorrhage as demonstrated by histological evidence of extravascular hemorrhage and hemosiderin-laden macrophages. The lesions are lined by endothelial cells with little smooth muscle cell coverage. Whether this represents immature vessels which have rapidly expanded and have not yet recruited smooth muscle or whether these cells have undergone additional changes that preclude recruitment of smooth muscle cells is not known. Nonetheless, when we restored expression of the anti-angiogenic HoxA5 gene in EOMA cells, the transfected EOMA cells generated significantly smaller lesions, and showed increased smooth muscle coverage, underscoring an important role for HoxA5 in inhibiting endothelial cell proliferation and stabilizing vascular structures in the cerebral environment. In a recent paper, we also reported blocking the growth of cutaneous hemangiomas in vivo by restoring expression of HoxA5 in murine hemangioma-derived ECs (18). The hemangiomas obtained after cutaneous injection of EOMA cells also produce lesions that also resemble the BH observed here, with both displaying large diameter channels lined by ECs that are filled with blood and are prone to hemorrhage. Thus, HoxA5 can exert this inhibitory effect in different microenvironments including the brain and the skin.
We also analyzed the expression of two known targets of HoxA5: HIF-1α and TSP-2. HIF-1α was expressed in response to hemangioma formation in the control group; however, it was markedly downregulated in the HoxA5-expressing EOMA group. Interest in HIF-1α as a possible trigger of angiogenesis associated with hemangioma lesions is based on its participation in tumor angiogenesis, stroke, and other conditions of hypoxic stress (22-25). During hypoxia, the HIF-1α sub-unit is stabilized, and its normal degradation is inhibited (22, 25). Increased levels of HIF-1α then promote expression of angiogenic factors, such as VEGF (26). In fact, high levels of VEGF in the rat myocardium may result in hemangioma formation (27). Our current data confirm that in the brain microenvironment, HIF-1α levels are reduced in the presence of HoxA5, and suggest that this reduction is an important component of the inhibitory effect of HoxA5. Another important mediator of HoxA5 effect is TSP-2. A crucial feature of the brain's vascular system that distinguishes it from other such systems is the blood-brain barrier. TSP-2 has been shown to be upregulated in cerebral ECs by 10-fold compared to aorta ECs from rats (28). Thus, it has been proposed that TSP-2 may be important to the maintenance of the blood-brain-barrier. In addition, TSP-2 expression has been linked to healing in ischemic brain injury models and reaches a plateau 7 days after ischemia, when vascular density has peaked and is declining towards the pre-ischemic level with the regression of newly formed vessels (29). In our BH model, we also observed a correlation between TSP-2 levels and inhibition of growth in the brain lesions.
The Hox gene products are highly conserved DNA binding proteins which act primarily as transcriptional factors serving to activate gene expression, but in certain cases also as repressors of gene expression (7). The Hox genes were initially discovered for their roles in morphogenesis and organogenesis during development, and more recently, they have been shown to be involved in adult tissue remodeling (30, 31). Investigation has shown that Hox genes can profoundly influence endothelial cell behavior and angiogenesis (6). Moreover, the Hox genes can directly influence the transcription of a number of ECM remodeling genes, including matrix-degrading proteinases, integrins, extracellular matrix components, growth factors, and other transcription factors (12, 31, 32).
We centered our studies on HoxA5, which has been shown to block angiogenesis (12). Recent studies show that this gene is highly expressed in quiescent endothelial cells. It seems feasible that HoxA5 may play a role in maintaining ECs in a quiescent state, and that an imbalance between pro-angiogenic Hox genes, including HoxD3 and the anti-angiogenic HoxA5 gene, may contribute to hemangioma formation. Together, our results further suggest that downregulation of HoxA5 in brain ECs may contribute to hemangioma formation. Furthermore, our EOMA-induced hemangioma model in the mouse brain in vivo is reproducible and feasible, and suggests that this model may provide a tool for further studies investigating brain vascular lesions.
ACKNOWLEDGMENTS
The authors thank Voltaire Gungab for editorial assistance and the staff of the Center for Cerebrovascular Research (http://avm.ucsf.edu/) for their collaborative support.
Sources of Funding:
These studies were supported by NIH grants P01 NS44145 (to WLY, GYY, NJB), R01 NS27713 (to WLY), and R21 NS50668 (to GYY)
REFERENCES
- 1.Marchuk DA. Pathogenesis of hemangioma. J Clin Invest. 2001;107:665–6. doi: 10.1172/JCI12470. [DOI] [PMC free article] [PubMed] [Google Scholar]
- 2.Ritter MR, Dorrell MI, Edmonds J, et al. Insulin-like growth factor 2 and potential regulators of hemangioma growth and involution identified by large-scale expression analysis. Proc Natl Acad Sci U S A. 2002;99:7455–60. doi: 10.1073/pnas.102185799. [DOI] [PMC free article] [PubMed] [Google Scholar]
- 3.Yu Y, Varughese J, Brown LF, et al. Increased Tie2 expression, enhanced response to angiopoietin-1, and dysregulated angiopoietin-2 expression in hemangioma-derived endothelial cells. Am J Pathol. 2001;159:2271–80. doi: 10.1016/S0002-9440(10)63077-5. [DOI] [PMC free article] [PubMed] [Google Scholar]
- 4.Muhlner U, Mohle-Steinlein U, Wizigmann-Voos S, et al. Formation of transformed endothelial cells in the absence of VEGFR-2/Flk-1 by Polyoma middle T oncogene. Oncogene. 1999;18:4200–10. doi: 10.1038/sj.onc.1203014. [DOI] [PubMed] [Google Scholar]
- 5.Boudreau NJ, Jones PL. Extracellular matrix and integrin signalling: the shape of things to come. Biochem J. 1999;339:481–8. [PMC free article] [PubMed] [Google Scholar]
- 6.Boudreau NJ, Andrews C, Srebrow A, et al. Induction of the angiogenic phenotype by Hox D3. J Cell Biol. 1997;139:257–64. doi: 10.1083/jcb.139.1.257. [DOI] [PMC free article] [PubMed] [Google Scholar]
- 7.Myers C, Charboneau A, Boudreau NJ. Homeobox B3 promotes capillary morphogenesis and angiogenesis. J Cell Biol. 2000;148:343–51. doi: 10.1083/jcb.148.2.343. [DOI] [PMC free article] [PubMed] [Google Scholar]
- 8.Boudreau NJ, Varner JA. The homeobox transcription factor Hox D3 promotes integrin alpha5beta1 expression and function during angiogenesis. J Biol Chem. 2004;279:4862–8. doi: 10.1074/jbc.M305190200. [DOI] [PubMed] [Google Scholar]
- 9.Chen Y, Xu B, Arderiu G, et al. Retroviral delivery of homeobox d3 gene induces cerebral angiogenesis in mice. J Cereb Blood Flow Metab. 2004;24:1280–7. doi: 10.1097/01.WCB.0000141770.09022.AB. [DOI] [PubMed] [Google Scholar]
- 10.Charboneau A, East L, Mulholland N, et al. Pbx1 is required for Hox D3-mediated angiogenesis. Angiogenesis. 2005;8:289–96. doi: 10.1007/s10456-005-9016-7. [DOI] [PubMed] [Google Scholar]
- 11.Hansen SL, Dosanjh A, Young DM, et al. Hemangiomas and homeobox gene expression. J Craniofac Surg. 2006;17:767–71. doi: 10.1097/00001665-200607000-00031. [DOI] [PubMed] [Google Scholar]
- 12.Rhoads K, Arderiu G, Charboneau A, et al. A role for Hox A5 in regulating angiogenesis and vascular patterning. Lymphat Res Biol. 2005;3:240–52. doi: 10.1089/lrb.2005.3.240. [DOI] [PubMed] [Google Scholar]
- 13.Adams JC. Thrombospondins: multifunctional regulators of cell interactions. Annu Rev Cell Dev Biol. 2001;17:25–51. doi: 10.1146/annurev.cellbio.17.1.25. [DOI] [PubMed] [Google Scholar]
- 14.Kyriakides TR, Tam JW, Bornstein P. Accelerated wound healing in mice with a disruption of the thrombospondin 2 gene. J Invest Dermatol. 1999;113:782–7. doi: 10.1046/j.1523-1747.1999.00755.x. [DOI] [PubMed] [Google Scholar]
- 15.Yamakawa M, Liu LX, Date T, et al. Hypoxia-inducible factor-1 mediates activation of cultured vascular endothelial cells by inducing multiple angiogenic factors. Circ Res. 2003;93:664–73. doi: 10.1161/01.RES.0000093984.48643.D7. [DOI] [PubMed] [Google Scholar]
- 16.Pugh CW, Ratcliffe PJ. Regulation of angiogenesis by hypoxia: role of the HIF system. Nat Med. 2003;9:677–84. doi: 10.1038/nm0603-677. [DOI] [PubMed] [Google Scholar]
- 17.Zhu Y, Lee C, Shen F, et al. Angiopoietin-2 facilitates vascular endothelial growth factor-induced angiogenesis in the mature mouse brain. Stroke. 2005;36:1533–7. doi: 10.1161/01.STR.0000170712.46106.2e. [DOI] [PubMed] [Google Scholar]
- 18.Arderiu G, Cuevas I, Chen A, et al. HoxA5 stabilizes adherens junctions via increased Akt1. Cell Adhesion and Migration. 2007;1:185–95. doi: 10.4161/cam.1.4.5448. [DOI] [PMC free article] [PubMed] [Google Scholar]
- 19.Zadeh G, Guha A. Angiogenesis in nervous system disorders. Neurosurgery. 2003;53:1362–74. doi: 10.1227/01.neu.0000093425.98136.31. discussion 74−6. [DOI] [PubMed] [Google Scholar]
- 20.Obeso J, Weber J, Auerbach R. A hemangioendothelioma-derived cell line: its use as a model for the study of endothelial cell biology. Lab Invest. 1990;63:259–69. [PubMed] [Google Scholar]
- 21.Garlanda C, Parravicini C, Sironi M, et al. Progressive growth in immunodeficient mice and host cell recruitment by mouse endothelial cells transformed by polyoma middle-sized T antigen: implications for the pathogenesis of opportunistic vascular tumors. Proc Natl Acad Sci U S A. 1994;91:7291–5. doi: 10.1073/pnas.91.15.7291. [DOI] [PMC free article] [PubMed] [Google Scholar]
- 22.Carmeliet P, Dor Y, Herbert JM, et al. Role of HIF-1alpha in hypoxia-mediated apoptosis, cell proliferation and tumour angiogenesis. Nature. 1998;394:485–90. doi: 10.1038/28867. [DOI] [PubMed] [Google Scholar]
- 23.Choi KS, Bae MK, Jeong JW, et al. Hypoxia-induced angiogenesis during carcinogenesis. J Biochem Mol Biol. 2003;36:120–7. doi: 10.5483/bmbrep.2003.36.1.120. [DOI] [PubMed] [Google Scholar]
- 24.Marti HJ, Bernaudin M, Bellail A, et al. Hypoxia-induced vascular endothelial growth factor expression precedes neovascularization after cerebral ischemia. Am J Pathol. 2000;156:965–76. doi: 10.1016/S0002-9440(10)64964-4. [DOI] [PMC free article] [PubMed] [Google Scholar]
- 25.Giaccia A, Siim BG, Johnson RS. HIF-1 as a target for drug development. Nat Rev Drug Discov. 2003;2:803–11. doi: 10.1038/nrd1199. [DOI] [PubMed] [Google Scholar]
- 26.Semenza GL. Expression of hypoxia-inducible factor 1: mechanisms and consequences. Biochem Pharmacol. 2000;59:47–53. doi: 10.1016/s0006-2952(99)00292-0. [DOI] [PubMed] [Google Scholar]
- 27.Lee RJ, Springer ML, Blanco-Bose WE, et al. VEGF gene delivery to myocardium: deleterious effects of unregulated expression. Circulation. 2000;102:898–901. doi: 10.1161/01.cir.102.8.898. [DOI] [PubMed] [Google Scholar]
- 28.Shibata T, Misawa N, Takeo C, et al. Analysis of genes dominantly expressed in rat cerebral endothelial cells using suppression subtractive hybridization. J Atheroscler Thromb. 2005;12:330–7. doi: 10.5551/jat.12.330. [DOI] [PubMed] [Google Scholar]
- 29.Lin TN, Kim GM, Chen JJ, et al. Differential regulation of thrombospondin-1 and thrombospondin-2 after focal cerebral ischemia/reperfusion. Stroke. 2003:34:177–86. doi: 10.1161/01.str.0000047100.84604.ba. [DOI] [PubMed] [Google Scholar]
- 30.Uyeno LA, Newman-Keagle JA, Cheung I, et al. Hox d3 expression in normal and impaired wound healing. J Surg Res. 2001;100:46–56. doi: 10.1006/jsre.2001.6174. [DOI] [PubMed] [Google Scholar]
- 31.Gorski DH, Walsh K. The role of homeobox genes in vascular remodeling and angiogenesis. Circ Res. 2000;87:865–72. doi: 10.1161/01.res.87.10.865. [DOI] [PubMed] [Google Scholar]
- 32.Myers C, Charboneau A, Cheung I, et al. Sustained expression of homeobox d10 inhibits angiogenesis. Am J Pathol. 2002;161:2099–109. doi: 10.1016/S0002-9440(10)64488-4. [DOI] [PMC free article] [PubMed] [Google Scholar]


