Abstract
High-density oligonucleotide microarrays were used to compare gene expression profiles from uncultured CD34+/CD38lo cells and culture derived megakaryocytes (MKs). As previously published, 3 replicate microarray data sets from 3 different sources of organ donor marrow were analyzed using the software program Rosetta Resolver® [1]. After setting a stringent p-value of ≤0.001 with a fold change cut-off of ≥3 in expression level, dynamin 3 (DNM3) was identified to be differentially expressed during the course of MK development with a mean fold-change of 8.2±2.1 (mean±S.D.). DNM3 is a member of a family of mechanochemical enzymes (DNM1, DNM2 & DNM3) known for their participation in membrane dynamics by hydrolyzing nucleotides to link cellular membranes to the actin cytoskeleton. Real-time qRT-PCR confirmed that DNM3 increased by 20.7±3.4-fold (n=4, p=0.09) during megakaryocytopoiesis and Western blot analysis showed that DNM3 protein was expressed in human MKs. Confocal microscopy revealed that DNM3 was distributed diffusely throughout the cytoplasm of MKs with a punctate appearance in pro-platelet processes. Immunogold electron microscopy also showed that DNM3 is widely distributed in the cytoplasm of MKs with no apparent localization to specific organelles. The open reading frame of DNM3 was cloned from cultured derived human MKs and determined to be 100% identical to the protein encoded by the DNM3 transcript variant ENST00000367731 published in the Ensemble database. Over expression of DNM3 in umbilical cord blood CD34+ cells resulted in an increase in total nucleated cells, an amplification of total colony forming cells (CFCs) and colony forming unit-megakaryoyctes (CFU-MKs), and a concomitant increase in the expression of NFE-2 and β1 tubulin. Together these findings provide the first evidence that a member of the dynamin family of mechanochemical enzymes is present in human MKs and indicate that DNM3 is an excellent candidate for playing an important role in mediating cytoskeleton and membrane changes that occur during MK/platelet development.
INTRODUCTION
The dynamins form a superfamily of proteins which can differentially localize to distinct cytoplasmic and membrane compartments where they participate in a number of membrane trafficking events [2]. Earlier work has suggested a role for dynamin in mediating microtubule sliding [3]. Subsequent studies have shown that the dynamins self-associate and hydrolyze nucleotides to link cellular membranes to the actin cytoskeleton [4, 5]. Given the demonstration of their association with microtubules and microfilaments, the dynamins have been implicated in a variety of cellular processes including: 1) development of organelles involved in cell motility (e.g. podosomes and invadopodia) [5, 6]; 2) membrane vesiculation from the plasma membrane and trans-Golgi network (e.g. endocytosis and secretion) [7–9]; 3) membrane extension and lamellipodial protrusion and phagocytosis [10]; and 4) cytokinesis [11].
The first dynamin protein was isolated in 1989, and three members of the dynamin family have since been described [3, 11–17]. Dynamin 1 (DNM1) is a neuronal specific isoform [12], dynamin 2 (DNM2) is ubiquitously expressed [13,14], and dynamin 3 (DNM3), localizes in testes, brain, and lung [15–18]. Additionally, a number of splice variants have been described for each of these genes [19].
Execution of the various membrane trafficking events is facilitated by the presence of four highly conserved domains found within the dynamins [20, 21]. An amino-terminal GTPase domain induces rotational activity in a GTP-hydrolysis-dependent reaction to produce longitudinal contractions that cause strand breakage [22]; a pleckstrin homology (PH) domain interacts with phosphatidylinositol lipids such as PI(4,5)P2 [23,24]; an alpha helical carboxyl-terminal GTPase effector domain (GED) modulates a rate-limiting step in membrane fission [25]; and a proline/arginine-rich domain (PRD) directly binds to Src homology 3 (SH3) domains of multiple actin associated proteins (e.g. cortactin FYN, LYN,) [2,26].
Located within the marrow, MKs are very large cells (40–100 µm diameter) with the capability of producing thousands of platelets [27]. To prepare for platelet release, a MK undergoes endomitosis during which DNA continues to replicate, in the absence of cytokinesis [28]. This results in cells with a single nucleus many times the normal complement of 46 chromosomes (i.e. 2N). These polyploid cells (typically 16N, 32N, 64N) undergo massive cellular enlargements to accommodate the number of platelets that will eventually be shed. Within the cytoplasm, a continuous network of specialized membranes, termed the demarcation membrane system, is established [31]. The cytoplasm is further organized to accommodate dense bodies, secretory vesicles and other platelet organelles (e.g. mitochondria and ribosomes). Long extensions originating from the demarcation membrane form branches and undergo evagination to form proplatelet processes [29, 30]. These cytoplasmic processes develop constrictions at irregular intervals along their length to form bridges between platelet like particles (32, 33).
Results from our microarray data led us to consider the possibility that the dynamins play a role in the membrane dynamics of developing MKs and platelets. In this study, we report that the dynamins are expressed in developing MKs and evidence is presented, which sheds new light on a possible role for DNM3 in MK development.
MATERIALS AND METHODS
Informed consent from the families of organ donors, all adult donors and pregnant mother’s eligible for donating umbilical cord blood (UCB) were obtained as per our Institutional Review Board.
Isolation of adult marrow CD34+ cells from tissue donors
Total nucleated cells (TNCs) (42.1±6.80×10⁹; mean±SEM) were isolated from organ donor vertebral bodies (Northwest Tissue Service at Puget Sound Blood Center (PSBC)) as previously described [34]. TNCs were applied to an Isolex 300SA column (Nexell, Irvine, CA) yielding 22.4±2.95×10⁷ CD34+ cells with purities of 87±3.4% (Fred Hutchinson Cancer Center, Seattle, WA). The enriched fraction of CD34+ cells was subsequently frozen and stored in 1 ml aliquots containing 5–10×106 cells per vial at −135°C in RPMI containing 10% dimethyl sulfoxide, 20% calf serum and 2mM L-glutamine (Invitrogen, Carlsbad, CA).
Isolation of marrow mononuclear cells from volunteer adult donors
Bone marrow was aspirated from the posterior iliac crest of adult donors. Approximately 40 ml of marrow was drawn into a syringe containing acid-citrate-dextrose (Sigma), 35 mM EDTA (Sigma), and 2 µg prostaglandin (Sigma). Between 108 and 109 mononuclear cells were isolated using a density gradient separation with Histopaque 1077 (Sigma-Aldrich, St. Louis, MO).
Isolation of umbilical cord blood CD34+ cells
Umbilical cord blood was collected into blood bags containing acid-citrate-dextrose/adenine (Citra Anticoagulant, Inc. Braintree, MA) and transported to PSBC for processing by using a modification of a previously published procedure [35]. Erythrocyte depletion was performed by adding 6% hetastarch (Abbott, Chicago, IL) and allowing the red cells to sediment by gravity. The resulting leukocyte enriched supernatant was expressed into an attached bag, centrifuged, and the leukocyte poor plasma was removed from the cell pellet. To reduce red cell contamination the cell pellet was treated with ACK lysis buffer (BioFluids, Rockville, MD). The cells were then washed twice with PBS containing 2% calf serum, centrifuged, and labeled with CD34 MicroBeads (Miltenyi Biotec, Inc., Auburn, CA). The labeled CD34+ cells were isolated using the autoMACs according to the manufacture’s instructions (Miltenyi Biotec, Inc., Auburn, CA).
Isolation of lineage committed hematopoietic cells
Culture derived human MKs were obtained from CD34+/CD38lo cells by first thawing a frozen aliquot of an enriched fraction of organ donor CD34+ cells. These cells were then co-stained with CD34 and CD38 antibodies conjugated to phycoerythrin (PE) and fluorescein isothiocyanate (FITC) (Becton Dickinson, San Jose, CA), respectively. Stained cells were sorted using a FACSVantage flow cytometer (Becton Dickinson) to obtain populations of CD34+/CD38lo cells with a purity >95%. Purified CD34+/CD38lo cells were then cultured in X-vivo 10 medium (BioWhittaker, Inc., Walkersville, MD) supplemented with IL-3 (0.005 ng/ml), IL-6 (10 ng/ml), stem cell factor (SCF) (10 ng/ml), and thrombopoietin (TPO) (50 ng/ml) (R&D Systems Inc., Minneapolis, MN) [36]. After 10 days at 37°C in a 5% CO2 humidified incubator, the culture derived MKs were harvested. Alternatively, culture derived MKs were obtained using UCB CD34+ cells as a starting population and culturing the cells as described for marrow CD34+/CD38lo cells.
Erythroid progenitors were isolated by incubating mononuclear cells obtained from volunteer donor marrow with 200 µl of a FITC conjugated anti-CD71 monoclonal antibody followed by anti-FITC magnetic microbeads (Miltenyi Biotec). The labeled cells were then isolated by positive selection on an LS+ column (Miltenyi Biotec) using a magnetic cell separation system according to the manufacturer’s instructions. Approximately 107 CD71+ cells were re-suspended in PBS at a concentration 106 cells/100µl. Immunostaining was performed by incubating the CD71+ enriched fraction with 20 µl of FITC-conjugated anti-CD71 and 5 µl of PE-conjugated anti-Glycophorin A for 20 minutes at 4 °C. Cells were washed with PBS containing 100 units/ml DNase (Sigma-Aldrich) and sorted on a FacsVantage flow cytometer (Becton Dickinson) to obtain a Glycophorin A bright(++)/CD71 bright (++) and a Glycophorin A intermediate (+−)/CD71 bright (++) subpopulation.
Myeloid and lymphoid populations were isolated from organ donor marrow by flow cytometry. Nucleated cells were stained with FITC-conjugated anti-CD45 plus PE-conjugated anti-CD14 to obtain myeloid cells or FITC-conjugated anti-CD45 and PE-conjugated anti-CD3 to isolate lymphoid cells.
Platelets were isolated from fresh whole blood provided by volunteer adult donors. Platelet concentrates were prepared by first centrifuging the whole blood for 10min at 200g. The platelet-rich plasma was removed and 0.5ml aliquots were transferred into eppendorf tubes containing 0.5 ml of Ringers citrate-dextrose, pH 6.5–6.7, centrifuged at 750g for 10min and the supernatant removed. After several washes with Ringers citrate-dextrose, pH 6.5–6.7, the platelet pellets were stored at −80°C.
Gene microarray assessment and analysis
Gene expression profiling of uncultured CD34+/CD38lo cells and culture derived megakaryocytes was performed as previously described[1]. Briefly, total RNA was isolated using an RNeasy Mini Kit (Qiagen Inc., Valencia, CA, USA). Biotin-labeled target cRNA was prepared from 8 µg of total RNA and hybridized to Human U95Av2, U133A, or U133B Affymetrix GeneChips® (Affymetrix Inc., Santa Clara, CA). Hybridized chips were washed and stained with streptavidin phycoerythrin and scanned at a wavelength of 570nm using an Affymetrix HP GeneArray™ Scanner (Santa Clara, CA). Gene expression image analysis was performed with Microarray Suite Version 5.0 (MAS 5.0) (Affymetrix). To identify significant differences in transcript levels ratio, comparisons between uncultured CD34+CD38lo cells and cultured derived MKs were performed using the Rosetta Resolver® Expression Data Analysis System (Rosetta Biosoftware, Kirkland, WA). Genes were categorized based on ontology using the web-based software program, GeneSifter.net (VizX Labs, Seattle, WA) (http://www.ncbi.nlm.nih.gov/LocusLink/).
Quantitative reverse transcriptase-polymerase chain reaction (qRT-PCR)
A DNM3 containing plasmid standard was constructed using the following primers: forward 5’- aat tcc gag ctc cta gca ca-3’, and reverse 5’- agg aag ccg cac aat gat ac-3’ (Ransom Hill Bioscience, Inc. Ramona, CA), to amplify a 250–300 base pair coding region of cDNA sequence for DNM3. The PCR product was then cloned into a plasmid vector, transformed into chemically competent cells, and positive clones were selected and sequenced to identify plasmid constructs with the correct insert.
Total RNA from each cell type was isolated using an RNeasy kit (Qiagen Inc.) and and cDNA was generated from total RNA using random hexamers and thermoscript-II reverse transcriptase (Thermoscript, Invitrogen). qRT-PCR analysis was then performed using the Roche® LightCycler (Roche Applied Systems, Indianapolis, Ind., USA) and kit reagents including Light-cycler–FastStart DNA Master SYBR® Green I (Roche Applied Systems). Primers were used at a concentration of 5 pM in a reaction volume of 20 µl containing 2 µl cDNA (0.4–1.0 µg). An external standard curve was generated using serial dilutions of the DNM3 containing plasmid standard with Tris-EDTA buffer containing 10µg/ml MS2 RNA carrier (Roche Applied Systems). The housekeeping genes glucose-6-phosphate dehydrogenase (G6PDH), beta2-microglobulin and porphobilinogen deaminase were used as internal standards. Copy number was calculated from the known size of the plasmid and the DNA concentration was determined by spectrophotometric measurement.
The thermocycling program parameters were as follows: 45 cycles of denaturation at 95°C for 10s, annealing at the optimized temperature for each reaction for 5s, extension at 72°C for 10s, and transitions at 20°C/s. Melting curves were generated by heating to 95°C, cooling to 65°C with a 15-second hold, and finally heating at 0.1°C/s to 95°C with continuous fluorescence acquisition. In each case, product identity was demonstrated by the presence of a single peak on derivative melting curve plots and a single band of the appropriate size when analyzed by electrophoresis on a 2% agarose gel.
Western blot analysis
Frozen cell pellets for MKs and platelets were lysed on ice for 10min with 50 µL of lysis buffer (50mM HEPES [N-(2-ydroxyethyl)piperazine-N’-(2- ethanesulfonic acid) pH 7.0, 150mM NaCl, 10% by volume glycerol, 1% by volume Triton X-100, 1.5 mM MgCl2, 1.0mM EGTA [ethylene glycerol tetraacetic acid], 100mM NaF, 10mM sodium pyrophosphate, 1.0mM phenylmethylsulfonyl fluoride, 1ug/ml aprotinin, 1ug/ml leupeptin, 1.0mM NaVO4). HeLA whole cell lysates were purchased from Abcam (Cambridge, MA). Lysates were stored frozen at −80°C until use. In preparation for gel electrophoresis, lysates were boiled in sodium dodecyl sulfate (SDS) at 95°C and 30µg of protein was loaded into each lane of an SDS/4–15% Tris-HCl polyacrylamide gel. After electrophoresis, proteins were transferred onto nitrocellulose membranes (Bio-Rad; Hercules, CA), and treated with Tris-buffered Saline containing 0.1% Tween-20 and 5% dry milk. Membranes were immunoblotted (Abcam; Cambridge, MA) using a primary rabbit antibody to DNM3 (Abcam) and secondary horseradish peroxidase conjugated goat anti-rabbit antibody (Bio-Rad). Visualization was conducted using a chemiluminescence reagent (PerkinElmer; Wellesley, MA).
Indirect immunofluorescence of human MKs and proplatelets
Umbilical cord blood CD34+ cells were cultured at a concentration of 1×10⁵ cells/ml of CellGro SCGM medium (ITK Cell Genix, Freiburg, Germany) supplemented with 100 ng/ml Tpo and 10 ng/ml IL1 (Strathmann, Hamburg, Germany). After 7 days at 37°C in a 5% CO2 humidified chamber, the progeny cells were diluted 1:2 with Cellgrow SCGM medium supplemented with 100 ng/ml IL6 (Strathmann, Hamburg, Germany) and 10 ng/ml IL1. Coverslips coated with fibronectin at ≥10µg/ml (Sanquin, Amsterdam, The Netherlands) were placed upright in 12-well culture plates; cells were then transferred to the fibronectin coated side of each coverslip and cultured at 37°C in a 5% CO2 humidified chamber. For 3 days, the cultures were monitored for pro-platelet formation.
Upon identification of pro-platelet processes, cells were fixed with 4% paraformaldehyde (Merck, Darmstadt, Germany) in phosphate buffered saline (PBS) (Invitrogen) and incubated at room temp for 10min. The paraformaldehyde was removed and 0.5% bovine serum albumin (BSA, fraction V) (Sigma-Aldrich) in PBS was added to each well and maintained overnight at 4°C. The next day, the coverslips were washed three times with PBS. The cells were permeabilized with 0.1% Triton X-100 (Sigma-Aldrich) for 1–2 minutes at room temperature, washed 3 times with PBS and then blocked with 0.5% BSA in PBS. Primary antibodies were diluted in PBS/BSA as follows: rabbit polyclonal DNM3 antibody was diluted 1:250 (Genetex, San Antonio, TX); and monoclonal anti-tubulin α/β, polyglutamylated antibody produced in mouse (Sigma-Aldrich) was diluted 1:500. Actin was stained with bodipy 650 conjugated phalloidin (Molecular Probes, Eugene OR) after diluting 1:200 and monoclonal mouse anti-CD41 (PeliCluster, Amsterdam, The Netherlands) was diluted 1:20. Antibodies were added to each slide and incubated at room temperature for 30–60 minutes. After rinsing three times with PBS, secondary antibodies Alexa Fluor 488 goat-anti-rabbit and Alexa Fluor 568 goat-anti-mouse (Invitrogen) in PBS/BSA at a dilution of 1:400 were added to the cells and incubated at room temperature for 30 min. The coverslips were rinsed 3–4 times with PBS and mounted with Mowiol (Calbiochem, San Diego, CA). Fluorescent imaging was performed with a confocal laser scanning microscope (Axiovert 100 M) using 40×/NA 1.40 and 63×/NA 1.40 oil lenses. Image acquisition was performed using LSM 510 software (Carl Zeiss Microlmaging, Inc., Jena, Germany).
Indirect immunofluorescence of murine MKs and proplatelets
Mouse megakaryocytes and proplatelets were grown in culture and attached to poly-L-lysine (Sigma-Aldrich) coated coverslips by centrifugation as previously described [38]. Cells were fixed in 4% formaldehyde in PBS for 20 minutes and washed briefly in PBS. Cells were permeabilized with 0.05% Triton X-100 for 20 minutes and briefly washed with PBS. Prior to antibody labeling, cells were incubated overnight at 4°C in blocking buffer (10% fetal bovine serum, 1% BSA (Roche Applied Systems), 0.05% sodium azide in PBS). Cells were labeled with anti-dynamin 3 rabbit polyclonal antibody (diluted 1:200 in blocking buffer) for 2hrs at room temperature followed by three washes in PBS. For double labeling, cells were then incubated in either anti-α and β-tubulin mouse monoclonal antibodies (Sigma-Aldrich) (1:1000 dilution in blocking buffer) anti-p-selectin rabbit polyclonal antibody (BD Biosciences) (1:500 dilution in blocking buffer) or anti-serotonin rat monoclonal antibody (Abcam) (1:50 dilution in blocking buffer) for one hour at room temperature followed by 3 washes in PBS. For secondary antibody labeling, cells were incubated in a 1:500 dilution of Alexa Fluor 488 conjugated rabbit IgG and Alexa 568 conjugated mouse IgG in blocking buffer for one hour at room temperature. Cells were washed three times in PBS and coverslips were mounted onto glass slides with Aqua/Poly Mount (Polysciences, Inc., Warrington, PA). For actin labeling, following incubation in anti-dyanmin 3 primary antibody and Alexa Fluor 488 conjugated rabbit IgG secondary antibody, cells were washed three times in PBS. Cells were then incubated in a 1:100 dilution of Alexa 568 conjugated phalloidin (Invitrogen) in PBS with 1% BSA for 30 minutes in the dark at room temperature. After a brief wash in PBS, coverslips were mounted onto glass slides with Aqua/Poly-Mount (Polysciences, Inc.)
Cells were imaged with a Nikon TE-200 60X (N.A. 1.4) DIC objective with a 1.5X optivar and captured with an Orca-II ER cooled CCD camera (Hammamatsu, Hammamatsu, Japan). Electronic shutters and image acquisition were under the control of Metamorph software (Universal Imaging Corporation of Molecular Devices, West Chester, PA).
Immunogold-electron microscopy
For preparation of cryosections, isolated mouse megakaryocytes were fixed with 4% paraformaldehyde in 0.1M Na Phosphate buffer, pH 7.4. After 2 hours of fixation at room temperature the cell pellets were washed with PBS containing 0.2M glycine to quench free aldehyde groups from the fixative. Prior to freezing in liquid nitrogen cell pellets were infiltrated with 2.3M sucrose in PBS for 15 min. Frozen samples were sectioned at −120°C, the sections were transferred to formvar-carbon coated copper grids (EM Sciences, Hatfield, PA) and floated on PBS until the immunogold labeling was carried out. The gold labeling was carried out at room temperature on a piece of parafilm. All antibodies and protein A gold (British Biocell International, Madison WI) were diluted with 1% BSA. The diluted antibody solution was centrifuged for 1 min at 14,000 rpm prior to labeling to avoid possible aggregates. All antibodies were used at a concentration of 1 ➃g/ml. Grids were floated on drops of 1% BSA for 10 min to block for nonspecific labeling, transferred to 5µl drops of primary antibody and incubated for 30 min. The grids were then washed in 4 drops of PBS for a total of 15 min, transferred to 5µl drops of Protein-A gold for 20 min, washed in 4 drops of PBS for 15 min and 6 drops of double distilled water. Contrasting/embedding of the labeled grids was carried out on ice in 0.3% uranyl acetete in 2% methyl cellulose for 10 min. Grids were picked up with metal loops, leaving a thin coat of methyl cellulose. The grids were examined in a Tecnai G2 Spirit BioTWIN transmission electron microscope and images were recorded with an AMT 2k CCD camera.
Cloning and sequencing of DNM3 from human culture derived MKs
Using a GenBank reference sequence for DNM3 (accession number NM_015569), primers were designed for amplification of the DNM3 open-reading frame: a 5’ PCR primer (5’-ATG GGG AAC CGG GAG ATG GAG-3”); a 3’ PCR primer (5’-TTA GTC TAA CAG GGA GGA TTC-3’); and a 3’ gene specific primer (5’-CTC ATG ATT AC TGC AAC GGT- 3’) against the downstream 3’UTR of DNM3 was designed for first-strand cDNA synthesis. These primers were used in an RT-PCR reaction (Invitrogen) to reverse transcribe and amplify total RNA template from culture derived human MKs. Forty cycles were conducted, using the following program: 95°C for 15 min, 94°C for 45 s, 62°C for 45 s and 72°C for 3 min, followed by a final extension at 72°C for 10 min. The PCR product, the open reading frame of DNM3, was cloned into a pCR T7/NT-TOPO vector (Invitrogen), and transformed into TOP10F’ chemically competent E. coli (Invitrogen). Colonies were picked and plasmid DNA was isolated using a MiniPrep Kit (Qiagen Inc.) for restriction analysis and sequencing.
Lentiviral vector construction, production and transduction
A lentiviral vector with a bicistronic cassette was constructed with the human DNM3 gene and the humanized R. reniformis green fluorescent protein (hrGFP II) reporter driven by the elongation factor 1-α(EF1-α) promoter. To generate this construct, a BamHI and EcoRI restriction digestion was performed to obtain a fragment containing the open reading frame of human DNM3 from the pCR T7/NT-TOPO vector. This fragment was subcloned into the Vitality® IRES-hrGFP II Mammalian Expression Vector (Stratagene, La Jolla, CA) to construct the bicistronic cassette expressing DNM3 and the hrGFP II reporter gene linked by an internal ribosome entry site (IRES). To excise the DNM3-IRES-hrGFP II (4.051kb) expression cassette, required a two-step partial digestion strategy using SpeI and BamHI, followed by a digestion using serial dilutions of XbaI. The isolated DNM3-IRES-hrGFP II (4.051kb) expression cassette was then subcloned into the BamHI and SpeI cite of lentiviral vector, pWPXL (kindly provided by the Trono Lab (http://tronolab.epfl.ch/page58115-en.html) by replacing the existing GFP gene. The control vector lacks the DNM3 gene and expresses only hrGFP II in the same way as the experimental vector.
Lentiviral particles were generated using a calcium phosphate-mediated three plasmid cotransfection of 293T cells (American Tissue Culture Collection, Manassas, VA) as follows [39,40]: 1) the transfer viral vector plasmid pLV-EF-1α-IRES-hrGFP II (control vector) or pLV-EF-1α-DNM3-IRES-hrGFP II (experimental vector); 2) the envelope plasmid pMD2G (Addgene, Cambridge, MA) and; 3) the 2nd generation packaging plasmid psPAX2 (Addgene). Twenty-four hours after transfection, the supernatants containing lentiviral particles were harvested three times sequentially at 12-hour incubation intervals. Upon collection, the supernatants were filtered through a 0.22µm low-protein-binding filter, concentrated by centrifugation at 7,200 × g for 19 hours at 4°C, resuspended in serum-free X-vvo 10 medium(BioWhittaker), aliquoted, and stored at −80°C. The titers of the concentrated lentiviral supernatants were determined by transducing HT1080 cells with serially diluted supernatants and determining by flow cytometry the percent of cells positive for GFP expression [39].
Prior to lentiviral transduction, human UCB CD34+ cells were seeded at 4×10⁴ cells/ml in flat-bottom 96-well non-treated tissue culture plates precoated with Retronectin (Takara Bio Inc., Shiga, Japan) and cultured overnight in serum-free X-vivo10 medium using the growth factor cocktail as previously described (1). At days 1, 2, and 3, the cells were infected with lentiviral supernatants at a multiplicity of infection (MOI) of 20. At day 4, an aliquot of cells was collected from both experimental and control groups to perform colony forming unit (CFU) and CFU-megakaryocyte (CFU-MK) assays according to the manufacturer’s instructions (Stemcell Technologies, Inc, Vancouver, Canada). The remainder of the cells was cultured for an additional 6 days for a total of 10 days. At the end of 10 days of culture the total number of nucleated cells (TNC) and the immunophenotype of the cells were determined using with PE-conjugated antibodies against CD34, CD41, CD42a, and CD61 (BD Biosciences, San Jose, CA).
RESULTS
Dynamin3 is differentially expressed in developing human MKs
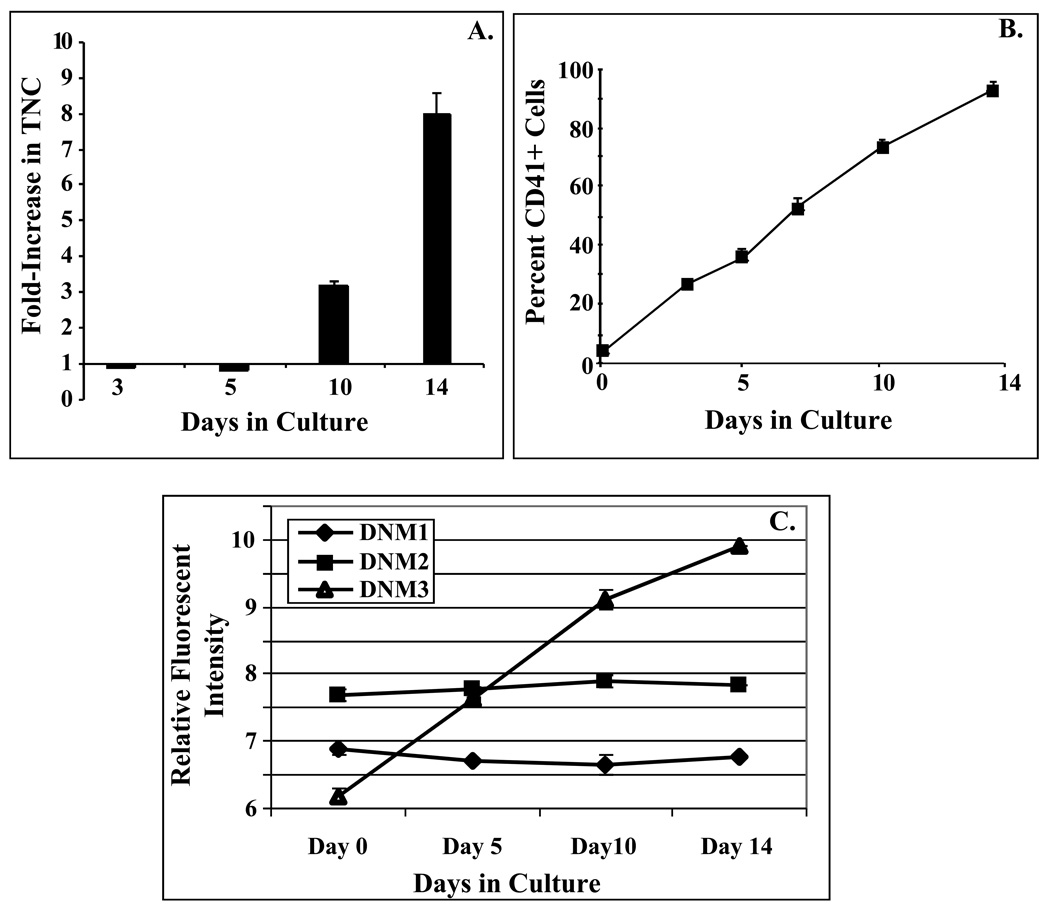
The degree of proliferation and lineage commitment that CD34+CD38lo precursor cells underwent when stimulated with a cytokine combination of IL3, IL6, SCF, and Tpo was monitored over a 14 day culture period. The results showed that after an initial decrease in the total number of nucleated cells (TNCs) that by day 14 of culture there was an 8±1 (mean±SEM; n=3) fold increase in TNC with >90% of the cells expressing the CD41 antigen (Fig. 1A&B).
Figure 1. DNM3 gene expression increases during megakaryocyte development.
Cultures were initiated with purified human CD34+/CD38lo cells and maintained in media supplemented with IL3, IL6, SCF and Tpo. A) Fold increase in total nucleated cells at 0, 3, 5 10 and 14 days of culture. B) Percent of total cells expressing the CD41 antigen at indicated time points C) Relative fluorescent intensities from a single experiment for dynamins 1, 2 and 3 as detected on Affymetrix Gene Chip U133A \. Transcript levels for all three dynamins were determined from uncultured CD34+/CD38lo cells (Day 0) and their progeny cells harvested on days 5, 10 and 14 of culture in serum deprived media supplemented with IL3, IL6, SCF, and Tpo.
Day 10 culture derived MKs were harvested and the gene expression profile of these cells were compared to uncultured CD34+/CD38lo cells (Day 0) [1]. Microarray expression analysis indicated that dynamin 3 (DNM3; GenBank reference sequence NM_015569) significantly increased by 8.2±2.1 fold (p<0.01; mean±S.D) during the course of MK development. No significant fold-changes were noted in the expression levels for two other members of the dynamin family, DNM1 (0.8±0.7) or DNM2 (1.2±0.2).
In a separate single microarray experiment, expression levels for all three dynamins were monitored simultaneously over a 14 day culture period at days 0, 5, 10 and 14. Results of this experiment showed that the relative fluorescent intensity for DNM3 continuously increased while expression levels for DNM1 and DNM2 remained essentially unchanged (Fig. 1C).
To confirm the results of the microarray data sets, real time quantitative RT-PCR (qRT-PCR) was used to assess newly amplified cDNA isolated from uncultured CD34+/CD38lo cells and Day 10 culture derived MKs. Results of the qRT-PCR assays were essentially consistent with those obtained from the microarray data. Although the results did not reach significance, the mean fold-change in expression level for DNM3 was 20.7±3.4-fold; (n=4, p=0.09). Mean fold-changes as measured by qRT-PCR for DNM1 and DNM2 were calculated as 2.7±1.7 (n=3; p=0.33) and 3.4±0.8 (n=4; p=0.07), respectively.
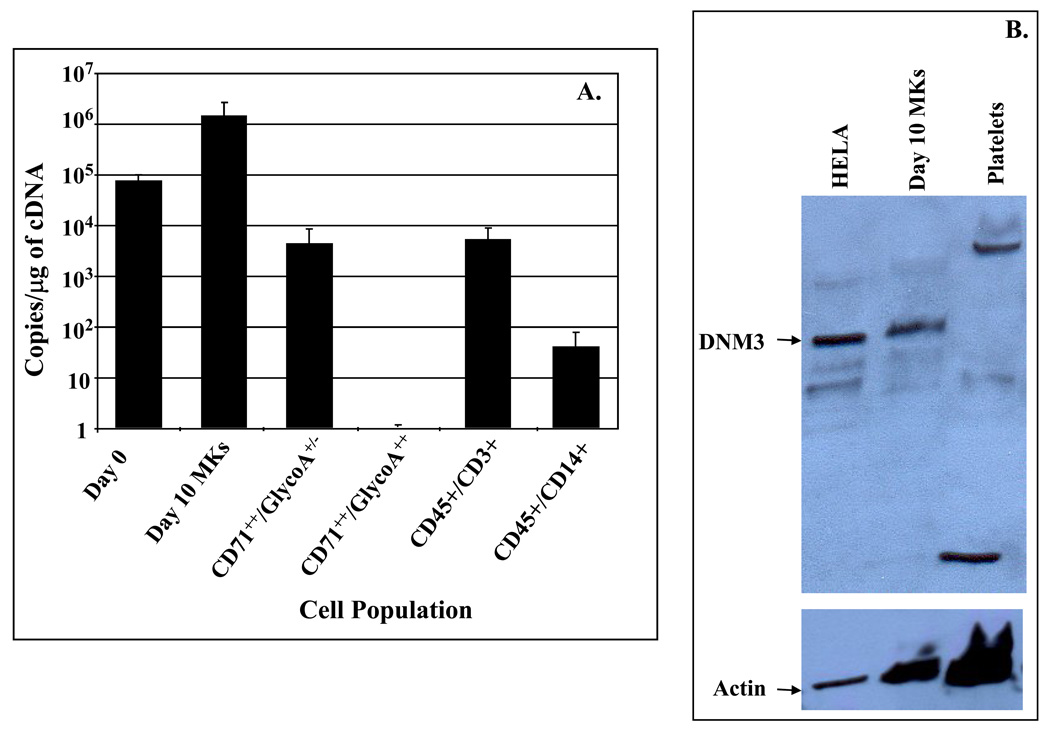
Expression levels for DNM3 in culture derived MKs were also examined by qRT-PCR relative to other hematopoietic cell lineages. The results showed that culture derived MKs exhibited the highest levels of DNM3 expression with an average of 1.29±0.98×10⁶ copies per µg of DNA (Fig.2A-). Erythroid progenitors with an immunophenotype of CD71++/GlycophorinA+/− cells expressed 5.7±2.2×10³ copies of DNM3/µg of DNA, whereas, DNM3 transcript levels were undetectable in erythroid progenitor populations with an immunophenotype of CD71++/GlycophorinA+/+ (Fig.2A). Lymphoid cells with a phenotype of CD45+/CD3+ expressed 4.7±3.2×10³ copies of DNM3/µg of DNA, which is ~270 times lower than the expression levels observed in culture derived MKs. Myeloid cells, which immunophenotyped as CD45+/CD14+, expressed DNM3 at less than 100 copies/µg of DNA (Fig. 2A).
Figure 2. Quantitative RT-PCR (qRT-PCR) and Western Blot analysis of DNM3.
A) Cell populations tested by qRT-PCR include: Day 0 (i.e. uncultured CD34+/CD38lo BM cells); Day 10 MKs (i.e. culture derived MKs generated from CD34+/CD38lo after 10 days of culture with IL3, IL6, SCF & Tpo); CD71++/GlycoA+/− and CD71++/GlycoA+/− (i.e. isolated from volunteer donor marrow mononuclear fractions); and CD45+/CD3+, and CD45+/CD14+ cells (i.e. isolated from organ donor marrow);. Data are shown as mean±SD. B)Western Blot analysis was performed on Day 10 culture derived human MKs produced from umbilical cord blood CD34+ cells cultured for 10 days in media supplemented with IL3, IL6, SCF and Tpo. After 10 days of culture, the cells were harvested and stained with anti-CD41-PE. The stained cells were sorted by flow cytometry to obtain purified MKs, which were used to prepare protein lysates. Platelets were obtained from human peripheral blood. HeLa cell lysates were purchased and used as a positive control.
Protein expression for DNM3 was detected in culture derived MKs when assessed by Western blot analysis (Fig.2B). However, DNM3 was not detected by immunoblot analysis in peripheral blood platelets (Fig. 4). HeLa cells, which were used as a positive control, also showed a band for DNM3.
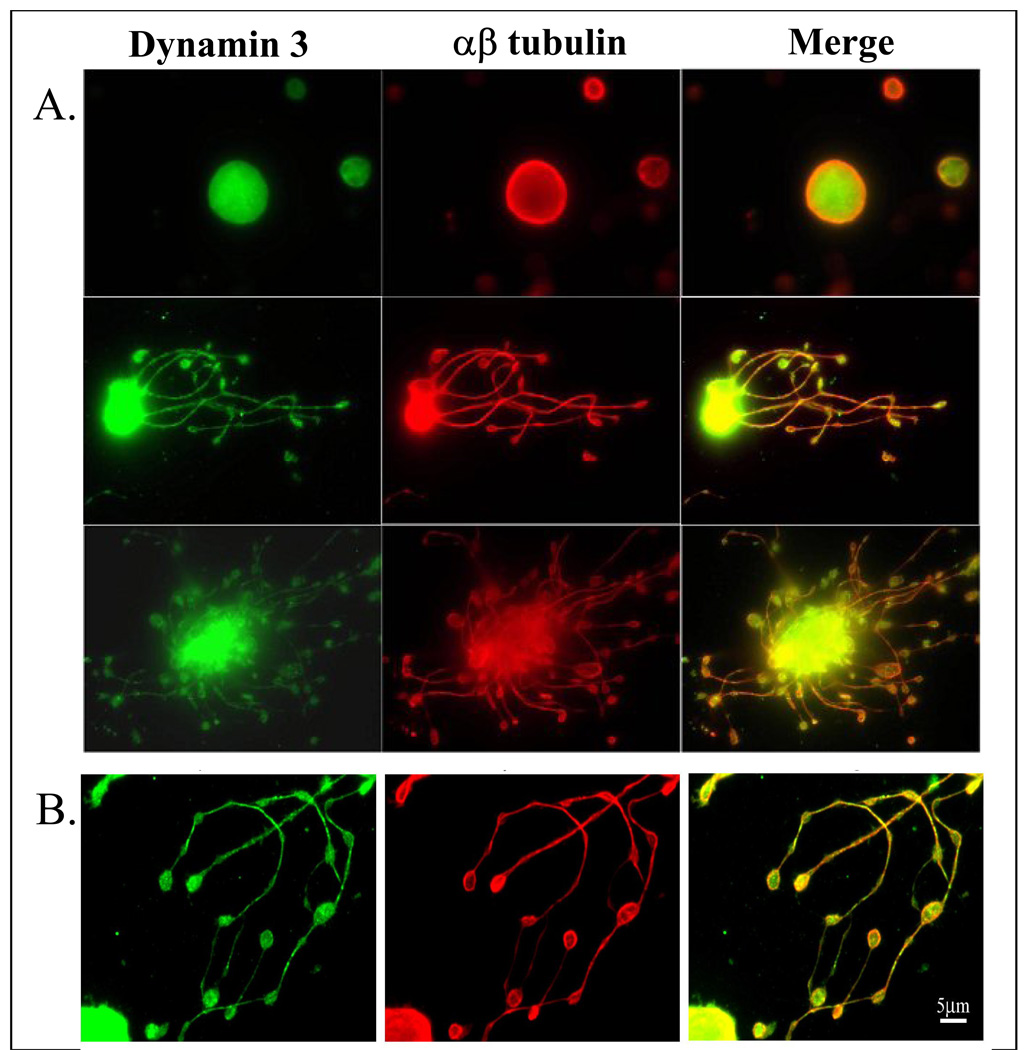
Figure 4. Representative immunofluorescent confocal micrographs showing the distribution of DNM3 relative to αβtubulin in a murine MK displaying proplatelet processes. Magnifications: A) 90x; B) 150x.
Localization of dynamin 3 in MKs and pro-platelets
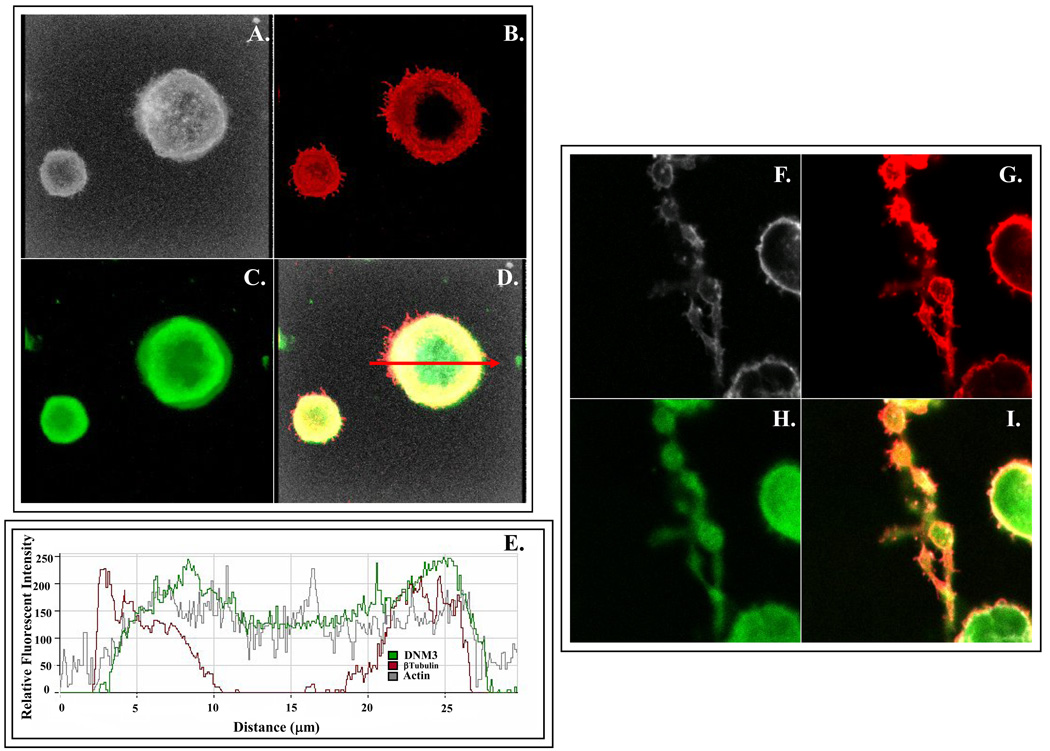
To begin to elucidate the function of DNM3 during megakaryocytopoiesis, we first examined its subcellular location in MKs and pro-platelet processes. The spatial relationship of DNM3 to the cytoskeleton was examined by co-labeling DNM3, actin and α/β tubulin in human culture derived MKs and pro-platelet processes (Fig. 3). Confocal imaging revealed that DNM3 was distributed diffusely throughout the MK cytoplasm without any apparent association with recognized structures (Fig. 3A–D). Actin also appeared to be diffusely distributed throughout the cytoplasm, but α/βtubulin staining localized to the periphery of MKs. A graphical assessment of a stained human MK as shown in figure 3E revealed that the distribution of DNM3 was more closely superimposed with actin than with α/β tubulin.
Figure 3. Representative immunofluorescent confocal micrographs showing the distribution of DNM3 relative to tubulin α/β and actin in representative culture derived human MKs and MKs displaying proplatelet processes produced from human UCB CD34+ cell.
(A–D) Staining patterns in a culture derived human MK produced from umbilical cord blood CD34+ cells. Shown separately in panels are: A) Bodipy-phalloidin (white), B.) anti-DNM3 (green) and C) anti-tubulin (red). D) Merge of actin, DNM3 and tubulin staining. Arrow represents the cross-sectional region that was scanned to obtain the histogram in 3E, which graphically profiles actin (gray line) DNM3 (green line) and tubulin (red line). (F–I) Representative proplatelet processes stained with the following: F) Bodipy phalloidin (white), G.) anti-DNM3 (green) and H) anti-tubulin (red). I) Merge of actin, DNM3 and tubulin staining.
In human derived proplatelet processes, DNM3 labeling also presented as a diffuse pattern (Fig. 3H) and α/β tubulin staining continued to remain predominately localized to the periphery (Fig. 3G). However, actin labeling did not show the same diffuse appearance that was evident for MKs (Fig 3A), but rather localized to the periphery of both the tubular and bulbous ends of the proplatelet formations (Fig. 3F).
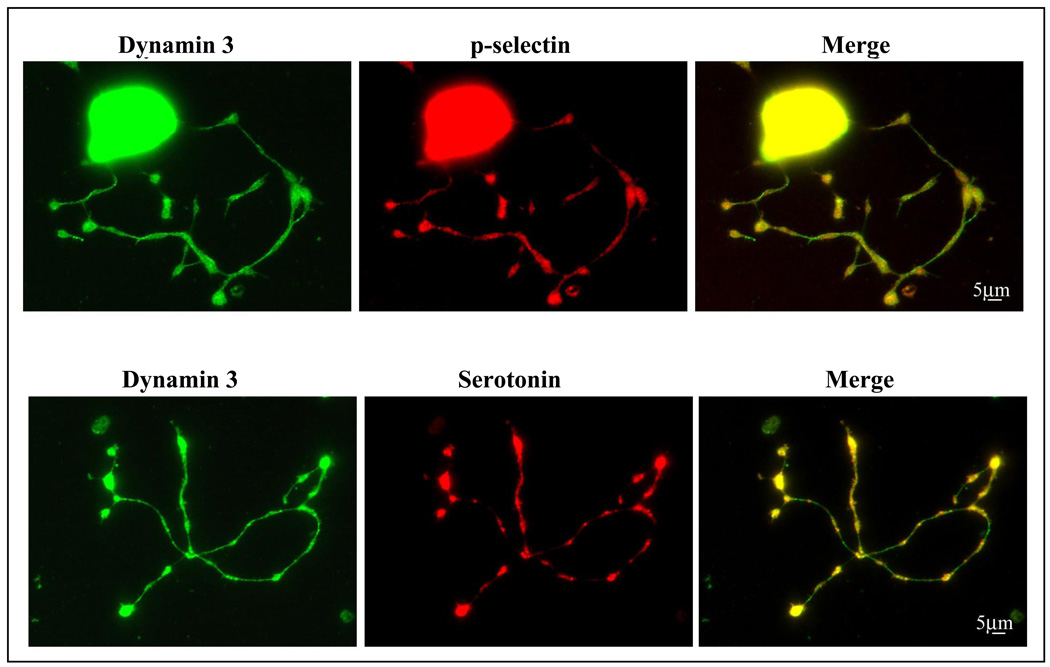
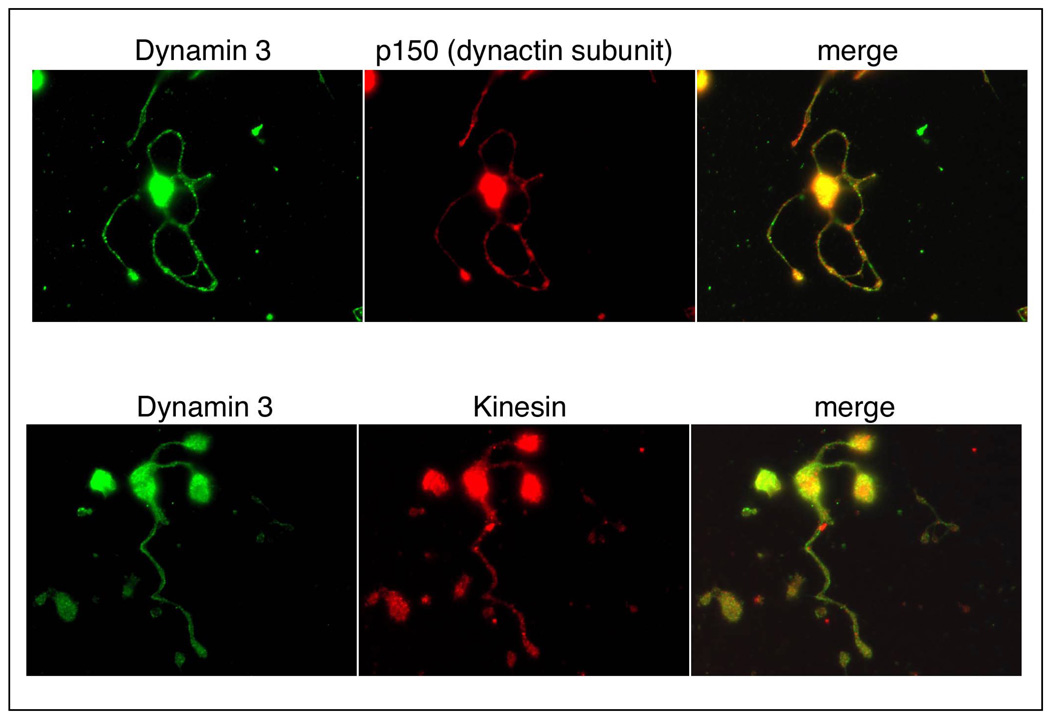
DNM3 protein expression was next assessed in murine MKs and proplatelets. As was noted for human MKs, a diffuse pattern of expression for DNM3 was observed in murine MKs. Also, proplatelet processes extending from murine MKs showed a diffuse cytoplasmic background staining pattern similar to that observed in human proplatelet processes. However, in murine proplatelet processes a punctate fluorescence pattern was evident for DNM3 suggesting a possible localization to organelles (Fig. 4A &B). Staining for αβ tubulin was distributed throughout murine MKs, and as was observed for human MKs and pro-platelet processes there was an apparent prevalence of αβ tubulin staining along the periphery of murine MKs as well as at the terminal bulbous ends of some murine pro-platelet formations (Fig. 4). Actin staining in murine as in human MKs was throughout the cell (data not shown). Although a punctate pattern of labeling was observed with DNM3 in murine proplatelet processes, staining for p-selectin and serotonin did not definitively co-localize DNM3 with either alpha or dense granules, respectively (Fig. 5). Nor was there any apparent co-localization of DNM3 with other motor proteins such as with the p150 dynactin subunit of dynein or kinesin (Fig. 6).
Figure 5. Representative immunofluorescent confocal micrographs showing the distribution of DNM3 relative to the expression of p-selectin and serotonin. Magnification 90X.
Figure 6. Representative immunofluorescent confocal micrographs showing the distribution of DNM3 relative to the motor proteins dynactin and kinesin. Magnification 90X.
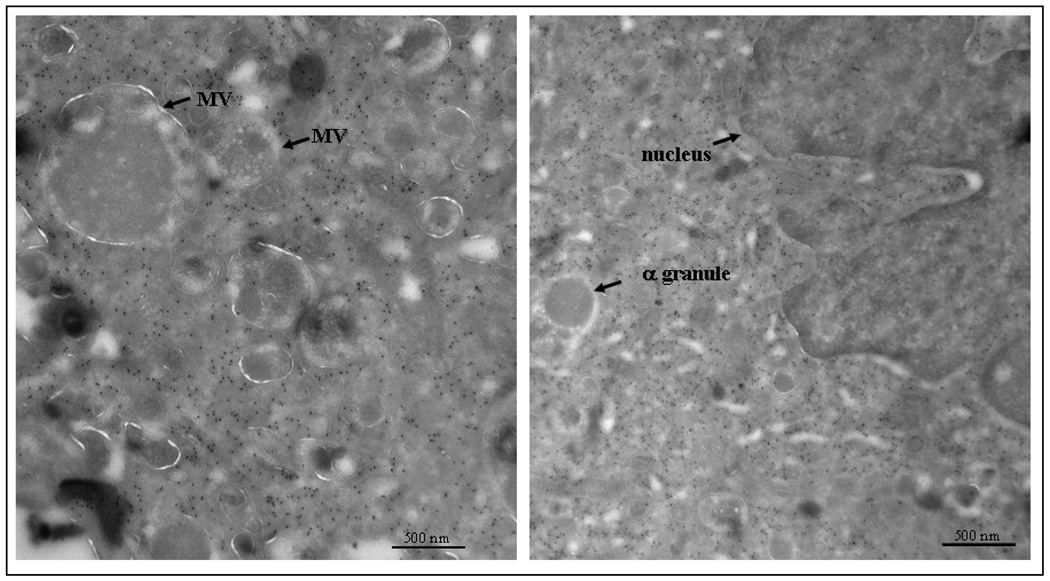
The precise pattern of DNM3 localization was ultrastructurally examined using transmission electron microscopy to visualize DNM3 immunogold labeling in murine MKs. The staining pattern shows that DNM3 is widely distributed throughout the MK cytoplasm with no apparent localization to organelles (Fig. 7). Multivesicular bodies and alpha granules appear to be devoid of DNM3. While the staining pattern around the nucleus for DNM3 is apparently more intense than within the nucleus.
Figure 7. Transmission electron micrograph showing DNM3 immunogold labeling in a murine megakaryocyte.
Cloning and sequencing of DNM3 from human culture derived MKs
To identify and confirm the sequence of the DNM3 transcript expressed in human MKs, the open reading frame for DNM3 was PCR-amplified from culture derived human MKs and cloned. A BLAST search of the cloned fragment showed that it matched with 99% identity to 1 of 6 DNM3 transcript variants listed in the Ensemble database (transcript: ENST00000367731). A computer translation of all possible amino acid sequences for the cloned product indicated that the protein sequence was 100% identical to the protein encoded by DNM3 transcript variant ENST00000367731.
Overexpression of DNM3 amplifies MK progenitors
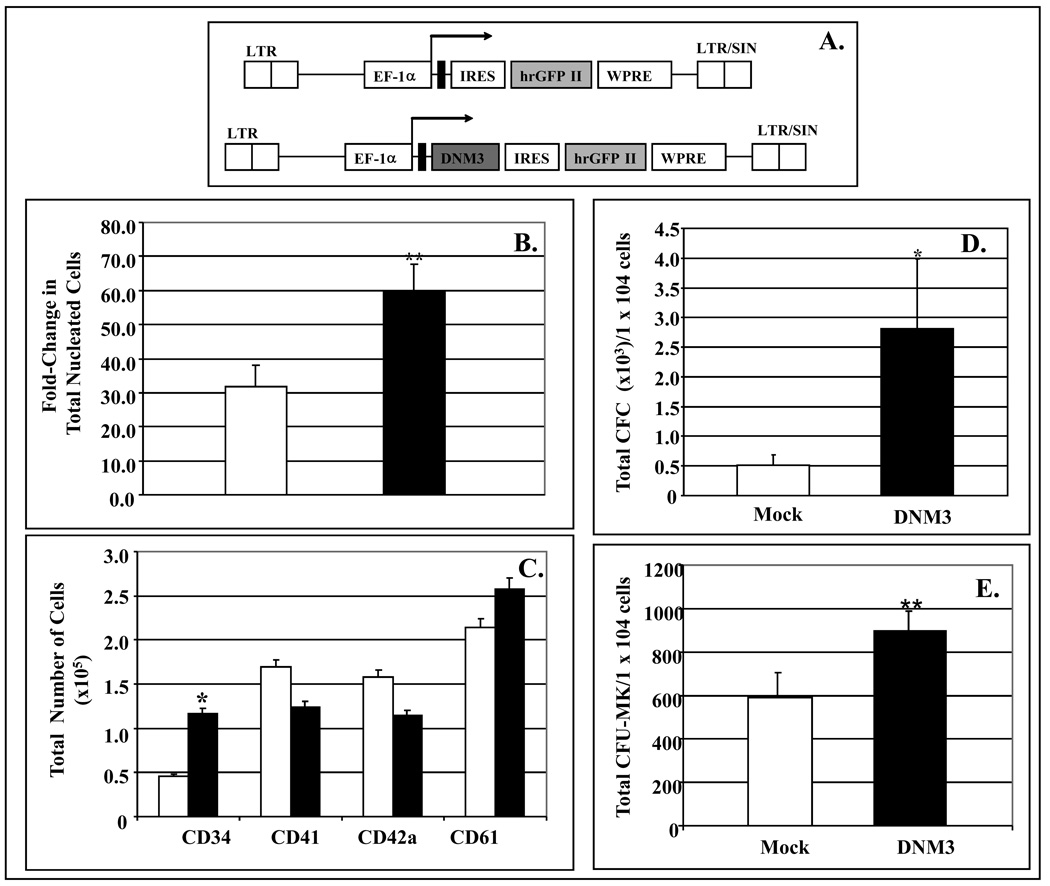
Following an overnight culture with the growth factor cocktail 36ST, human UCB CD34+ cells were infected on days 1, 2, and 3 of culture with either the lentiviral construct containing DNM3, pLV-DNM3-IRES-hrGFP, or mock infected with pLV-IRES-hrGFP (Fig. 8A). Using this infection strategy, we were able to detect at an MOI of 20 that between 30–50% of cells expressed GFP (Data not shown) After culturing for 10 days, the fold-increase in total nucleated cells produced was significantly greater in the DNM3 infected cultures (59.70±7.96) than in the mock infected cell cultures (31.73±6.46) (Fig. 8B). Immunophenotyping showed that a significantly greater number of CD34+ cells were present in cultures overexpressing DNM3 than in mock infected cultures (Fig. 8C). No significant difference in the number of cells expressing CD41, CD42a and CD61 was noted between infected and mock infected populations. Finally, there were significantly greater numbers of CFC and CFU-MK colonies present in cultures overexpressing DNM3 than in control cultures (Fig. 8D&E).
Figure 8. Response of umbilical cord blood CD34+ cells infected with a lentiviral vector expressing DNM3.
UCB CD34+ cells were infected with control vector (white bars) or test vector to overexpress DNM3 (black bars). A) Diagram of the control lentiviral vector, pLV-EF-1α-IRES-hrGFP II and the DNM3 vector pLV-EF-1α-DNM3-IRES-hrGFP II. The elongation factor 1-alfa promoter (EF-1α) was used to drive expression of the hrGFP II in the control vector and DNM3 in the experimental vector. Abbreviations: LTR, long terminal repeat; EF-1a, elongation factor 1-alfa promoter: SIN, self-inactivating; IRES, internal ribosome binding site; hrGFPII, humanized R. reniformis green fluorescent protein; WPRE, the post-transcriptional regulatory element of the woodchuck hepatitis virus to enhance transgene expression; pA, polyadenylation signal B) Significant fold-increase in the total number of nucleated cells generated after 10 days of culture (**p<0.001). C) Absolute number cell expressing the indicated cell surface markers (*p<0.05D) Total number of CFC per 1×10⁴ progeny cells plated. E) Total number of CFU-MK per 1×10⁴ progeny cells plated.
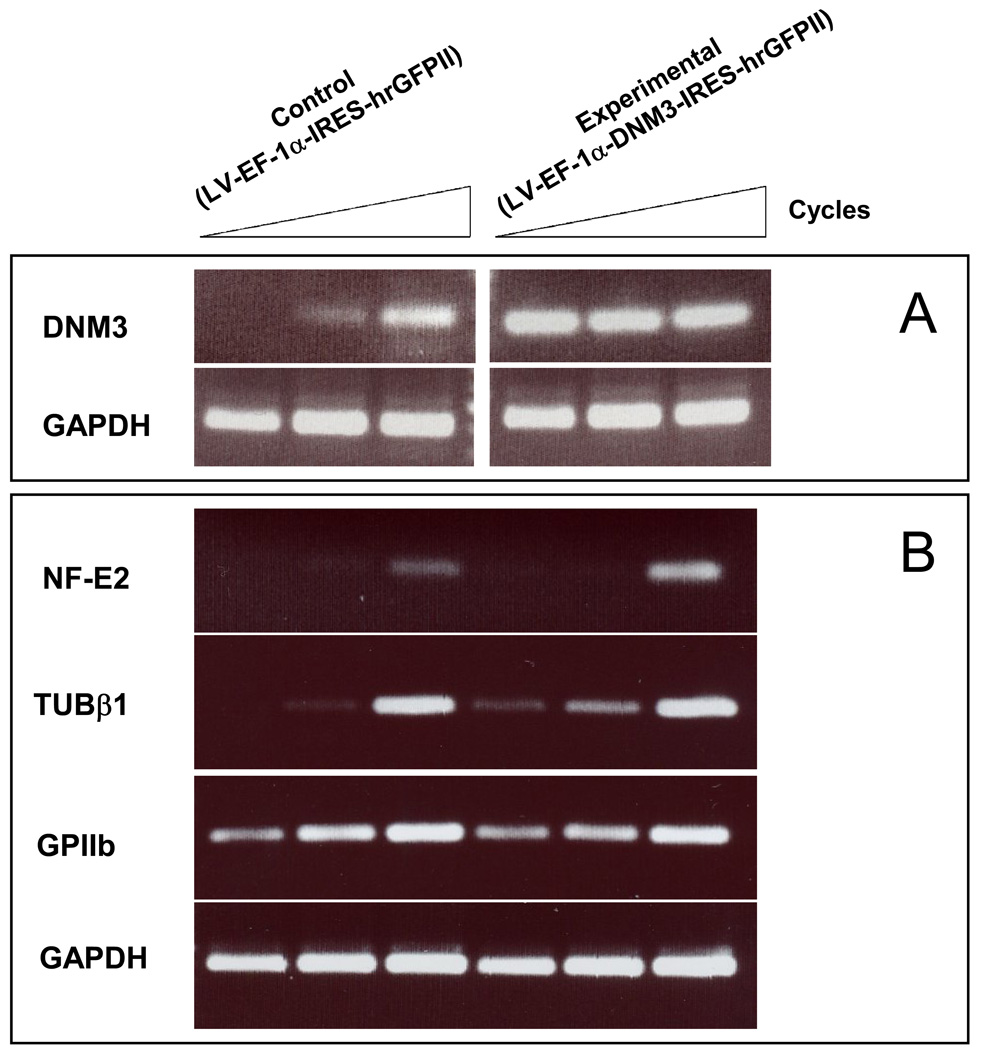
Gene expression levels for GPIIb, the major erythro-megakaryocyte transcription factor, nuclear factor erythroid 2 (NF-E2), [41] and its target the hematopoietic specific β1-tubulin isoform [42] were compared from cells that were mock infected and from cells transduced with pLV-DNM3-IRES-hrGFP to overexpress DNM3. Results from semi-quantitative RT-PCR assays confirmed that DNM3 was overexpressed in cells infected with pLV-DNM3-IRES-hrGFP (Fig. 9A). Expression levels for the transcription factor, NF-E2, and the cytoskeleton protein β1-tubulin were greater in cells overexpressing DNM3 than in control cultures (Fig. 9B). Also, GPIIb remained essentially unchanged in cell cultures overexpressing DNM3 relative to mock infected cultures (Fig. 9B). Together these results indicate that overexpression of DNM3 in CD34+ cells undergoing MK development results in an amplification of MK progenitors, without any apparent increase in the number of cells expressing markers of MK development.
Figure 9. Semi-quantitative RT-PCR analysis of RNA extracted from umbilical cord blood CD34+ cells infected with a DNM3 expressing lentivirus (LV-EF1-α-DNM3-IRES-hrGFPII) or mock infected (LV-EF1-α-IRES-hrGFPII).
Ethidium bromide-stained agarose gels of RT-PCR products differing by 3-cycle increments (37, 40, 43). GAPDH was used as a housekeeping gene control. A) Changes in mRNA expression levels for DNM3. B) Changes in expression levels for NF-E2, β1tubulin and GPIIb.
DISCUSSION
The results of this study provide direct evidence that a member of the dynamin family of genes, DNM3, is differentially expressed during MK development. As mechanochemical enzymes that regulate a variety of membrane rearrangements in various cell types [2, 6–9, 45–47]), the dynamins are likely candidates for participating in cellular functions that mediate cytoskeleton and membrane changes that occur during MK/platelet development. Our observations that transcript levels for DNM3 increase during the course of MK development, the presence of DNM3 protein in MKs and proplatelet processes, and the amplification of MK progenitors when over-expressing DNM3 implicate dynamin 3 as a possible participant in regulating membrane dynamics that are required during megakaryocytopoiesis.
The process of megakayrocytopoiesis provides an opportunity to study the membrane dynamics required for very large MKs (40–100 µm diameter) to produce thousands of platelets. For MKs to generate platelets, they need to undergo a terminal maturation process that involves cellular enlargement, an endoreduplication process to increase DNA content, and the formation of an elaborate continuous membranous network that constitutes the demarcation membrane system (DMS) [31]. The DMS is the source of proplatelet membrane structures [30], which were first proposed by Becker and DeBruyn to be the precursor formations responsible for platelet generation [43]. Ultrastructural studies of murine culture derived megakaryocytes show that proplatelet processes are dynamic structures that interconvert between spread lamellar processes and condensed structures that resemble platelets [44]. The resulting proplatelet structures are elongated with constrictions along their length giving the appearance of beads on a string [32, 33] and undergo continuous irregular movements that occasionally include twisting [33]. At the constriction sites, microtubules are longitudinally oriented showing ultrastructural similarities to those occurring during the terminal phase of cytokinesis [32, 33]. As a result of this elaborate developmental process; cytoskeletal rearrangements that couple morphogenesis with membrane dynamics are required at multiple steps.
Confocal imaging shows DNM3 diffusely distributed throughout the cytoplasm of human MKs with a greater association with actin than with α/β tubulin. In contrast, any possible association with actin in MKs became less evident in human proplatelet processes. Although the punctate appearance of DNM3 in the cytoplasm of murine proplatelet processes suggested that DNM3 might be associated with vesicles, co-staining for p-selectin (alpha granules) and serotonin (dense granules) did not reveal any association of DNM3 with these platelet vesicles. Results of electron microscopy immunogold staining show that DNM3 is widely distributed throughout the MK cytoplasm with no apparent localization to organelles. Together these observations place DNM3 predominantly in the cytoplasm, where it could participate in the organization of the plasma membrane during MK development.
Lentiviral mediated gene delivery into hematopoietic stem cells was used to begin to elucidate the function of DNM3 in developing MKs. The results of these experiments showed that in populations of cells over-expressing DNM3 that there was an increase in the number of TNCs, an increase in the total number of cells expressing CD34, but essentially no change in the number of cells expressing antigens associated with MK development. There was also an amplification of total CFC and CFU-MKs relative to mock infected CD34+ cells. Exactly why there was no increase in the number of cells expressing MK lineage specific markers, but yet there was an increase in CFU-MK and CFC is perplexing. However, when interpreting these results it is worth noting that cell counts and immunophenotyping were performed 10 days after the cultures were initiated. Whereas, to set up CFC and CFU-MK assays the cells were removed on day 4 of culture and plated onto a collagen-based semi-solid media, which were than cultured for an additional week before assessing colony formation. Since progenitor cells acquire lineage specific markers as their ability to form colonies decreases, it is reasonable to speculate that amplification of clonogenic precursors early in the cultures may have delayed the acquisition of lineage specific markers.
An amplification of clonogenic precursors when DNM3 was overexpressed in MKs suggests that DNM3 may participate in the proliferation of early progenitors. A search of the literature does reveal participation of dynamin in cytokinesis, and it appears that the role of dynamin in cytokinesis is evolutionarily conserved (11). Dynamin localizes to the microtubules of the spindle midzone and the intercellular bridge during cytokinesis to facilitate the final separation of dividing cells [11].
The observation that there is an increase in the expression of NF-E2 when overexpressing DNM3 in developing MKs provides further evidence that DNM3 may have a mechanistic role in MK development. NF-E2 is a heterodimeric leucine zipper transcription factor that comprises a MK-erythroid specific 45-kDa subunit and a non-lineage specific p18 Maf family subunit which controls terminal MK maturation, proplatelet formation and platelet release, by regulating a panoply of MK genes which are crucial elements in the process of platelet production [48]. NF-E2 deficient mice have profound thrombocytopenia (<5% of normal) with an arrest in MK maturation, a prominent highly disorganized DMS, reduced granule numbers, a severe platelet deficit, and display defective inside-out signalling by the αIIbβ3 integrin [49–51].
Expression of DNM3 not only in the cytoplasm of MKs, but also in proplatelet processes suggests that DNM3 may have multiple roles in MK and platelet development. Thus, in addition to addressing questions related to possible roles that the dynamins play in membrane dynamics associated with the cytokinesis of MK progenitors. Future studies will also need to address the possibility that the dynamins may participate at multiple steps in membrane rearrangements essential for the maturation of MKs and platelet biogenesis.
ACKNOWLEDGEMENT
We would like to thank staff members of the Center for Expression Array at the University of Washington for technical assistance with microarray experiments and the Fred Hutchinson Cancer Research Center for help with the enrichment of CD34+ cells from organ donor marrow. We also appreciate the technical assistance provided by Najla Abdurrahman.
Footnotes
Publisher's Disclaimer: This is a PDF file of an unedited manuscript that has been accepted for publication. As a service to our customers we are providing this early version of the manuscript. The manuscript will undergo copyediting, typesetting, and review of the resulting proof before it is published in its final citable form. Please note that during the production process errors may be discovered which could affect the content, and all legal disclaimers that apply to the journal pertain.
References
- 1.Orth JD, McNiven MA. Dynamin at the actin-membrane interface [review] Curr Opin Cell Biol. 2003;15:31–39. doi: 10.1016/s0955-0674(02)00010-8. [DOI] [PubMed] [Google Scholar]
- 2.Shpetner HS, Vallee RB. Identification of dynamin, a novel mechanochemical enzyme that mediates interactions between microtubules. Cell. 1989;59:421–432. doi: 10.1016/0092-8674(89)90027-5. [DOI] [PubMed] [Google Scholar]
- 3.Ochoa GC, Slepnev VI, Neff L, et al. A functional link between dynamin and the actin cytoskeleton at podosomes. J Cell Biol. 2000;150:377–389. doi: 10.1083/jcb.150.2.377. [DOI] [PMC free article] [PubMed] [Google Scholar]
- 4.McNiven MA, Kim L, Krueger EW, Orth JD, Cao H, Wong TW. Regulated interactions between dynamin and the actin-binding protein cortactin modulate cell shape. J Cell Biol. 2000;151:187–198. doi: 10.1083/jcb.151.1.187. [DOI] [PMC free article] [PubMed] [Google Scholar]
- 5.Krutchen AE, McNiven MA. Dynamin as a mover and pincher during cell migration and invasion. J Cell Sci. 2006;119:1683–1690. doi: 10.1242/jcs.02963. [DOI] [PubMed] [Google Scholar]
- 6.Perrais D, Merrifield CJ. Dynamics of endocytic vesicle creation [review] Dev Cell. 2005;9:581–592. doi: 10.1016/j.devcel.2005.10.002. [DOI] [PubMed] [Google Scholar]
- 7.Pelkmans L, Puntener D, Helenius A. Local actin polymerization and dynamin recruitment in SV40-induced internalization of caveolae. Science. 2002;296:535. doi: 10.1126/science.1069784. [DOI] [PubMed] [Google Scholar]
- 8.Merrifield CJ, Feldman ME, Wan L, Almers W. Imaging actin and dynamin recruitment during invagination of single clathrin-coated pits. Nat Cell Biol. 2002;4:691–698. doi: 10.1038/ncb837. [DOI] [PubMed] [Google Scholar]
- 9.Gold ES, Underhill DM, Morrissette NS, Guo J, McNiven MA, Aderem A. Dynamin 2 is required for phagocytosis in macrophages. J Exp Med. 1999;190:1849–1856. doi: 10.1084/jem.190.12.1849. [DOI] [PMC free article] [PubMed] [Google Scholar]
- 10.Thompson HM, Skop AR, Euteneuer U, Meyer BJ, McNiven MA. The large GTPase dynamin associates with the spindle midzone and is required for cytokinesis. Curr Biol. 2002;12:2111–2117. doi: 10.1016/s0960-9822(02)01390-8. [DOI] [PMC free article] [PubMed] [Google Scholar]
- 11.Obar RA, Collins CA, Hammarback JA, Shpetner HS, Vallee RB. Molecular cloning of the microtubule-associated mechanochemical enzyme dynamin reveals homology with a new family of GTP-binding proteins. Nature. 1990;347:256–261. doi: 10.1038/347256a0. [DOI] [PubMed] [Google Scholar]
- 12.Sontag JM, Fykse EM, Ushkaryov Y, Liu JP, Robinson PJ, Südhof TC. Differential expression and regulation of multiple dynamins. J Biol Chem. 1994;269:4547–4554. [PubMed] [Google Scholar]
- 13.Cook TA, Urrutia R, McNiven MA. Identification of dynamin 2, an isoform ubiquitously expressed in rat tissues. Proc Natl Acad Sci U S A. 1994;91:644–648. doi: 10.1073/pnas.91.2.644. [DOI] [PMC free article] [PubMed] [Google Scholar]
- 14.Nakata T, Takemura R, Hirokawa N. A novel member of the dynamin family of GTP-binding proteins is expressed specifically in the testis. J Cell Sci. 1993;105:1–5. doi: 10.1242/jcs.105.1.1. [DOI] [PubMed] [Google Scholar]
- 15.Urrutia R, Henley JR, Cook T, McNiven MA. The dynamins: redundant or distinct functions for an expanding family of related GTPases? [review] Proc Natl Acad Sci U S A. 1997;94:377–384. doi: 10.1073/pnas.94.2.377. [DOI] [PMC free article] [PubMed] [Google Scholar]
- 16.Nakata T, Iwamota A, Noda Y, Takemura R, Yoshikura Hirokawa N. Predominant and developmentally regulated expression of dynamin in neurons. Neuron. 1991;7:461–469. doi: 10.1016/0896-6273(91)90298-e. [DOI] [PubMed] [Google Scholar]
- 17.Cook TA, Urrutia R, McNiven MA. Three dynamin-encoding genes are differentially expressed in developing rat brain. J Neurochem. 1996;67:927–931. doi: 10.1046/j.1471-4159.1996.67030927.x. [DOI] [PubMed] [Google Scholar]
- 18.Cao H, Garcia F, McNiven MA. Differential distribution of dynamin isoforms in mammalian cells. Mol Biol Cell. 1998;9:2595–2609. doi: 10.1091/mbc.9.9.2595. [DOI] [PMC free article] [PubMed] [Google Scholar]
- 19.Muhlberg AB, Warnock DE, Schmid SL. Domain structure and intramolecular regulation of dynamin GTPase. EMBO J. 1997;16:6676–6683. doi: 10.1093/emboj/16.22.6676. [DOI] [PMC free article] [PubMed] [Google Scholar]
- 20.Muhlberg AB, Schmid SL. Domain structure and function of dynamin probed by limited proteolysis. Methods. 2000;20:475–483. doi: 10.1006/meth.2000.0960. [DOI] [PubMed] [Google Scholar]
- 21.Roux A, Uyhazi K, Frost A, De Camilli P. GTP-dependent twisting of dynamin implicates constriction and tension in membrane fission. Nature. 2006;441:528–531. doi: 10.1038/nature04718. [DOI] [PubMed] [Google Scholar]
- 22.Salim K, Bottomley MJ, Querfurth E, et al. Distinct specificity in the recognition of phosphoinositides by the pleckstrin homology domains of dynamin and Bruton’s tyrosine kinase. EMBO J. 1996;15:6241–6250. [PMC free article] [PubMed] [Google Scholar]
- 23.Zheng J, Cahill SM, Lemmon MA, Fushman D, Schlessinger J, Cowburn D. Identification of the binding site for acidic phospholipids on the pH domain of dynamin: implications for stimulation of GTPase activity. J Mol Biol. 1996;255:14–21. doi: 10.1006/jmbi.1996.0002. [DOI] [PubMed] [Google Scholar]
- 24.Fukushima NH, Brisch E, Keegan BR, Bleazard W, Shaw JM. The GTPase effector domain sequence of the Dnm1p GTPase regulates self-assembly and controls a rate-limiting step in mitochondrial fission. Mol Biol Cell. 2001;12:2756–2766. doi: 10.1091/mbc.12.9.2756. [DOI] [PMC free article] [PubMed] [Google Scholar]
- 25.Okamoto PM, Herskovits JS, Vallee RB. Role of the basic, praline-rich region of dynamin in Src homology 3 domain binding and endocytosis. J Biol Chem. 1997;272:11629–11635. doi: 10.1074/jbc.272.17.11629. [DOI] [PubMed] [Google Scholar]
- 26.Patel SR, Hartwig JH, Italiano JE., Jr The biogenesis of platelets from megakaryocyte proplatelets [review] J Clin Invest. 2005;115:3348–3354. doi: 10.1172/JCI26891. [DOI] [PMC free article] [PubMed] [Google Scholar]
- 27.Vitrat N, Cohen-Solal K, Pique C, et al. Endomitosis of human megakaryocytes are due to abortive mitosis. Blood. 1998;91:3711–3723. [PubMed] [Google Scholar]
- 28.Behnke O. An electron microscope study of megakaryocytes of rat bone marrow. I. The development of the demarcation membrane system and the platelet surface coat. J Ultrastruct Res. 1968;24:412–433. doi: 10.1016/s0022-5320(68)80046-2. [DOI] [PubMed] [Google Scholar]
- 29.Italiano JE, Jr, Lecine P, Shivdasani RA, Hartwig JH. Blood platelets are assembled principally at the ends of proplatelet processes produced by differentiated megakaryocytes. J Cell Biol. 1999;147:1299–1312. doi: 10.1083/jcb.147.6.1299. [DOI] [PMC free article] [PubMed] [Google Scholar]
- 30.Schulze H, Korpal M, Hurov J, et al. Characterization of the megakaryocyte demarcation membrane system and its role in thrombopoiesis. Blood. 2006;107:3868–3875. doi: 10.1182/blood-2005-07-2755. [DOI] [PMC free article] [PubMed] [Google Scholar]
- 31.Radley JM, Scurfield G. The mechanism of platelet release. Blood. 1980;56:996–999. [PubMed] [Google Scholar]
- 32.Radley JM, Haller CJ. The demarcation membrane system of the megakaryocyte: a misnomer? Blood. 1982;60:213–219. [PubMed] [Google Scholar]
- 33.Newman H, Reems JA, Rigley TH, Bravo D, Strong DM. Donor age and gender are the strongest predictors of marrow recovery from cadaveric vertebral bodies. Cell Transplant. 2003;12:83–90. doi: 10.3727/000000003783985133. [DOI] [PubMed] [Google Scholar]
- 34.Rubinstein P, Dobrila L, Rosenfield RE, et al. Processing and cryo-preservation of placental/umbilical cord blood for unrelated bone marrow reconstitution. Proc Natl Acad Sci U S A. 1995;92:10119–10122. doi: 10.1073/pnas.92.22.10119. [DOI] [PMC free article] [PubMed] [Google Scholar]
- 35.Guerriero R, Testa U, Gabbianelli M, et al. Unilineage megakaryocytic proliferation and differentiation of purified hematopoietic progenitors in serum-free liquid culture. Blood. 1995;86:3725–3736. [PubMed] [Google Scholar]
- 36.Yenerel MN, Sundell IB, Weese J, Bulger M, Gilligan DM. Expression of adducin genes during erythropoiesis: A novel erythroid promoter for ADD2. Exp Hematol. 2005;33:758–766. doi: 10.1016/j.exphem.2005.03.015. [DOI] [PubMed] [Google Scholar]
- 37.Shim MH, Hoover A, Blake N, Drachman JB, Reems JA. Gene expression profile of primary human CD34+CD38lo cells differentiating along the megakaryocyte lineage. Exp Hematol. 2004;32:638–648. doi: 10.1016/j.exphem.2004.04.002. [DOI] [PubMed] [Google Scholar]
- 38.Italiano JE, Lecine P, Shivdasnai RA, Hartwig JH. Blood platelets are assembled principally at the ends of proplatelet processes produced by differentiated megakaryocytes. J Cell Biol. 1999;147:1299–1312. doi: 10.1083/jcb.147.6.1299. [DOI] [PMC free article] [PubMed] [Google Scholar]
- 39.Horn PA, Keyser KA, Peterson LJ, et al. Efficient lentiviral gene transfer to canine repopulating cells using an overnight transduction protocol. Blood. 2004;103:3710–3716. doi: 10.1182/blood-2003-07-2414. [DOI] [PubMed] [Google Scholar]
- 40.Zufferey R, Nagy D, Mandel RJ, Naldini L, Trono D. Multiply attenuated lentiviral vector achieves efficient gene delivery in vivo. Nat Biotechnol. 1997;15:871–875. doi: 10.1038/nbt0997-871. [DOI] [PubMed] [Google Scholar]
- 41.Shivdasani RA, Fujiwara Y, McDevitt MA, Orkin SH. A lineage-selective knockout establishes the critical role of transcription factor GATA-1 in megakaryocyte growth and platelet development. EMBO J. 1997;16:3965–3973. doi: 10.1093/emboj/16.13.3965. [DOI] [PMC free article] [PubMed] [Google Scholar]
- 42.Lecine P, Italiano JE, Jr, Kim S-W, Villeval J-L, Shivdasani RA. Hematopoietic-specific β1 tubulin participates in a pathway of platelet biogenesis dependent on the transcription factor NF-E2. Blood. 2000;96:1366–1373. [PubMed] [Google Scholar]
- 43.Konopka CA, Schleede JB, Skop AR, Bednarek SB. Dynamin and cytokinesis [review] Traffic. 2006;7:239–247. doi: 10.1111/j.1600-0854.2006.00385.x. [DOI] [PMC free article] [PubMed] [Google Scholar]
- 44.Di A, Nelson DJ, Bindokas V, Brown ME, Libunao F, Palfrey HC. Dynamin regulates focal exocytosis in phagocytosing macrophages. Mol Biol Cell. 2003;14:2016–2028. doi: 10.1091/mbc.E02-09-0626. [DOI] [PMC free article] [PubMed] [Google Scholar]
- 45.Oh P, McIntosh DP, Schnitzer JE. Dynamin at the neck of caveolae mediates their budding to form transport vesicles by GTP-driven fission from the plasma membrane of endothelium. J Cell Biol. 1998;141:101–114. doi: 10.1083/jcb.141.1.101. [DOI] [PMC free article] [PubMed] [Google Scholar]
- 46.Becker RP, DeBruyn PP. The transmural passage of blood cells into myeloid sinusoids and the entry of platelets into the sinusoidal circulation: a scanning electron microscopic investigation. Am J Anat. 1976;145:1046–1052. doi: 10.1002/aja.1001450204. [DOI] [PubMed] [Google Scholar]
- 47.Italiano JE, Jr, Shivdasani RA. Megakaryocytes and beyond: the birth of platelets. J Thromb Haemost. 2003;1:1174–1182. doi: 10.1046/j.1538-7836.2003.00290.x. [DOI] [PubMed] [Google Scholar]
- 48.Lecine P, Shivdasani RA. Cellular and molecular biology of megakaryocyte differentiation in the absence of lineage-restricted transcription factors. Stem Cells. 1998;16 suppl 2:91–95. doi: 10.1002/stem.5530160712. [DOI] [PubMed] [Google Scholar]
- 49.Shivdasani RA, Rosenblatt MF, Zucker-Franklin D, et al. Transcription factor NF-E2 is required for platelet formation independent of the actions of thrombopoietin: MGDF in megakaryoycte development. Cell. 1995;81:695–704. doi: 10.1016/0092-8674(95)90531-6. [DOI] [PubMed] [Google Scholar]
- 50.Shiraga M, Ritchie A, Aidoudi S, et al. Primary megakaryocytes reveal a role for transcription factor NF-E2 in integrin alpha IIb beta 3 signaling. J Cell Biol. 1999;147:1419–1413. doi: 10.1083/jcb.147.7.1419. [DOI] [PMC free article] [PubMed] [Google Scholar]
- 51.Lecine P, Villeval JL, Vyas P, Swencki B, Xu Y, Shivdasani RA. Mice lacking transcription factor NF-E2 provide in vivo validation of the proplatelet model of thrombocytopoiesis and show a platelet production defect that is intrinsic to megakaryocytes. Blood. 1998;92:1608–1616. [PubMed] [Google Scholar]


