Abstract
Objectives
The distribution of gentamicin along the fluid spaces of the cochlea following local applications has never previously been demonstrated. Computer simulations have predicted that significant basal-apical concentration gradients might be expected and histological studies indicate that hair cell damage is greater at the base than at the apex following local gentamicin application. In the present study, gradients of gentamicin along the cochlea were measured.
Methods
A recently-developed method of sampling perilymph from the cochlear apex of guinea pigs was used, in which the samples represent fluid originating from different regions along scala tympani. Gentamicin concentration was determined in sequential apical samples which were taken following up to three hours of local application to the round window niche.
Results
Substantial gradients of gentamicin along the length of scala tympani were demonstrated and quantified, averaging more than 4000 times greater concentration at the base compared to the apex at the time of sampling. Peak concentrations and gradients for gentamicin varied considerably between animals, likely resulting from variations in round window membrane permeability and rates of perilymph flow.
Conclusions
The large gradients for gentamicin demonstrated here in guinea pigs account for how it is possible to suppress vestibular function in some patients with a local application of gentamicin without damaging auditory function. Variations in round window membrane permeability and in perilymph flow could account for why hearing losses are observed in some patients.
Keywords: cochlea, perilymph, ototoxicity, drug delivery, round window membrane, pharmacokinetics
Introduction
Intratympanic injection of gentamicin has been widely established as a treatment for Menière’s disease. The goal of this therapy is to suppress vestibular function while minimizing damage to hearing. As the drug is applied to the round window membrane (RWM) and from there enters scala tympani (ST), both auditory and vestibular damage may be expected. Dosing regimens have evolved in an empirical fashion during the past half-century with many reports demonstrating a good control of vertigo with limited hearing loss 1. Nevertheless, some studies have reported a high incidence of deafness, such as one in which continuous application of gentamicin was used 2. Such results demonstrate the difficulties optimizing application protocols and the need for greater understanding how locally applied drugs are distributed within the inner ear fluids.
The pharmacokinetics of gentamicin in the inner ear following local applications have been difficult to establish. Animal studies with samples taken from the vestibule 3 showed a peak concentration at 600–700 min after drug application. The drug time course found in this study was interpreted using a finite element model 4 which demonstrated that entry of gentamicin into the vestibule was too fast for the drug to be diffusing along the cochlear scalae and through the helicotrema. Instead, the time course was consistent with gentamicin passing from ST to scala vestibuli (SV) by local inter-scala exchange, such as by diffusion across the spiral ligament. This route could account quantitatively for gentamicin entry into the vestibule with lower concentrations reaching the apical cochlear regions important to speech. A prediction from this analysis was that substantial gradients for locally-applied drugs were likely to exist along ST. In the present study we used sequential sampling from the cochlear apex which allows both drug concentration and the drug gradient along ST to be quantified. The goals of the study were to determine whether longitudinal gradients of gentamicin were present in the cochlea and whether the gradients were of comparable magnitude to those predicted by our prior computer simulations.
Materials and Methods
i) Animal Preparation
Local gentamicin application to the RWM was performed in 12 NIH strain pigmented guinea pigs. Animals were anesthetized with 100 mg/kg sodium thiobutabarbital (Inactin, RBI pharmaceuticals). Supplemental anesthetic doses were given regularly via an intravenous line in the external jugular vein. Pancuronium bromide was given as a muscle relaxant and the animals were artificially ventilated via a tracheal cannula, allowing end-tidal CO2 to be maintained near 38 mm Hg (5%). A Surgivet pulse-oximeter (Waukesha, WI) was used to monitor heart rate and vascular pO2. Rectal temperature was maintained at 38 °C with a thermistor-controlled DC-powered heating blanket. Animals were mounted in a head-holder and the cochlea was exposed by a ventrolateral approach.
The experimental protocols for this study were approved by the Animal Studies Committee of Washington University (Approval number 20040209).
ii) Gentamicin application to the Round Window Membrane
Gentamicin (Refobacin® 40 mg/ml, Merck, Darmstadt, Germany) was applied to the RWM from a pipette placed close to the bony lip of the round window (RW) niche. In three groups of animals, the drug was applied continuously for 30 min (n=3), 2 hours (n=3) or 3 hours (n=6). The rate of drug irrigation was 5 μL/min in the 30 min experiments, 4 uL/min in the 2 hour experiments and 5 μL /min, reduced to 2 μL/min after the first hour in the 3 hour experiments. In 3 animals the RWM was permeabilized prior to drug application by briefly blowing desiccated air into the bulla, a procedure which has been found to increase the RWM permeability by a factor of approximately four 5.
iii) Fluid sampling from the cochlear apex
The apical sampling method is based on the rationale that if all the fluid emerging from a perforated cochlea can be collected, the composition of samples can be interpreted quantitatively in terms of the perilymph concentration prior to sampling. In order to collect all of the fluid without any loss to the middle ear, a cup made of silicone glue was constructed around the site to be perforated at the apex. Complete details of the method are given elsewhere 5,6. In brief, the mucosa on the apical turns of the cochlea were cleared and the bone was allowed to dry. A thin layer of cyanoacrylate adhesive was applied, followed by a layer of a two-part silicone adhesive (WPI Kwik-Cast). Around the periphery of the site to be perforated, silicone was built up thickly in multiple layers until a “cup” shape was formed. The sampling cup was constructed prior to gentamicin application to the RWM.
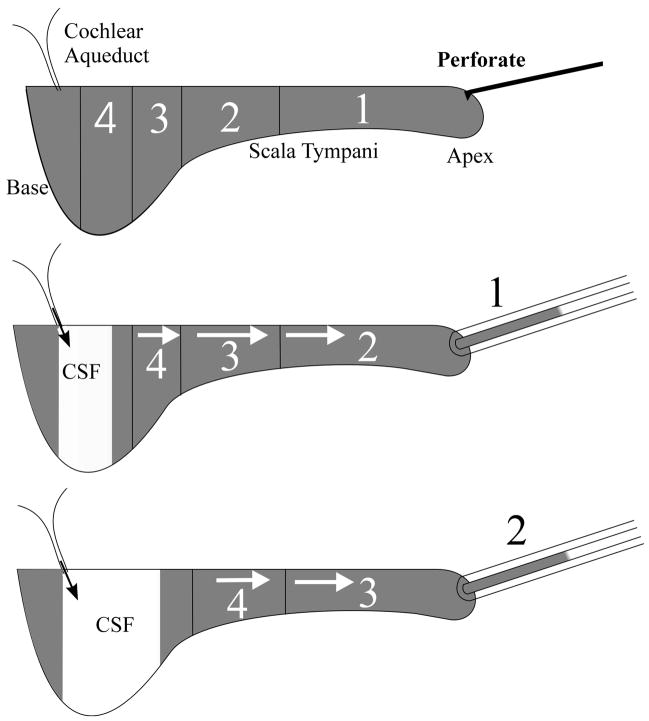
When the cochlear apex was perforated, fluid emerged that was readily collected into hand-held glass capillary tubes, as illustrated in Fig. 1. In the present study, we collected 10 samples from each animal, each nominally 1 μL in volume. Collection of the sample is driven primarily by CSF entering ST through the cochlear aqueduct, which then displaces the ST contents into the collection pipette. The initial sample (Fig 1: 1) contains fluid that originated from the apical turns of ST while successive samples (Fig 1: 2 – 4) contain perilymph originating from more basal regions of the cochlea. Subsequent samples increasingly contained CSF that has passed through ST.
Figure 1.
Schematic representation of the apical sampling method. When the cochlear apex is perforated, scala tympani contents (shown gray) are slowly expelled, driven by CSF pressure. Collection of sequential fluid samples from the apex provides perilymph that has orginated first from the apical regions (1) and then from progressively more basal regions (2, 3, 4) of the scala.
Prior to sampling, all drug solution was removed from the auditory bulla and the RW niche area using tissue wicks, taking care not to touch the RWM. The bulla and the silicone sampling cup were rinsed twice with artificial perilymph. A 50 – 100 μm diameter perforation was made at the apex in the bone over scala vestibuli with a 30° pick (Storz N170580, 1/3mm 30 degree oval window pick). The emerging fluid initially formed a bead within the hydrophobic silicone cup. A blunt capillary tube was held by hand in contact with the apex until a 1 μL sample had accumulated. This was repeated to obtain ten separate samples. Collecting each sample took an average of 32.7 s (SD 12.8 s, n=120). The timing of sample collections was documented with an audio recording made on a computer. The time between removing drug solution from the round window niche (i.e. the end of drug application) and the start of the first sample collection averaged 3.7 min (SD 1.8 min, n=12). The volume of each sample was determined by measuring the sample length with a calibrated dissecting microscope. The average sample volume was 1.05 μL (SD 0.04 μL, n=120).
iv) Analysis of Samples
Each sample was expelled into 120 μL of Abbott Labs IVD 9519 dilution buffer. Gentamicin was quantified with a fluorescence-polarization-immunoassay (TDX SLX Analyzer, Abbot, Abbott Park, Illinois, U.S.A.). The sensitivity of the assay was approximately 0.3 μg/ml. The volume required for the assay was 75 μL. The available volume permitted a second, further diluted analysis to be performed in cases where the concentration exceeded the upper limit of the measurement system. In addition, three dilutions of the applied gentamicin solution (1:10; 1:100 and 1:1000) were analyzed from each experiment.
v) Interpretation of sequential sample data
The concentrations of the ten samples obtained in each experiment were interpreted using a modified version of a finite-element cochlear fluids simulation program, as described in a prior publication 6. The simulation program is available at http://oto.wustl.edu/cochlea/. The program was used to simulate drug spread during the application period and then during the sequential sampling procedure. The simulation of sampling took into account the specific volume and time for each sample. The diffusion coefficient used for gentamicin was 0.72 × 10⁻⁹ m2/s, based on a mean formula weight of 466 for component fractions of the gentamicin preparation 4,7. Three simulation parameters (RWM permeability, the rate of longitudinal perilymph flow along scala tympani during drug application with the cochlea in the sealed state, and the accessibility of drug into fluid spaces parallel to ST) were adjusted until the sample concentrations predicted by the model best fit the measured sample concentrations. The fit was optimized by minimizing the sums of squares of differences between calculated and measured sample values. We found no evidence for gentamicin clearance (to blood) so no clearance component was included in the simulations. This does not mean that gentamicin clearance does not occur, but rather that the amount of gentamicin clearance occurring in experiments of 3 hours in duration was too small to be quantified.
Results
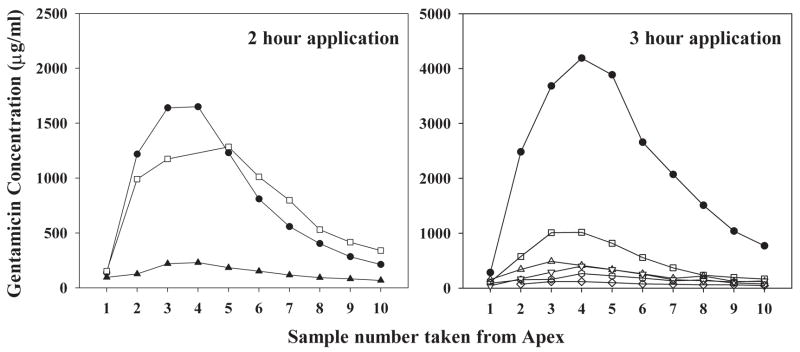
Gentamicin concentrations of samples collected sequentially from the cochlear apex following 2- or 3-hour applications of drug are shown in Fig. 2. In each experiment, gentamicin concentration of the first sample was low and the concentration increased in subsequent samples, showing a peak in approximately the fourth sample. This was followed by a steady decline in concentration as further samples were taken. In qualitative terms, the curves show that gentamicin concentration was low in the first samples that originated from apical regions (as indicated in Fig. 1) and was substantially higher in samples that originated from the basal part of the scala tympani. The raw sample data confirm that even after 2- or 3-hour applications of drug, substantial basal-apical gradients of gentamicin are present along the cochlea. The progressive decline of concentration found in later samples results from CSF entering ST through the cochlear aqueduct and which gains gentamicin diffusing from adjacent compartments as it passes along the scala.
Figure 2.
Measured gentamicin concentrations in the 10 samples taken from animals after 2 hours (left) or 3 hours (right) application of gentamicin to the RW niche. Each line represents the 10 fluid samples obtained in a single experiment. Filled symbols show animals in which the RWM was permeabilized prior to gentamicin delivery.
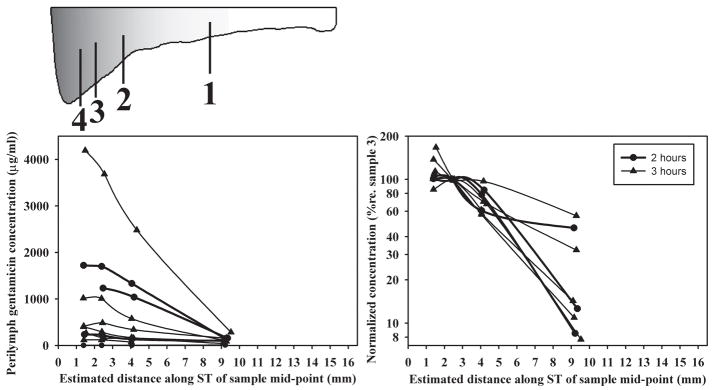
Quantitative interpretation of the sample data required consideration of the site of origin of the samples, as shown in Figure 3. For each experiment, the first four samples were re-plotted according to their calculated site of origin along scala tympani, as shown in the schematic. The site of origin was based on the actual volumes taken and made use of the documented variation of ST cross-sectional area with distance in the guinea pig 6, 8. The absolute concentrations (Fig. 2 and Fig. 3, left panel) show substantial variation of the amount of gentamicin entering ST. When drug levels were normalized with respect to the third sample (the most basal, highest concentration sample that is least influenced by dilution with CSF 6), the variation of drug gradients along ST can be compared (Fig. 3, right panel). The gradients, quantified as the logarithm of the ratio of the first and third samples, varied from 0.25 to 1.11 (mean 0.75, n=8). One animal with a zero concentration of sample 1 was excluded from this analysis. However, this simple calculation is likely to grossly underestimate the actual gradient along ST. The first sample requires the ST contents from approximately the apical 10 mm to account for the 1 μL volume taken so that drug diffusing only 6 mm up the cochlea will be included. Samples originating in the basal turn (sample 4) are diluted by CSF entry. For these reasons, a more detailed analysis was performed using computer simulations.
Figure 3.
Concentrations of the first four samples taken in each experiment shown as absolute values (left panel) or normalized and shown on a logarithmic scale (right panel). Samples have been plotted based on their estimated site of origin along the scala tympani, as shown by the schematic of scala tympani.
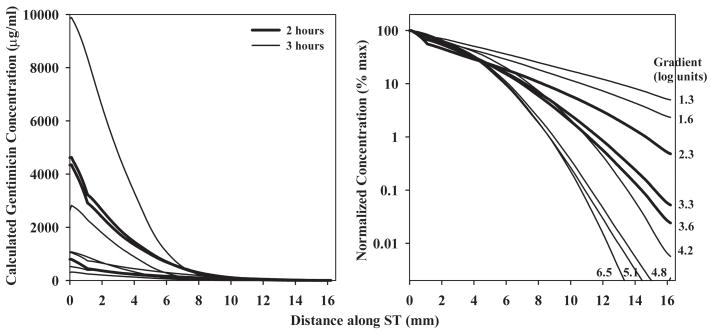
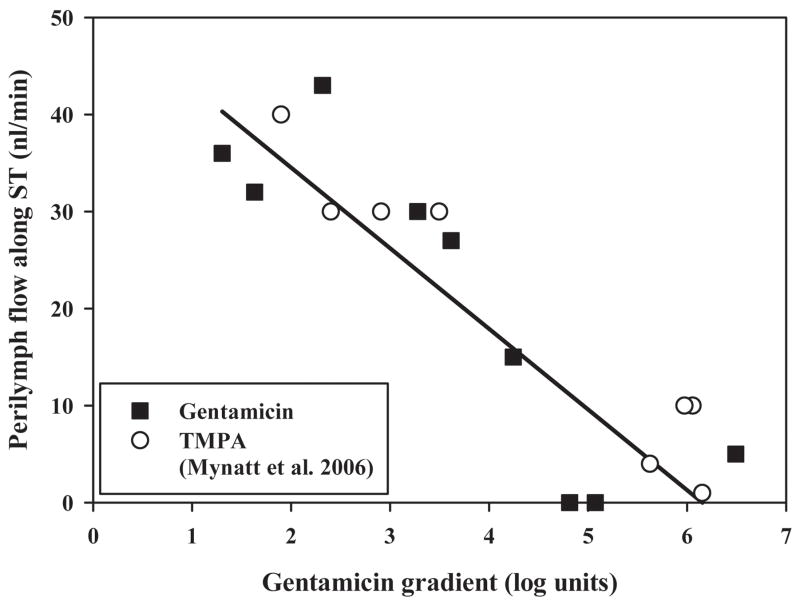
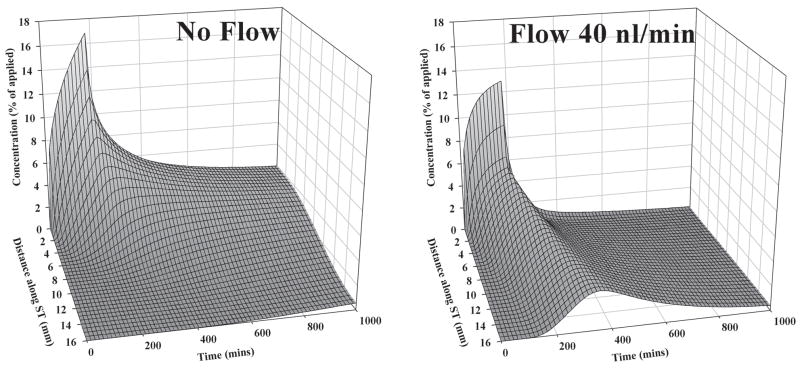
The curves consisting of up to 10 samples in each experiment were analyzed independently using our finite-element simulation program to match the samples obtained. With this analysis it was possible to derive the gentamicin profile along ST immediately prior to sampling, which best accounted for the sample values. The concentration profiles calculated in this manner are summarized in Fig 4. It is once more apparent there is considerable variation of the gentamicin concentrations in different experiments, which the analysis shows can be accounted for by differences in RWM permeability. The values for RWM permeability to gentamicin required to fit the data averaged 0.005 × 10⁻⁵ m/s (SD 0.006, n=6) in untreated animals and 0.035 × 10⁻⁵ m/s (SD 0.047, n=3) in animals in which the RWM was permeabilized by treatment with dry air. The calculated drug gradients along ST (Fig. 4, right panel) ranged from 1.3 to 6.5 log units (mean 3.64, n=9) and did not differ significantly between 2 and 3 hour applications (t-test, p=0.58). The gradients derived from simulations are almost a factor of 5 greater than those obtained by taking the ratio of sample values which justifies the need to interpet sample data carefully. The average gradient of 3.64 log units represents a concentration at the base of 4365 times that at the apex at the time of sampling. The two other parameters of the simulation, the longitudinal flow rate along ST in the intact state (prior to sampling) and the accessibility of gentamicin to compartments parallel to ST were 0.021 μL/min (SD 0.016, n=9) and 20.5 % of free diffusion (SD 9.2, n=9) respectively. The primary factor contributing to the variation of drug gradients in different animals in our simulations was the rate of longitudinal flow along ST. It was necessary to include fluid flow to account for the greater amount of gentamicin in the initial samples of some animals than could be accounted for by drug diffusion alone. The relationship between the rate of flow used in the simulations and the gentamicin gradient is shown in Fig 5. Also included in this figure are data from our previous apical sampling study 6. For those animals with steep gradients, little or no longitudinal flow was required to fit the data. In contrast, for animals with lower gradients a very low rate of longitudinal flow could account for the spread towards the apex. The highest flow rate was around 40 nl/min, a very low rate but which, accumulating over time, would cause increased spread of drug towards the apex. The influence of flow at this low rate is more apparent when dispersal is calculated as a function of distance and time, as shown in Fig. 6. These calculations are used the mean parameters derived from fitting the experimental data. The spread of gentamicin is shown during and following a 3 hour application to the RWM in the situations where there is either no flow, or with 40 nl/min apically-directed flow present. For the situation where there was no flow, the highest drug levels remained confined to the basal half of the cochlea. In contrast, with flow at 40 nl/min, although the basal region near the round window would be exposed to higher drug levels, the rest of the cochlea will be exposed to comparable levels of drug. The observed variation in drug gradients found between different animals therefore has rather striking implications for how drugs are dispersed along the cochlea.
Figure 4.
Gentamicin gradients along scala tympani derived from simulations of each experiment in which calculated sample concentrations were best fit to the experimental data. Left panel: Concentration gradients on an absolute concentration scale. Right panel: Concentration gradients normalized as a percentage of the maximum concentration of each curve and shown on a logarithmic scale. The concentration gradients varied from 1.3 to 6.5 log units (mean 3.64, n=9), which represents an average basal concentration of over 4000 times the apical concentration at the time of sampling.
Figure 5.
Relationship between the measured gentamicin gradient along scala tympani and the rate of volume flow along scala tympani needed to best-fit the data using the computer model. Data are shown both from the current study and a prior study which utilized the marker ion TMPA. The line fitted to the gentamicin data had a slope of −8 nl/min per decade of concentration gradient. The highest estimated rate of flow was 43 nl/min.
Figure 6.
Calculated distribution of gentamicin as a function of distance and time in the cochlea during 3 hour applications of drug to the RWM when there is no volume flow along ST (left) or when flow at 40 nl/min is present (right). Concentrations were normalized with respect the applied dose. Drug distribution is profoundly influenced by a low rate of volume flow.
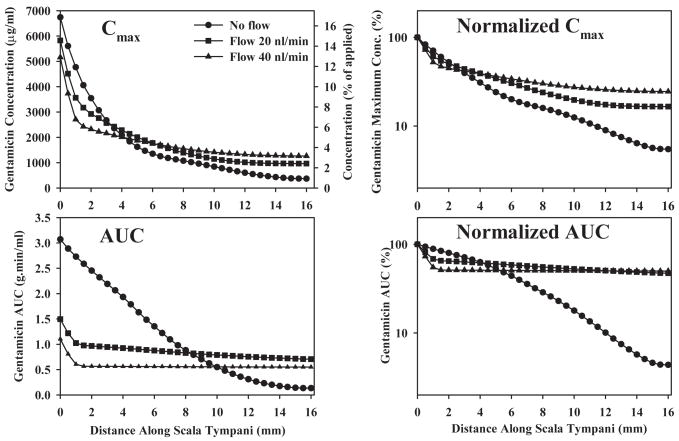
Based on the calculated drug distribution of a function of distance and time, we determined Cmax (the maximum concentration reached at a specific location) and AUC (the area under the curve of the concentration time course at a specific location). Both measures give an indication of drug dose with distance along the scala. Cmax and AUC plots for 3 flow conditions are shown in Fig. 7. Absolute values are given at the left and amplitude-normalized curves are given at the right. Changes of Cmax and AUC with distance along the cochlea are highly sensitive to even low rates of flow, with basal AUC reduced and apical AUC increased by flow rates as low as 20 nl/min.
Figure 7.
Calculated Cmax (maximum concentration of drug reached) and AUC (integrated area under the curve of drug concentration with time) as a function of distance along ST. The curves are calculated for a 3-hour drug application in guinea pigs for three rates of volume flow along ST. Absolute concentrations are shown in the left column and amplitude normalized values (relative to the location of highest value) are shown in the right column. Absolute Cmax also includes a scale showing the concentration relative to the applied dose.
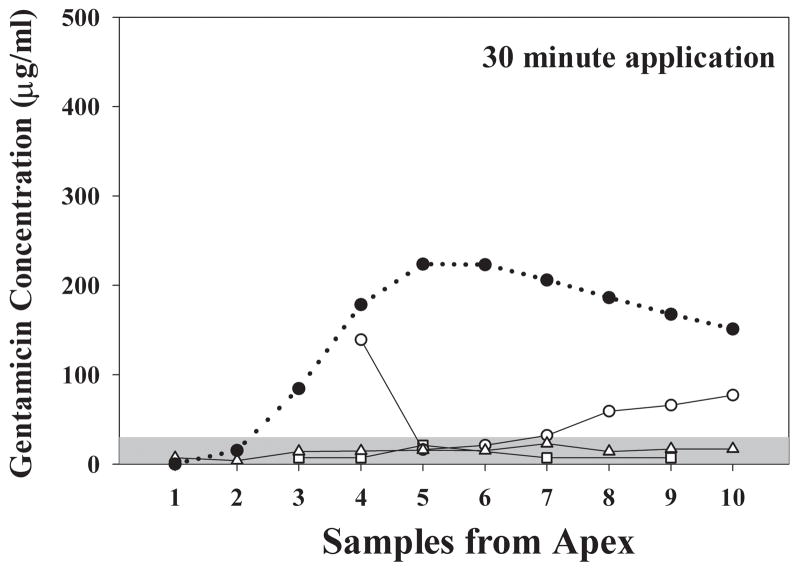
The results of shorter, 30 min applications of gentamicin in 3 animals, followed by apical sampling, are shown in Fig. 8. Measured gentamicin levels were low, in most cases below 100 lg/ml and many were below the sensitivity limit of the assay (around 30 μg/ml). Due to the low concentrations recovered, the experiments were not individually simulated. However, simulation of the 30 min delivery protocol using the mean parameters derived from 2 and 3 hour applications with non-permeabilized RW membrane properties (in accordance with the conditions of the experiments) shows that the predicted sample gentamicin concentrations were substantially higher than we observed experimentally. Either the low levels we observed occurred by chance, given the high variability of RWM permeability in other experiments and the limited sample size, or RWM permeability to gentamicin may be lower when drug is first applied and may increase with time as exposure to the gentamicin solution is prolonged.
Figure 8.
Open symbols: Gentamicin concentration of samples taken from the apex following a 30 minute application of gentamicin to the RWM. The three solid lines show individual experiments. Only low levels of gentamicin were detected. The solid symbols / dotted line show the predicted concentration of apical samples based simulation of this application protocol with the mean parameters derived from 2 and 3 hour application data. The measured sample concentrations were substantially below those expected based on longer application times.
Discussion
This study provides the first experimental verification that substantial gradients of gentamicin exist along ST following the local application of drug to the RWM. The presence of such gradients had been predicted from computer simulations 4 in which gentamicin movements into the vestibule following local applications to the RWM were analyzed3, 9, 10. The technique in which multiple samples were taken from the cochlea apex 6 allowed the gradient of gentamicin along ST to be determined, taking into account CSF entry into the basal turn of the scala. Prior methods of obtaining perilymph samples from the basal turn of ST have been shown to result in massive contamination of samples with CSF 11. Studies using such methods risk substantial underestimation of the amount of drug present due to the dilution of the perilymph sample with CSF. The sequentially-obtained samples from the apex were demonstrated to provide a valuable tool for quantifying the pharmacokinetics of substances in the cochlear fluids.
Gradients following 2 or 3 hours application of gentamicin varied from 1.3 to 6.5 log units (mean 3.64 log units). For animals with higher gradients, this represents a substantial difference in the exposure of the apical and basal regions of the cochlea to the drug, as reflected in the calculated Cmax and AUC values. This is likely to account for observed differences in hair cell losses for different cochlear locations following local applications of gentamicin 12, 13, 14, 15. Other factors, such a difference in sensitivity of basal and apical hair cells to gentamicin could also contribute to the observed differences. The demonstration that cochlear regions more distant from the RWM are exposed to lower drug levels certainly accounts for the clinical experience that in many studies, frequency regions important to speech (500 Hz to 3 kHz) can be preserved while higher gentamicin levels in the basal turn spread locally to the vestibule and suppress vestibular function 1, 16, 17. The gradients measured in humans are likely to be substantially larger than those in the guinea pig as the cochlea is almost twice the length.
Measured drug levels after 30 min applications of gentamicin provide preliminary evidence that the rate of gentamicin entry for brief applications may be lower than that found with 2 or 3 hour applications. However, the variation of RWM permeability was large, which is in accordance with the high variability of intracochlear gentamcin concentrations measured in other studies 18, 19 and for other substances, such as marker ions 11, 20, glucocorticoids 21, 22, 23, and innulin and mannitol 24. With the limited sample size in the present study, we cannot definitively conclude that RW permeability varies as a function of application time. In the analysis of data, we continued to assume that RWM permeability was constant with time for each experiment. In reality, the sampling methods used in the present study are inappropriate to detect changes of permeability with time induced by the applied drug solutions. Instead, we plan to investigate this phenomenon further using more appropriate methods that allow RWM permeability to be quantified as a function of time in individual experiments, such as marker ions in conjunction with ion-selective electrodes 20, 25 or microdialysis 19,23. Histological studies have shown that the background solution of the drug influences the amount of hair cell damage, presumably by influencing RWM permeability 13. Since the applied gentamicin solution had osmolarity and pH values that were substantially different from physiologic values, it remains possible that the status of the cells of the RWM could be altered by prolonged contact with the solution, causing permeability changes with time.
The measured drug gradient in most animals was lower than that predicted if drug spread along the scala occurred only by diffusion. In order to account for the greater amount of drug reaching the apex (thus lowering the gradient), we included a variable rate of apically-directed flow into our simulations. The range of flow rates needed to account for the results was 0 to 43 nl/min. The mean rate of 21 nl/min was comparable with the rate of 19 nl/min found in similar sampling experiments using TMPA as a marker 6 but higher than the rates of 2 and 4 nl/min derived from in vivo ion-electrode measurements 20,25. The relationship between the rate of perilymph flow needed to explain the measured data and the concentration gradient along scala tympani, as shown in Fig. 5, clearly demonstrates the potential significance of low rates of perilymph flow on drug distribution. In the absence of clearance, even low rates, such as 20 or 40 nl/min, will create nearly uniform distribution of drug along the length of the cochlea, especially for longer application times (Figs. 6 and 7). When comparing the simulations from Fig. 6 with predictions of intracochlear drug distribution for different RWM application times without longitudinal flow 26 the importance of flow becomes apparent, especially as longer times are considered. The present sampling experiments included longer drug application periods than in our previous flow-measurement studies, so the cumulative effects of flow were greater and more readily resolved. We remain uncertain, however, whether the flow rate is physiological. It is possible that flow could result from the open bulla condition under which the experiments were performed, resulting in fluid loss from the cochlea by evaporation through the bone and replacement by CSF entry. Alternatively, CSF entry into the cochlea may result from systemic dehydration. It will be important to determine whether drug distributions at longer times after application are in accordance with Fig. 6. Studies that have observed the uptake of fluorescent gentamicin in guinea pigs suggest that a gradient along the scala is seen at early time points but is no longer present at 6 hours and longer 27. This is consistent with the distribution we have observed in some of the animals in this study.
Another major factor that influences the distribution of substances in the cochlea is the degree of clearance from ST, which represents the loss to other compartments (SV, SM), loss to tissues of the lateral wall and modiolus, binding and metabolism, and losses to the vascular system. Communications with other scalae and to tissue spaces of the cochlea parallel to ST were incorporated into the model. Gentamicin that diffuses into these spaces is available to diffuse back into scala tympani during sampling, when perilymph is replaced by CSF and is quantified by modeling the data. In our analysis, there was no requirement for any additional clearance (such as to blood) to account for the sample data curves we obtained. In our previous study using the marker ion TMPA 6, an additional clearance was necessary. We conclude that the rate of gentamicin clearance from perilymph is substantially lower than that of TMPA and is too low to be resolved in experiments of a few hours duration as performed here. Quantification of gentamicin clearance will require experiments of longer duration.
The peak concentration of gentamicin detected in guinea pig perilymph reached approximately 10% of the applied concentration after 3 hours application but less than 0.5% of the applied concentration after 30 min applications. This appears to be considerably lower than the amounts detected in perilymph of human ears, where an average of 33% of the applied drug concentration was observed after 1–2 hour applications 28. These data may suggest that the RWM permeability to gentamicin may be higher in the human than in the guinea pig.
Conclusions
Our data confirm, for the first time, that gentamicin concentration gradients exist in the perilymph of ST after application to the round window membrane. Quantification of the perilymph concentration of gentamicin, and of the magnitude of concentration gradients along the cochlea show substantial variations between animals. These findings might help to explain the variability in clinical results with intratympanic gentamicin therapy, especially with respect to the adverse event of hearing loss.
Acknowledgments
The technical contributions of Jared Hartsock and Shane Hale (St. Louis) and Mrs. Sina Bäβler (Tübingen), in this study are appreciated. The study was supported by research grant RO1 DC01368 from the National Institute on Deafness and Other Communication Disorders, National Institutes of Health.
References
- 1.Chia SH, Gamst AC, Anderson JP, Harris JP. Intratympanic Gentamicin Therapy for Meniere’s Disease: A Meta-analysis. Otol Neurotol. 2004;25:544–552. doi: 10.1097/00129492-200407000-00023. [DOI] [PubMed] [Google Scholar]
- 2.Schoendorf J, Neugebauer P, Michel O. Continuous intratympanic infusion of gentamicin via a microcatheter in Menière’s disease. Otolaryngol Head Neck Surg. 2001;124:203–207. doi: 10.1067/mhn.2001.112310. [DOI] [PubMed] [Google Scholar]
- 3.Hoffer ME, Balough B, Henderson J, et al. Use of sustained release vehicles in the treatment of Meniere’s disease. Otolaryngol Clin North Am. 1997;30:1159–66. [PubMed] [Google Scholar]
- 4.Plontke SKR, Wood AW, Salt AN. Analysis of gentamicin kinetics in fluids of the inner ear with round window administration. Otology and Neurotology. 2002;23:967–974. doi: 10.1097/00129492-200211000-00026. [DOI] [PubMed] [Google Scholar]
- 5.Salt AN, Hale SA, Plontke SKR. Perilymph sampling from the cochlear apex: A reliable method to obtain higher purity perilymph samples from scala tympani. Journal of Neuroscience Methods. 2006;153:121–129. doi: 10.1016/j.jneumeth.2005.10.008. [DOI] [PMC free article] [PubMed] [Google Scholar]
- 6.Mynatt R, Hale SA, Gill RM, Plontke SKR, Salt AN. Demonstration of a longitudinal concentration gradient along scala tympani by sequential sampling of perilymph from the cochlear apex. J Assoc Res Otolaryngol. 2006;7:182–193. doi: 10.1007/s10162-006-0034-y. [DOI] [PMC free article] [PubMed] [Google Scholar]
- 7.Hobbie RK. Intermediate physics for medicine and biology. Wiley; NY: 1978. pp. 87–109. [Google Scholar]
- 8.Thorne M, Salt AN, DeMott JE, Henson MM, Henson OW, Jr, Gewalt SL. Cochlear fluid space dimensions for six species derived from reconstructions of 3-D magnetic resonance images. Laryngoscope. 1999;109:1661–1668. doi: 10.1097/00005537-199910000-00021. [DOI] [PubMed] [Google Scholar]
- 9.Balough BJ, Hoffer ME, Wester D, et al. Kinetics of gentamicin uptake in the inner ear of Chinchilla langier after middle-ear administration in a sustained-release vehicle. Otolaryngol Head Neck Surg. 1998;119:427–31. doi: 10.1016/S0194-5998(98)70097-X. [DOI] [PubMed] [Google Scholar]
- 10.Hoffer ME, Balough B, Kopke RD, et al. Morphologic changes in the inner ear of chinchilla laniger after middle ear administration of gentamicin in a sustained-release vehicle. Otolaryngol Head Neck Surg. 1999;120:643–648. doi: 10.1053/hn.1999.v120.a91762. [DOI] [PubMed] [Google Scholar]
- 11.Salt AN, Kellner C, Hale S. Contamination of perilymph sampled from the basal cochlear turn with cerebrospinal fluid. Hear Res. 2003;182:24–33. doi: 10.1016/s0378-5955(03)00137-0. [DOI] [PubMed] [Google Scholar]
- 12.Hoffer ME, Kopke RD, Weisskopf P, et al. Use of the round window microcatheter in the treatment of Meniere’s disease. Laryngoscope. 2001;111:2046–2049. doi: 10.1097/00005537-200111000-00033. [DOI] [PubMed] [Google Scholar]
- 13.Imamura S, Adams JC. Distribution of gentamicin in the guinea pig inner ear after local or systemic application. J Assoc Res Otolaryngol. 2003;4:176–195. doi: 10.1007/s10162-002-2036-8. [DOI] [PMC free article] [PubMed] [Google Scholar]
- 14.Okuda T, Sugahara K, Shimogori H, Yamashita H. Inner ear changes with intracochlear gentamicin administration in guinea pigs. Laryngoscope. 2004;114:694–697. doi: 10.1097/00005537-200404000-00018. [DOI] [PubMed] [Google Scholar]
- 15.Wagner N, Caye-Thomasen P, Laurell G, Bagger-Sjoback D, Thomsen J. Cochlear hair cell loss in single-dose versus continuous round window administration of gentamicin. Acta Otolaryngol. 2005;125:340–345. doi: 10.1080/00016480510026881. [DOI] [PubMed] [Google Scholar]
- 16.Minor LB. Intratympanic gentamicin for control of vertigo in Meniere’s disease: Vestibular signs that specify completion of therapy. Am J Otol. 1999;20:209–219. [PubMed] [Google Scholar]
- 17.Carey J. Intratympanic gentamicin for the treatment of Meniere’s disease and other forms of peripheral vertigo. Otolaryngol Clin North Am. 2004;37:1075–1090. doi: 10.1016/j.otc.2004.06.002. [DOI] [PubMed] [Google Scholar]
- 18.Hoffer ME, Allen K, Kopke RD, et al. Transtympanic versus sustained-release administration of gentamicin: kinetics, morphology, and function. Laryngoscope. 2001;111:1343–1357. doi: 10.1097/00005537-200108000-00007. [DOI] [PubMed] [Google Scholar]
- 19.Hibi T, Suzuki T, Nakashima T. Perilymphatic concentration of gentamicin administered intratympanically in guinea pigs. Acta Otolaryngol. 2001;121:336–341. doi: 10.1080/000164801300102699. [DOI] [PubMed] [Google Scholar]
- 20.Salt AN, Ma Y. Quantification of solute entry into cochlear perilymph through the round window membrane. Hear Res. 2001;154:88–94. doi: 10.1016/s0378-5955(01)00223-4. [DOI] [PubMed] [Google Scholar]
- 21.Parnes LS, Sun AH, Freeman DJ. Corticosteroid pharmacokinetics in the inner ear fluids: an animal study followed by clinical application. Laryngoscope. 1999;109:1–17. doi: 10.1097/00005537-199907001-00001. [DOI] [PubMed] [Google Scholar]
- 22.Bachmann G, Su J, Zumegen C, Wittekindt C, Michel O. Permeabilität der runden Fenstermembran für Prednisolon-21-Hydrogensuccinat. HNO. 2001;49:538–542. doi: 10.1007/s001060170078. [DOI] [PubMed] [Google Scholar]
- 23.Hahn H, Kammerer B, DiMAuro A, Salt AN, Plontke SK. Cochlear microdialysis for quantification of dexamethasone and fluorescein entry into scala tympani during round window administration. Hear Res. 2006;212:236–244. doi: 10.1016/j.heares.2005.12.001. [DOI] [PMC free article] [PubMed] [Google Scholar]
- 24.Chelikh L, Teixeira M, Martin C, Sterkers O, Ferrary E, Couloigner V. High variability of perilymphatic entry of neutral molecules through the round window. Acta Otolaryngol. 2003;123:199–202. doi: 10.1080/00016480310001042. [DOI] [PubMed] [Google Scholar]
- 25.Ohyama K, Salt AN, Thalmann R. Volume flow rate of perilymph in the guinea pig cochlea. Hearing Res. 1988;35:119–130. doi: 10.1016/0378-5955(88)90111-6. [DOI] [PubMed] [Google Scholar]
- 26.Plontke SK, Salt AN. Simulation of Application Strategies for Local Drug Delivery to the Inner Ear. ORL. 2006;68:386–392. doi: 10.1159/000095284. [DOI] [PMC free article] [PubMed] [Google Scholar]
- 27.Dai CF, Mangiardi D, Cotanche DA, Steyger PS. Uptake of fluorescent gentamicin by vertebrate sensory cells in vivo. Hear Res. 2006;213:64–78. doi: 10.1016/j.heares.2005.11.011. [DOI] [PMC free article] [PubMed] [Google Scholar]
- 28.Becvarovski Z, Bojrab DI, Michaelides EM, Kartush JM, Zappia JJ, LaRouere MJ. Round window gentamicin absorption: an in vivo human model. Laryngoscope. 2002;112:1610–1613. doi: 10.1097/00005537-200209000-00015. [DOI] [PubMed] [Google Scholar]


