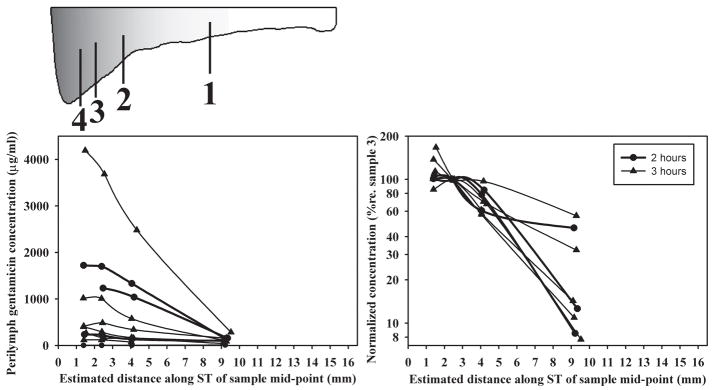
Figure 3.
Concentrations of the first four samples taken in each experiment shown as absolute values (left panel) or normalized and shown on a logarithmic scale (right panel). Samples have been plotted based on their estimated site of origin along the scala tympani, as shown by the schematic of scala tympani.

