Abstract
There has been a significant interest in developing depth-selective optical interrogation of biological tissue in general and superficial (e.g. mucosal) tissue in particular. We report an in vivo polarization gating fiber-optic probe that obtains backscattering spectroscopic measurements from a range of near-surface depths (100µm – 200µm). The design and testing was performed with polarized light Monte Carlo simulations and in tissue model experiments. We used the probe to investigate mucosal changes in early carcinogenesis. Measurements performed in the colonic mucosa of 125 human subjects provide the first in vivo evidence that mucosal blood supply is increased early in carcinogenesis not only in precancerous adenomatous lesions but also in the histologically normal-appearing tissue surrounding these lesions. This effect was primarily limited to the mucosal microcirculation and was not present in the larger blood vessels located deeper in colonic tissue.
Introduction
The phenomenon of an increase in blood supply due to the metabolic demand of cells undergoing cancerous transformation has been one of the major scientific interests since the discovery of angiogenesis. However, the local extent of the increase in blood supply as well as the stage at which it occurs is not fully understood. In the colon, angiogenesis has been reported in far earlier stages than the full fledged adenocarcinoma. Early pre-cancerous morphologies including small adenomatous polyps as well as aberrant crypt foci (ACF), the earliest detectable pre-cancerous abnormalities, were found to be supplied with increased vascularization [1, 2]. Our animal ex vivo studies have shown that adenomatous lesions in the colon are also surrounded with an early increased blood supply (EIBS), arising in histologically normal epithelial colon tissue [3, 4]. One possible explanation of this delocalized increase in blood supply involves the idea of the field effect, the concept that local carcinogenic events are mirrored by changes throughout the entire organ. In other words, the genetic and environmental milieu that results in a cancerous lesion is present, in some form, throughout the entire organ [5, 6].
Carcinomas, including colon cancer and the vast majority of other cancers, arise as epithelial malfunctions and, in their earliest stages, are localized to this topmost layer. Correspondingly, early changes in blood supply are localized to the capillaries and blood vessels supplying the affected mucosa. The investigation of these changes presents a challenge because of the difficulties associated with the near-surface tissue measurements. In the colon, for example, the mucosa is only ∼100µm thick. This depth is on the order of the light mean free path length. Therefore, mucosal interrogation requires specialized detection of photons returned after only a few scattering events, which constitutes a minute portion of light reflected from tissue. Several imaging techniques such as optical coherence tomography and confocal microscopy are capable of collecting images from <100µm penetration depth in tissue; however, these systems are typically designed to obtain high magnification images at the expense of a small field of view. This type of design is not suitable for accurate quantification of hemoglobin content due to the biologically large variability of capillary and blood vessel distributions. Therefore, a large field of view is required to obtain a representative average of the tissue sample.
Visible light spectroscopy is an attractive and simple approach which is capable of accurately quantifying tissue optical properties such as hemoglobin concentration. Several methodologies have recently been developed to enable the collection of optical signals with short penetration depths [7–9]. Amelink et al has implemented a fiber optic probe to measure short penetration depths using differential path-length spectroscopy [7]. The technique was successful in quantifying optical properties, including hemoglobin, in upper airway lesions. Others have developed fiber optic probes with short penetration depths based on angled illumination-collection geometries [10–12]. Our previous studies have utilized the principles of polarization gating which allows for the selective measurement of superficially backscattered light, corresponding to a signal that is primarily originating from the mucosal tissue of interest [8]. The principle of polarization gating relies on the fact that light undergoes depolarization as it propagates in a scattering medium. Photons that experience few scattering events tend to maintain their polarization, while photons that experience many scattering events undergo a randomization of the polarization state. As a result, a co-polarized signal (I∥: polarization axis of scattered light is parallel to that of the incident light) contains information from photons undergoing few scattering events as well as photons undergoing many scattering events, while the cross-polarized signal I⊥ dominated by multiply scattered light. The differential polarization signal is defined as ΔI = I∥ - I⊥ and isolates the scattering signal obtained from photons that have not lost their polarization information. These photons undergo few scattering events and have a shallow depth of penetration [13].
Polarization gating measurements have lead to the discovery of EIBS in ex vivo studies on animal models of colon cancer in rat tissue as well as human biopsies [3, 4]. However, it is important to verify this important discovery in vivo to eliminate the influence of potential artifacts. Furthermore, exploiting this phenomenon for cancer screening would also necessitate in vivo measurements. In this paper, we report the design of an endoscope compatible polarization gating fiber optic probe to asses mucosal blood supply in vivo. In particular, the probe was used to investigate changes in blood supply associated with human colon carcinogenesis. In principle, however, the probe can be implemented in a variety of endoscopically accessible organs. We show polarized light Monte Carlo modeling results and experimental measurements indicating that the probe design allows for measuring a signal from the capillary network immediately below the epithelium. We then present an algorithm for obtaining hemoglobin content information and demonstrate its accuracy on tissue phantoms. Finally, we apply this technology for quantifying mucosal blood supply in 125 human subjects. This study confirms that not only is blood supply increased at the foci of colonic pre-cancerous lesions, adenomas, but it also extends into the surrounding normal-appearing mucosa. These data show that this technology may be useful for improving the accuracy of colonoscopy by detecting EIBS in normal-appearing tissue and, thus, identifying regions of the colon at a higher risk for harboring adenomatous polyps.
Materials and Methods
A. Polarized Light Monte Carlo Simulations
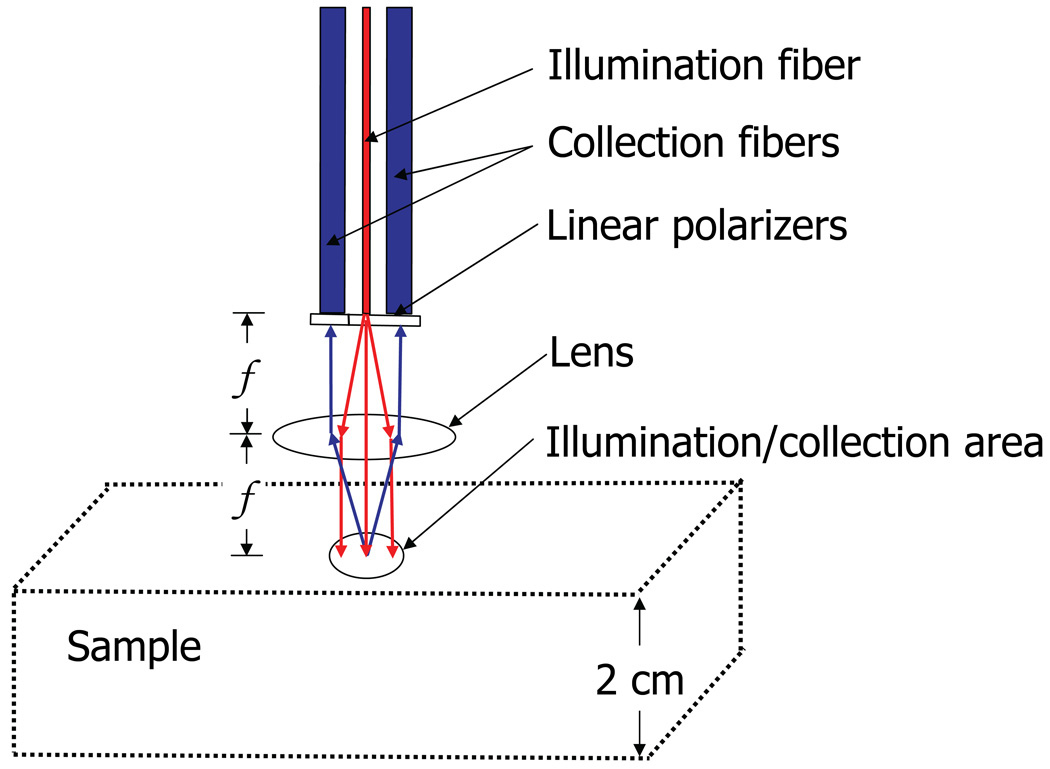
We implemented a polarized light Monte Carlo code developed by Jacques et al [14, 15] that is publicly available to simulate the polarization gating signal. This code tracks the polarization status of light as it travels through a mono-dispersed medium. Calculations of Mie theory are used to determine the optical properties of the medium, as well as the phase function of each spherical particle. The code was modified to store varying exit angles and track the maximum penetration depth of each collected photon trajectory. Photons (λ = 632.8 nm) were launched at normal incidence into a water medium (n=1.33), consisting of latex (n=1.59) spherical particles. The Stokes vectors of each photon packet were tracked and incoherently summed into corresponding bins of radius, angle, and penetration depth. Convolution was used in order to extend the beam from an infinitely narrow source to a circular illumination spot with finite area and radius R (see Fig. 1 for simulated geometry). Mueller Matrix multiplication was used to obtain the output intensity after a polarizer oriented at 0° or 90° (I∥ or I⊥ respectively) with respect to the incident polarization. The intensities of backscattered photons within the same area as the illumination spot were summed in order to obtain I∥(θ,z) and I⊥(θ,z), where θ is the collection angle and z is the penetration depth. We defined the polarization gating signal from Monte Carlo as ΔI(θ,z) = I∥(θ,z) - I⊥(θ,z) and used the z-dependence of this signal to determine average penetration depth.
Fig. 1.
Conceptualization of polarized light Monte Carlo numerical experiment. An infinitely narrow illumination fiber results in an illumination area with normal incidence onto the tissue surface. The collection area is identical to the illumination area and is controlled by the NA of the fibers and the focal length, f, of the lens.
The objective of the Monte Carlo experiment was to simulate the probe illumination/collection geometry (Fig. 1). An infinitely narrow illumination fiber with a given numerical aperture (NA) is incident on a lens spaced at one focal length. The beam of light incident on a sample is therefore collimated and has a radius determined by the NA of the incident fiber. We neglected the effects of spherical aberrations and a finite diameter of the illumination fiber. By placing the sample in the focal plane of the lens and using collection fibers with an identical NA as the illumination fiber, the collection area from the surface of the sample becomes coincident with the illumination area (i.e. the illumination and collection spots overlap). We aimed to simulate a geometry in which the illumination and collection spots completely overlap in order to minimize the resulting penetration depth of the signal, since photons scattered at shallow depths tend to emerge at small radial distances from the entry point. This geometry allows for the collection of photons with radial distances as small as zero and as large as the diameter of the illumination/collection spot. The more deeply penetrating photons are then excluded with the polarization gating method which is described in part C of the Materials and Methods.
The depth of tissue interrogated by the light collected by the probe (i.e. the penetration depth) is determined by two design parameters: the radius of the illumination/collection spot (R) and the collection angle. These design parameters may be used to control the penetration depth of the collected signal. For example, the collection angle can be controlled by the distance between illumination and collection fibers. The size of the illumination spot can independently be controlled by either changing the focal length of the lens or the NA of the fibers. Our interest was to determine the optimal parameters for measuring capillary blood supply in the colon. Thus we targeted a penetration depth from the polarization gating signal of 100µm-200µm by varying these design parameters. The average penetration depth (AP) for each tested geometry was calculated as the first moment of the probability distribution in depth, as described by equation 10.
B. Depth-selective fiber-optic probe
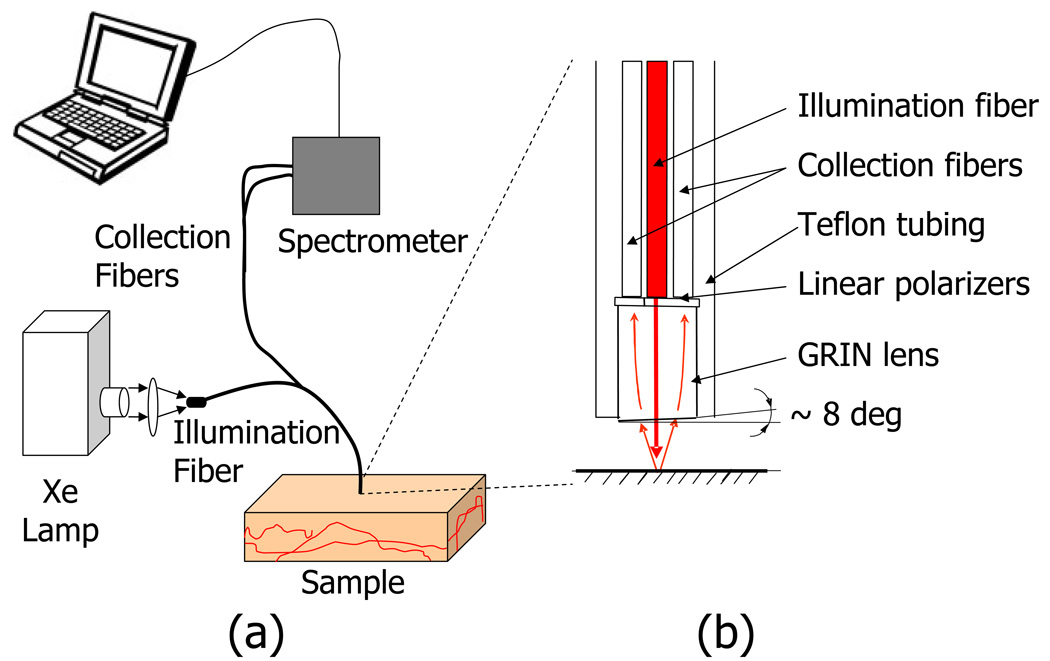
We developed an endoscope-compatible fiber-optic polarization gating probe according to the optimal design specifications determined from Monte Carlo Simulations. Fig. 2 illustrates the design of the probe, consisting of three 200 µm-core diameter multimode fibers, one of which was used as an illumination channel while the others were used for light collection. The illumination fiber was coupled to a 75W Xenon lamp (Oriel Instruments) via an achromatic lens (f = 40mm). Two thin film polarizers (TechSpec) were mounted onto the proximal tip of the probe to polarize the incident light and to enable collections of co-polarized, I∥(λ), and cross-polarized, I⊥(λ), scattering signals. A graded refractive index (GRIN) lens (outer diameter = 1.8 mm, pitch = 0.23, length = 4.35mm, effective focal length in air = 1.97mm) attached to the fiber tip served to collimate light from the illumination fiber as well as focus backscattered light from the sample into the two collection fibers. The GRIN lens also ensured that the collection fibers received scattered light from the same area (spot diameter = 0.7mm) that the illumination fiber illuminated.
Fig. 2.
Experimental setup. A fiber optic probe designed to collect backscattering angles of approximately 10°–20° with a 700µm diameter illumination/collection area. The probe consists of an input fiber which is coupled to a Xenon lamp, and two output fibers that are connected to an imaging spectrometer shown in (a). (b) is a magnified view of the probe tip, which comes in contact with the sample.
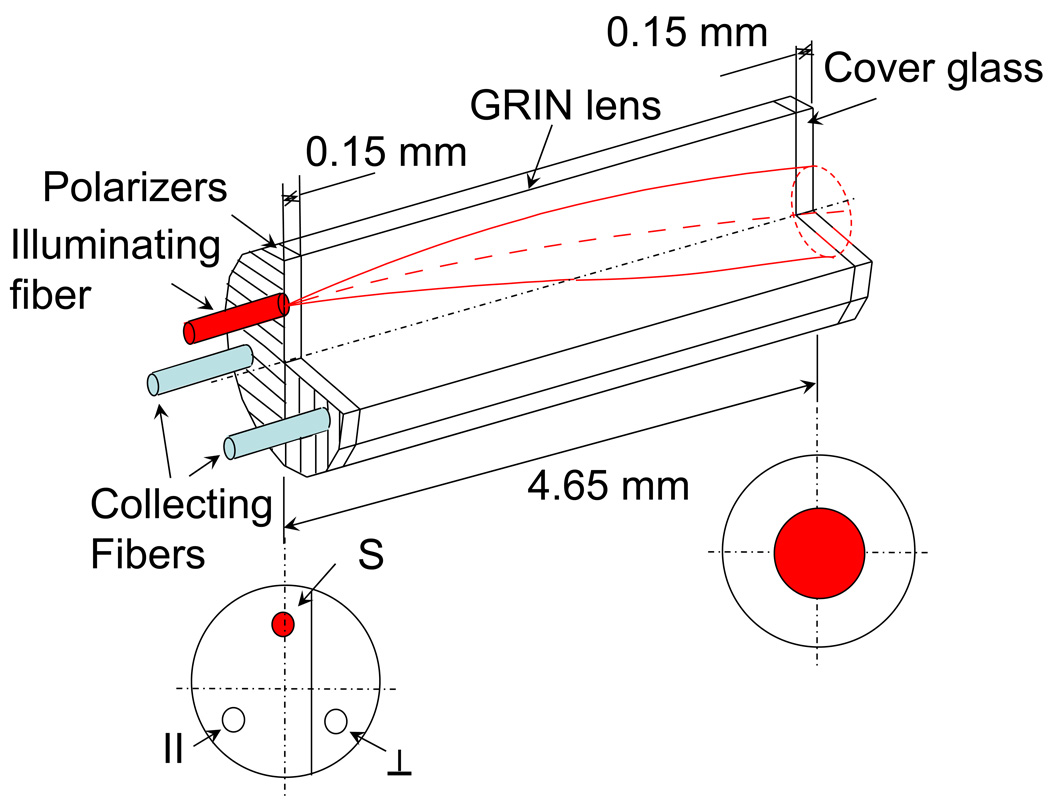
The tip of the GRIN lens was polished at an 8° angle to prevent collection of specular reflection from the probe and tissue surfaces. Fig. 3 shows a 3D schematic of the orientation of the probe fibers, polarizers, GRIN lens, and cover glass. Note that the centers of the fibers are oriented forming an equilateral triangle which centered around the axis of the GRIN lens. Therefore, a flat outer lens surface (i.e. 0° with respect to the axis of the lens) will cause a reflection that is focused between the two collection fibers. The 8 degree tilt of the outer surface of the lens moves this reflection further away from the collection fibers. The probe tip was held in a stainless steel casing with the outer diameter measuring 2.45mm. At the distal end of the probe (i.e. away from tissue), the two collection fibers were coupled to an integrated CCD spectrometer (Acton InSpectrum 150) which allowed for resolving the signal into spectral components between 450–700nm at a 1nm resolution. I∥(λ) and I⊥(λ) were simultaneously collected at collection times of 50ms. All components of the probe were made from materials approved by the Food and Drug Administration (FDA) and the probes were assembled by Fiberoptic System, Inc. (Simi Valley, CA).
Fig. 3.
Schematic of probe tip showing the fibers, sheet polarizers, GRIN lens, and cover glass. The bottom left is a cross-section view showing the position of the orthogonally oriented polarizers with respect to the source fiber (S), co-polarized collection fiber ( ∥ ) and cross-polarized collection channel (⊥). The bottom right shows the location and size of illumination area, also corresponding to the location and size of the collection areas of the collecting fibers.
C. Depth-selective measurements
The polarization gating probe allowed for the collection of reflectance signals from three penetration depths. The collection fibers of the probe obtain signals that are co-polarized (I∥) and cross-polarized (I⊥) with respect to the incident polarization direction. Since the multiple scattering of light randomizes its polarization direction, the I⊥-channel exclusively samples multiple-scattered light, while the I∥ channel samples the combination of short-traveled light and the multiply scattered light (I∥ and I⊥ collect the same amount of depolarized light). Thus, the difference between these two signals, after normalization by the collection efficiency of each channel (ΔI), isolates the shortest-traveled light. In order to minimize system effects from ambient background light as well as varying fiber coupling efficiencies, we used the following normalization scheme:
| (1) |
| (2) |
| (3) |
Where I⊥(λ), I∥(λ), and ΔI(λ) represent cross-polarization, co-polarization, and differential-polarization signals after normalization, respectively. i represents the measured signal when the probe is in contact with a sample, BG represents the background signal obtained when the probe tip is in contact with water, RF represents the signal obtained from a polytetrafluoroethylene reflectance standard (Ocean Optics), and K is a constant that represents the effectiveness of the reflectance standard at depolarizing light. The BG and RF signals were measured immediately prior to the collection of each patient or phantom data set and were used to correct for ambient light and changes in the spectral profile of the light source. The constant K is measured from open air polarization gating system [8] as < RF⊥ >/< RF∥ > over the wavelength range of 480–680nm and found to be 0.89. The use of separate reflectance standard normalization for cross-polarization and co-polarization signals accounts for differences in fiber-spectrometer coupling and fiber transmission efficiencies. An ideal reflectance standard would serve as a perfect depolarizer and backscatter the same intensity for every polarization direction. In practice, the polarization of the backscattered light is favored toward the polarization direction of the illumination. The depolarization efficiency constant, K, accounts for this un-ideal behavior of the reflectance standard. Thus, signals from three penetration depths were calculated by utilizing two independent measurements from orthogonally polarized collection channels. Note that although the I⊥(λ) signal corresponds to the longest penetration depth of the three, this signal is still superficial compared to the diffusion regime of photon scattering.
D. Quantifying Hemoglobin Concentration
In order to quantify the amount of hemoglobin absorption, we developed an algorithm based on the Beer-Lambert law. The model assumes that the variability in path length due to differences in optical properties within the sample is small for each of the three types of polarization gated signals. The validity of this assumption depends on geometry of illumination and collection spots and tissue optical properties. As discussed later, the assumption is well justified for a regime relevant to mucosal measurements. In this case, the attenuation due to absorption has an inverse exponential relationship with the absorber concentration.
| (4) |
Where Iscattering(λ) represents the scattering signal from the sample if it were devoid of absorbers, AHbO2 (λ) represents the absorption spectrum of oxygen-bound hemoglobin, AHb(λ) represents the absorption spectrum of deoxygenated hemoglobin. αHbO2 and αHb are the coefficients that represent the product of path length and concentration of oxygenated and deoxygenated hemoglobin, respectively, under the constraints of the Beer-Lambert law. The absorption spectra of HbO2 and Hb were compiled from published sources [16].
The absorption spectra were corrected for hemoglobin packing in red blood cells following methods described by Finlay et al [17]. This is necessary because when hemoglobin is confined or packed into erythrocytes and blood vessels, hemoglobin molecules within the same erythrocyte may shield each other from the incident light in the same way as erythrocytes within a blood vessel may also shield each other from incident light. Additionally, the volume of the sample not occupied by erythrocytes provides many possible light paths that do not sample any hemoglobin. The end result is a flattening of the absorption spectra for both HbO2 and Hb. In brief, the corrected absorption spectra can be found by multiplying the absorption spectrum in solution by a distortion coefficient Q whose expression is:
| (5) |
where μa is the absorption coefficient and r is the effective packing radius of hemoglobin [17]. In a spectrum measured from a solution of erythrocytes, r, corresponds to the radius of the cell but when these cells are further packed into blood vessels, r becomes a measure of Hb packing as seen by all possible light paths through a blood vessel. Thus, r has also been previously referred to as an effective blood vessel size [7, 18].
Knowledge of the “endogenous” scattering spectrum, Iscattering(λ) would allow us to apply Eqs. 4–5 and deduce αHbO2 and αHb which best fit the measured spectra, I(λ). Although the exact functional form of the scattering spectrum is not known a priory, Hb concentration can still be estimated given the fact that Iscattering(λ) is expected to be a slowly-varying function of wavelength and should not exhibit Hb absorption bands. To implement the algorithm, we assumed the scattering spectrum to be a power law dependence [19] in the form of the fractal born approximation with no upper bound on the fractal range of correlation lengths [19–21]:
| (6) |
where β is the fractal-born parameter and fits the overall rise or decline of the spectrum. For a given tissue site, five consecutively taken spectra were averaged to produce Imeasured(λ). We could then deduce Iscattering(λ) by applying equations 4–5 and fitting for the β parameter from equation 6.
| (7) |
Thus, the hemoglobin contribution to the measured spectrum is being removed using a Beer’s Law approach, where the unknown path length is part of the α-parameters. The coefficients αHbO2, αHb, r, and β are chosen such that the sum of square error between Iscattering(λ) and the fractal born approximation is minimized. This minimization was performed over the wavelength range of 480–680nm in order to include the region of the Hb absorption which differs between Hb and HbO2 as well as higher wavelengths which have relatively little absorption. The fitting is optimized by using a nonlinear algorithm in Matlab known as fminsearch. This algorithm is a simplex search method that evaluates the squared error for many possible combinations of αHbO2, αHb, r, and β until a minimum is reached. A calibration curve was used to account for the unknown pathlength and obtain hemoglobin concentration values. Note that this calibration remains accurate as long as the assumption that the total path length remains constant, which we determined to be reasonable from our Hb phantom measurements for tissue relevant optical properties.
E. Tissue phantom measurements
We conducted a series of measurements to test the sensitivity and accuracy of our probe for measuring blood content. We performed two sets of experiments: the first set of measurements was designed to quantify the penetration depth corresponding to the three polarization gating signals. The second experiment determined the accuracy with which we could calculate the blood concentrations from signals measured with the probe and how this accuracy is affected by varying optical properties. In order to do this, we created liquid suspensions that mimic the scattering and absorption properties of tissue (tissue phantoms). The scattering was accomplished with suspensions of polystyrene microspheres (Duke Scientific, n=1.59) in water. Absorption was accomplished with by dissolving Hemoglobin (Sigma-Aldrich) into the solution.
E.1. Penetration depth phantoms
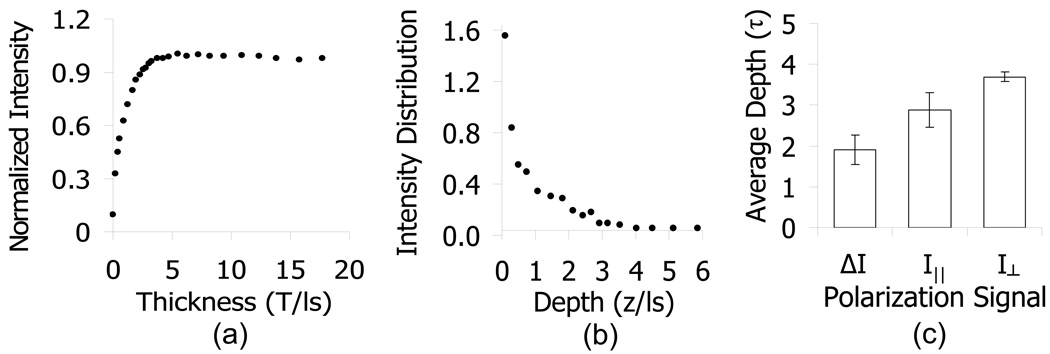
Non-absorbing phantoms with known scattering properties were utilized to determine the penetration depth of a given polarization signal (e.g. co-, cross and differential polarization signals) by varying the effective thickness of the sample. This was accomplished by varying the distance between the probe tip and the bottom edge of the phantom. As the thickness of the sample surpasses the depth-sensitivity of the probe, the intensity of the collected signal saturates to a constant value. The penetration depth of the collected signal for a particular optical property can then be deduced from the analysis of the signal intensity as a function of sample thickness T (Fig. 4a). This function is termed the saturation curve C(T).
| (8) |
Fig. 4.
Experimental verification of penetration depth. (a) shows representative data from a saturation curve experiment where the intensity is recorded as a function of the sample thickness, normalized by the maximum value (i.e. cumulative probability distribution). The intensity distribution as a function of depth in (b) is calculated by taking the derivative of the intensity vs. sample thickness curve, normalized by the total area. (c) represents average penetration depths for each of the polarization gating signals taken from samples with a range of optical properties (μs =35 – 111cm−1, μa = 0, g = 0.8 – 0.92).
The saturation curve method of characterizing the penetration depth has previously been used by our group and is described in detail elsewhere [3, 4, 8, 22]. The derivative of C(T) with respect to T is the probability of light being returned from a depth z.
| (9) |
| (10) |
The average penetration depth can then be calculated with equation 10 as the first moment of the probability function I(z) where 2cm was used as an upper bound on the depth. We performed saturation curve measurements on phantoms consisting of microspheres with diameters ranging from 0.45µm ± 3% to 0.89µm ± 3% (mean ± S.D.), corresponding to avariation in the anisotropy coefficients from g=0.8 to 0.92 and mean free path length ls = 90µm to 283µm and obtained mean penetration depths for each of the polarization gating signals.
E.2. Hemoglobin phantoms
In order to verify the accuracy and validity of our method for determining the hemoglobin concentration, we constructed a series of tissue phantoms having a range of scattering and absorption properties that is similar to that of soft tissue. We varied the scattering coefficient of 4.3µm ± 25% diameter (mean ± S.D.) spheres (g = 0.88 at λ=540) from 85 cm−1 to 200 cm−1 and added known amounts of hemoglobin (Sigma-Aldrich) in concentrations ranging from 0g/L to 15 g/L (μa = 0 to 28cm−1 at λ=540). The α-values, corresponding to the product of concentration and path-length, were calculated for each measurement and then compared with the known concentration of Hb in the solution. Thus we measured a standard calibration curve that can be used to calculate hemoglobin concentration in tissue and verify the accuracy of the measurement.
F. Human studies
This study was approved and performed in accordance with the regulations of the Institutional Review Board of Evanston-Northwestern Healthcare. 139 patients undergoing colonoscopy at Evanston Hospital were recruited. Any patient undergoing colonoscopy was eligible to join the study. No patient group was preselected or excluded. After intubation of the cecum, the probe was inserted through the accessory channel of the colonosocope and approximately 10 measurements, each requiring 5 acquisitions collected at 50 milliseconds acquisition times, were taken from the endoscopically normal mucosa in the cecum, mid-transverse colon and rectum. Measurements were collected at least 10cm away from any detected lesion. Probe readings were obtained when the probe was placed in gentle contact with the tissue. On the event of a lesion being detected by the colonoscopist, readings from the top of the lesion were taken prior to its removal. All lesions were removed using the technique chosen by the endoscopist and then sent for pathological analysis. Classifications were categorized into three major histologic groups: no dysplasia (n = 94), adenoma < 10mm in greatest dimension (n=24), and advanced adenoma (n=7). Advanced adenomas were defined by following the conventional definition including tubular adenomas > 10mm in size, adenomas with villous features, or high grade dysplasia. Subjects who did not harbor dysplasia included patients with no endoscopic findings as well as patients with benign conditions including hyperplastic polyps, divertuculosis, lymphoid, ulcerative colitis, hemorrhoids, and focal cryptitis. This group served as a negative control group. Exclusion criteria included inability to retrieve a polyp for pathology, unclear pathology report, and inability to obtain adequate spectra without artifacts such as specular reflection, the absence of physical contact with tissue due to bowel motion, or the probe tip being obscured with stool. After the exclusion criteria, 125 patients remained in the study.
Results
We will first begin with an explanation of the design considerations involved in constructing a probe with preferentially small depth selectivity in section A. We then present the results of our polarized light Monte Carlo simulations followed by an explanation of the choice of design parameters in section B. In Section C, we will present results from tissue phantoms that verify the penetration depth of the probe and the accuracy of the algorithm for quantifying hemoglobin concentration. Section D will show the results of hemoglobin measurements taken with the probe from human patients in vivo during their colonoscopy procedure.
A. Probe Design Relationship with Penetration Depth Selectivity
The penetration depth of the backscattered polarization gating signal is dependent on several parameters, which in turn determine the design of the probe. As described in earlier work [13], the shape of the probability distribution of the light emerging at the sample surface as a function of radial distance from the source, P(r), determines the penetration depth of the collected polarization gating signal. Light emerging at a small radial distance will have a shallower penetration depth than the light emerging at larger radial distances. Therefore, the shortest penetration depth can be achieved by implementing a design with coincident illumination and detection, allowing for the contribution of light with a lower limit of zero radial distance. We implement this idea by positioning a lens spaced one focal length away from the surface of the fibers and the sample (Fig. 1). A finite illumination and collection area truncates the sampled P(r) thus reducing the penetration depth of the collected signal. The penetration depth can further be controlled in this design by utilizing polarization properties of light and tuning the angle of illumination and collection. These angles are determined from the position of the illumination and collection fiber tips in the Fourier plane of the lens. Given this geometry, the penetration depth of the collected signal may potentially depend on three parameters, namely the radius of the illumination/collection spot (R), the collection angle, and the type of polarization gating signal (I∥, I⊥, or ΔI).
B. Polarized Light Monte Carlo Simulations
We employed polarized light Monte Carlo simulations to develop an understanding of the parameters that control the depth of penetration of the three polarization gating signals. The computational experiment simulating the geometry is illustrated in Fig. 1. Light emitted by an infinitely narrow illumination fiber is collimated by a lens with focal length f. The sample is positioned at the Fourier plane of the lens serving to translate position at the sample plane into angle at the fiber plane. The collection fibers have an identical numerical aperture as the incident fiber, and therefore collect light that emerges from the same area as the illumination spot. The positioning of the collection fibers in the fiber plane determines the collection angle of the light emerging from the tissue, where the collection angle is defined as the angle with which the photon emerges from the random walk with respect to the normal of the surface. Intensity as a function of penetration depth for a specified illumination/collection area, collection angle and polarization gating signal is used to calculate the average penetration depth, as described in the methods section.
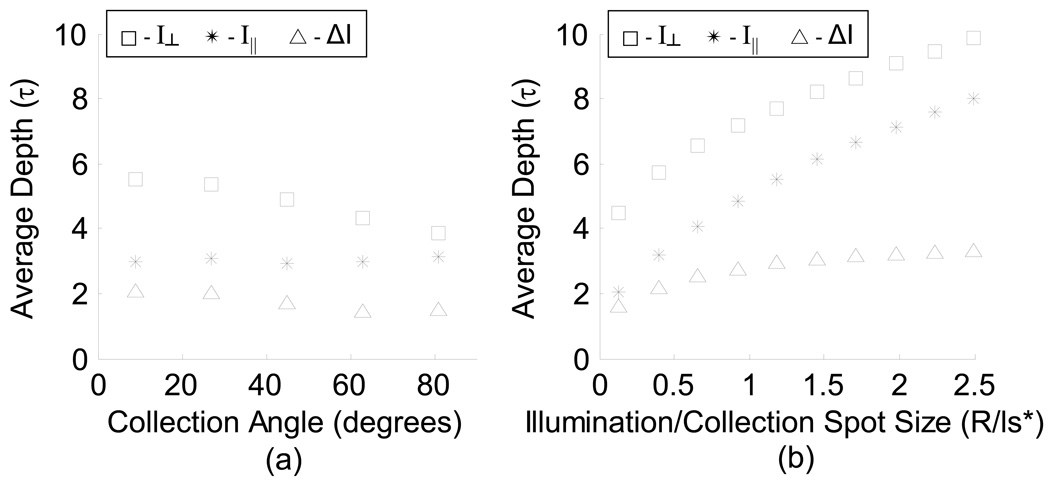
The dependence of the average penetration depth on the radius of illumination/collection, collection angle, and type of polarization gating signal is plotted in Fig. 5. There is a strong dependence of penetration depth on the radius of the illumination/collection spot for I⊥ and I∥ signals (Fig. 5b), however, the penetration depth of the ΔI signal has little dependence on R/ls* for R/ls* > 1 where ls* is the transport mean free path. An illumination/collection spots size of R/ls* < 0.5 results in the most shallow penetration depth of all three signals. The dependence of penetration depth on the collection angle is not as strong as on R (Fig. 5a). Our objective was to design a probe that allowed for measuring the scattering and absorption spectrum corresponding to the capillaries that supply colon epithelial cells. Although each epithelial cell is approximately 10–20µm, these cells are organized into crypts, ∼100µm deep. In human colon tissue, ls has been measured to be 50µm [23, 24]. Therefore, we chose a geometry which would simultaneously collect spectra from a range of small penetration depths by choosing R/ls* < 0.5. For convenience, a backscattering collection angle of approximately 14° was chosen. Experimental verification of the penetration depth was then performed on this design.
Fig. 5.
Polarized light Monte Carlo results of penetration depth for each polarization signal (scaled by ls). (a) Average penetration depth for varying collection angles for each polarization gating signal (R/ls* = 0.5). (b) Average penetration depth for varying illumination/collection spot sizes for 9 +/− 9° backscattering collection angle (medium μs = 100cm−1, μa = 0, g = 0.87).
C. Experimental Verification of Penetration Depth
Based on our simulations, we designed the probe to achieve a penetration depth corresponding to the capillaries located immediately below the epithelium, allowing for the measurement of early increased blood supply. A diagram of the probe setup is shown in Fig. 2 and a detailed schematic of the probe tip is shown in Fig 3. We employed a triangularly symmetric organization of the fibers in order to minimize the probe diameter, allowing it to fit into the accessory channel of a colonoscope. We then performed a series of saturation curve experiments, as described in the methods section, in order to validate the penetration depth of the polarization gating signals. Fig. 4a shows a typical saturation curve obtained from a non-absorbing phantom consisting of polystyrene microsphere suspensions in water. The saturation curve was obtained by measuring the collected intensity observed as a function of varying the thickness of the sample as discussed in Methods. The intensity as a function of depth, as plotted in Fig 4b, was calculated by taking the derivative of the saturation curve with respect to sample thickness, T. The average penetration depth can then be obtained from the intensity distribution function by calculating the first moment as in equation 10.
The average penetration depths for I⊥(λ), I∥(λ), and ΔI(λ) were calculated in this manner for samples with varying optical properties within the range of optical parameters relevant to tissue and are shown in Fig 4c. Signal ΔI(λ) has an average penetration depth of about 1.9·ls ∼95µm, which would include only superficial capillaries that lie just beneath the colon epithelium. Penetration depths from I∥ and I⊥ signals were found to be 2.9·ls ∼145µm and 3.7·ls ∼185µm respectively. Note that the penetration depth for any of the polarization signals is less than 4·ls, which is far less than the diffusion regime commonly defined as >ls*. This shallow penetration depth in part supports the use of the Beer-Lambert law for quantifying the hemoglobin concentration.
D. Accuracy of Hb Concentration Measurement
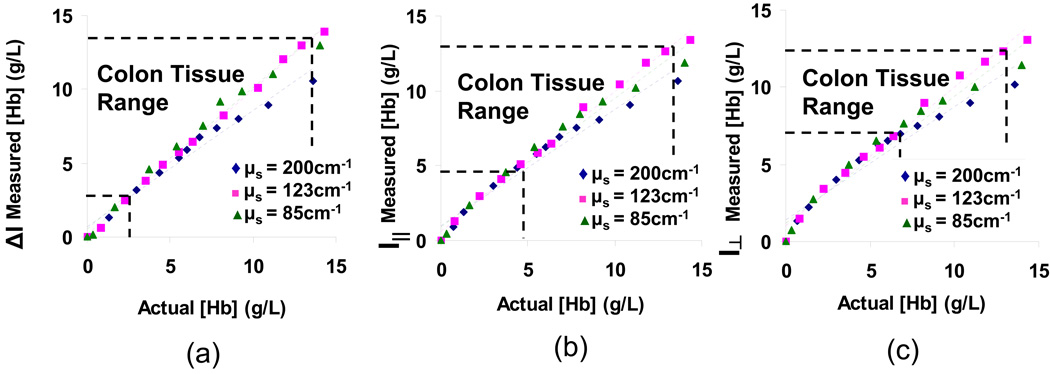
Tissue phantoms consisting of a mixture of polystyrene microspheres and hemoglobin in water were used to model both the scattering and absorption properties of soft tissue. We tested a range of scattering coefficients (μs = 85cm−1 – 200cm−1) in the range of typical values published for soft tissue, and a range of Hb concentrations, which we experimentally determined to be relevant for colon epithelial tissue measurements (μa = 0 – 28cm−1 at λ=540nm). By varying the concentration of Hb in these phantoms, we could experimentally relate the calculated α coefficients for each sample with its corresponding Hb concentration. Fig. 6 displays the results of the Hb phantom experiments for each of the polarization gating signals. The relationship between measured concentration and actual concentration fits well with a straight line for each optical property (R2 > 0.97 for signal, R2 > 0.96 for I∥ signal, and R2 > 0.94 for I⊥ signal), validating the use of the Beer-Lambert law for determining concentration. Furthermore, there is no apparent trend of hemoglobin concentration dependence on varying scattering coefficient of the phantom. Therefore, the linear fit remains an excellent model when the data are combined for all three scattering coefficients (R2 = 0.97 for signal, R2 = 0.97 for I∥ signal, and R2 > 0.96 for I⊥ signal). The error of hemoglobin concentration measurements was determined to be 7.6% within the tissue-relevant range of optical properties shown in Fig. 6. Because the calculated α coefficients represent the product of concentration and path length and the concentration is a known parameter in these phantoms, we could determine the average path-length for each of the polarization gating signals. If the lateral transport is neglected, the penetration depth can be estimated as ½ of this round trip path length. The penetration depth as calculated from the average path length was 2.2·ls, 2.6·ls, and 3.1·ls for ΔI, I∥ and I⊥ respectively translating to approximately 108µm, 132µm, and 154µm in tissue. Although assuming the penetration depth as ½ of the path length is an overestimation, the calculation provides additional verification of the shallow penetration depths of these signals.
Fig. 6.
Calibration Curves obtained for delta-polarized (a), co-polarized (b), and cross-polarized (c) signals from the probe in phantoms with varying hemoglobin, and scattering coefficient. The region within the horizontal and vertical dashed lines indicates concentrations that are typical for colon tissue (experimentally determined). The anisotropy factor was kept constant for these measurements (g=0.88 at λ=540nm).
E. In vivo Measurements
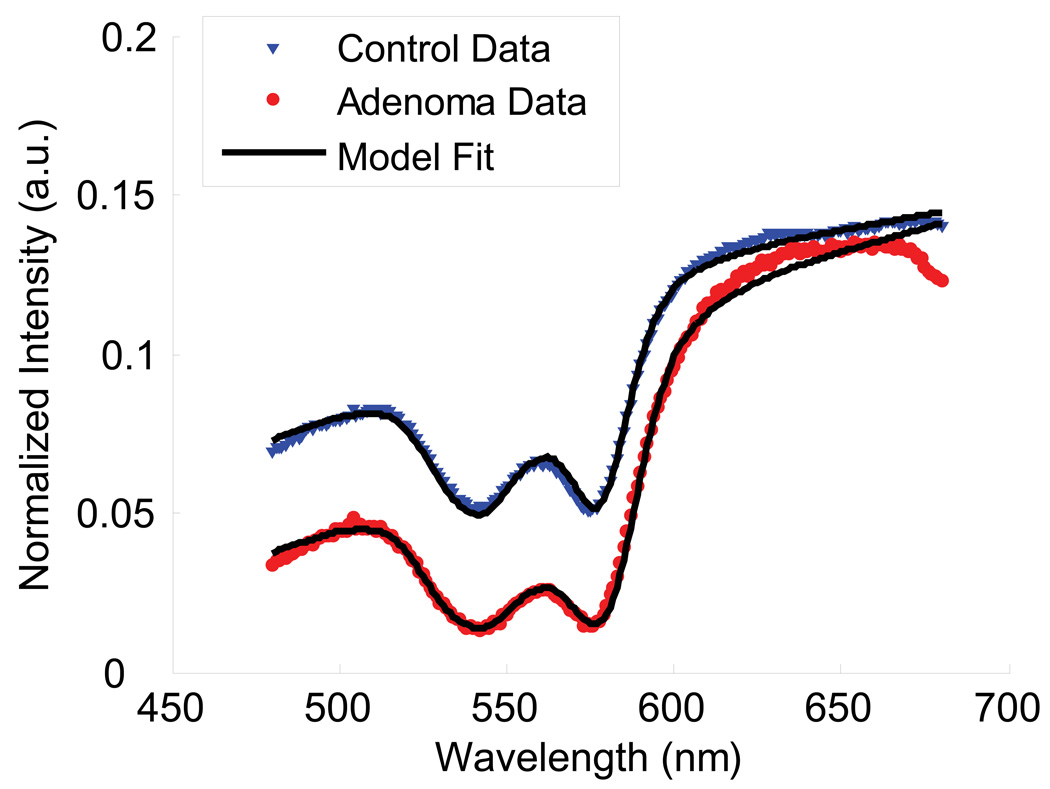
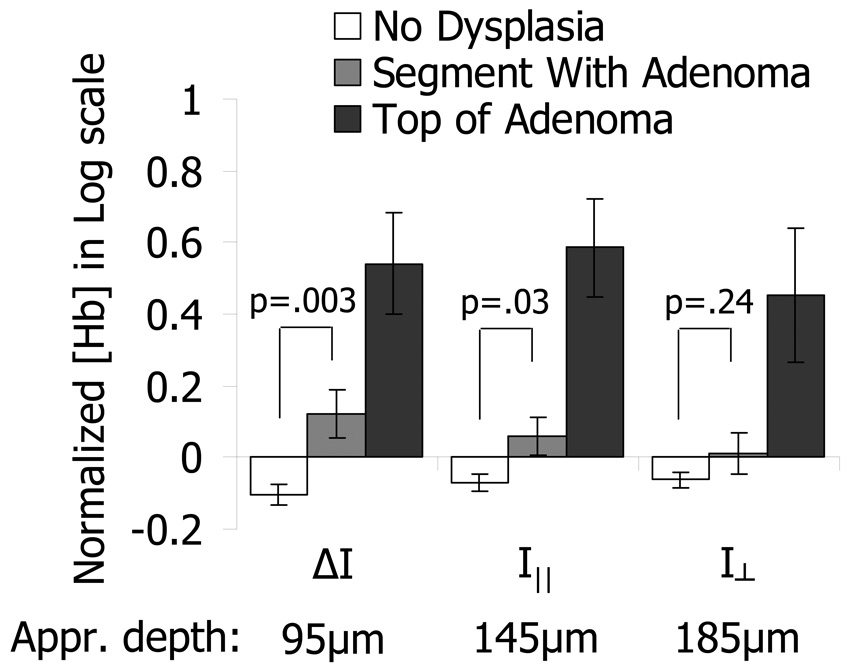
Measurements in the cecum, transverse colon, and rectum were obtained with polarization gating probes during colonoscopies of 125 human subjects. Approximately 10 measurements were obtained in the cecum, mid-transverse colon, and rectum of each patient. These measurements were taken from endoscopically normal uninvolved mucosa. In cases where lesions were detected by the endoscopist, additional measurements from the top of the lesions were also collected prior to their removal and analysis by the pathology department. Measurements were obtained from 94 patients with no dysplastic abnormalities, 24 patients with adenomatous lesions, and 7 patients with advanced adenomas. Measurements on top of lesions included 9 adenomatous polyps and 2 advanced adenoma polyps. We found that our model for the wavelength dependence of the scattering and absorption signal fit well with the experimental data (Fig. 7). The blood content in the colon was found to vary with location (i.e. cecum, transverse colon, and rectum had different average values: ANOVA p-value < 0.05) and average values from patients with no dysplasia were used as normalization constants for each respective region of the colon. After combining the patient data from all non-dysplastic patients, we found that the Hb concentration is log-normally distributed, thus we performed our statistical analysis on the natural logarithm of normalized Hb concentration values. Fig. 8 shows a comparison between Hb concentrations obtained directly from adenomatous lesions and measurements obtained within the same colonic segment as the lesion but from endoscopically normal-appearing mucosa. As expected, adenomatous lesions had higher blood content than control patients for all three polarization gating signals. Additionally, a significantly higher Hb concentration was found in the uninvolved mucosa within the same segment as an adenomatous polyp as compared to the control group (p = 0.003 for ΔI, p = 0.03 for I∥, p = 0.24 for ). This increase in Hb from uninvolved tissue, unlike the increase on top of the lesion, diminishes with depth, becoming closer to values seen in control patients at deeper depths. Therefore, a significant increase in Hb concentration was seen from the mucosa, but not from the underlying connective tissue.
Fig. 7.
Example spectra obtained from polarization gating probe in tissue. The model fit is shown as a solid line.
Fig. 8.
Probe measurements of Hb content from adenomatous lesions and uninvolved mucosa away from the lesion as compared to control patients with no dysplasia. There is a large difference between the Hb content of normal tissue from patients with no dysplasia (white bars) and adenomatous tissue (dark gray bars) for all three polarization gating signals (p<0.01). There is also a significant difference between the Hb content from control patients and uninvolved mucosa measurements from colonic segments with adenomas. This difference in normal-appearing tissue progressively diminishes for probe signals with larger penetration depths (i.e. p=0.03 for 95µm depth, p=0.24 for 185µm depth).
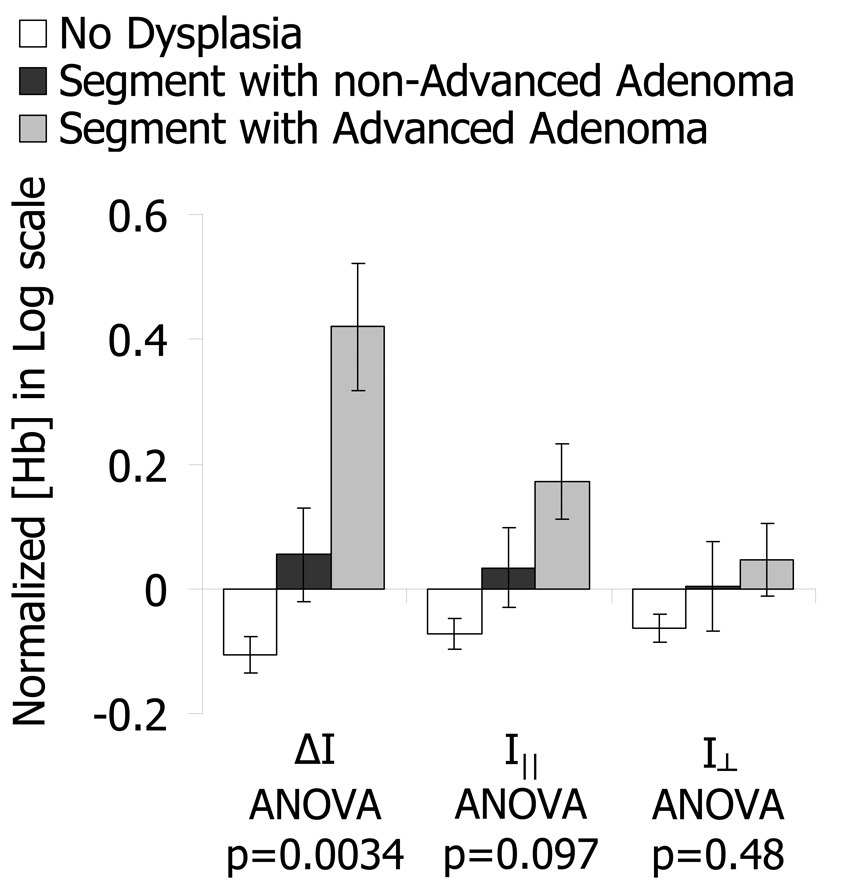
In order to explore the relationship between EIBS and the stage of pre-cancer we subdivided patients with positive findings depending on the type of adenomatous lesion found during colonoscopy: adenomas and advanced adenoma. Advanced adenoma lesions have a higher chance of progressing into cancer and are more clinically relevant for detection. Furthermore, any adenomatous lesion must first transform into an advanced adenoma prior to becoming an adenocarcinoma. Fig. 9 displays a comparison between these two stages of pre-cancer as measured from histologically normal mucosa within a 10–30cm distance of the lesion. There is an evident and statistically significant increase in Hb concentration relative to healthy control patients for advancing stages of pre-cancer in the ΔI signal corresponding to a mean penetration depth of ∼100µm (ANOVA p-value = 0.0034). This increase diminishes and becomes less significant for deeper-penetrating polarization gating signals (p=0.097 for I∥, p=0.48 for I⊥).
Fig. 9.
Comparison of Hb content from patients with varying significance of pre-cancerous lesions measured 10–30cm away from the lesion. Patients with Advanced Adenomas have the highest increase in Hb content away from the lesion. This increase in Hb progressively diminishes for polarization signals with larger penetration depths.
Discussion and Conclusions
We have developed an endoscope-compatible probe designed to measure a superficial (∼2·ls) light scattering signal for optical interrogation of mucosa in vivo. The probe was capable of detecting early increased blood supply (EIBS) associated with the field effect of colon carcinogenesis. Our polarized light Monte Carlo simulations indicate that a design with coincident illumination and detection can collect a signal from a location that is immediately below the colon epithelium. These simulations demonstrate that the penetration depth of the and I∥ strongly depend on the radius of the illumination/collection area and weakly depend on the collection angle. A small illumination/collection radius (R < 0.5/ls*) and a small collection angle (θ < 20°) results in a penetration depth of ∼96µm for the ΔI signal and penetration depths of ∼144µm and ∼185µm for I∥ and I⊥, respectively, as measured from non-absorbing phantom experiments. The penetration depth in the ΔI signal corresponds to the thickness of the mucosa containing the capillary network immediately underlying the colon epithelium. The main reasons for obtaining this shallow penetration depth are the use of the polarization gating signal, the use of an overlapping illumination/collection geometry, and the exclusion of photons that emerge at large radial distances.
The validity and accuracy of the Beer-Lambert algorithm for measuring Hb concentration was verified with absorbing mixtures of microspheres with hemoglobin. (Fig. 6). For a constant μs, the Beers law method for hemoglobin content calculation showed excellent linearity with the actual concentration (R2 > 0.94). Beers law is an approximation which is valid for small concentrations or short path lengths and works well for the given penetration depth and tissue relevant concentrations. Additionally, a range of scattering coefficients (μs = 85cm−1 – 200cm−1) does not impact the measurement (R2 > 0.95) indicating that varying scattering properties would not significantly alter the path length in tissue.
It has previously been demonstrated that there is an early angiogenic increase in blood supply in colonic precancerous lesions. This increase can be seen in aberrant crypt foci, the earliest known stage of precancer [1, 4], and can conveniently be measured optically [25]. Our findings corroborate the increase in hemoglobin in adenomatous polyps (Fig. 8). Adenomatous lesions showed a significantly higher blood content from control patients in all of the penetration depths collected by the probe. Although the range of penetration depths tested was small, the hemoglobin increase from the lesion did not exhibit a depth-dependence signifying that the indicating that the increase in blood supply within the lesion is not localized.
Most importantly, we have shown that there is a significant difference in hemoglobin content (p < .01) between apparently normal tissues located 10–30cm away from a precancerous lesion and tissue measured from a patient with no dysplasia (fig. 8). Unlike the increase in blood supply from the top of the lesion, the increase is localized to the most surface-sensitive collected signal corresponding to ∼96µm. This result supports our previously discovered early increase in blood supply from ex vivo tissues in rats and humans[3, 4, 22]. This superficial increase in hemoglobin content from the surrounding tissue correlates with the clinical significance of the lesion, being most pronounced for advanced adenomas (Fig. 9). The biological underpinnings of EIBS are most likely rooted in the result of extra NO production mediated by iNOS [26]. One interpretation is that EIBS is a manifestation of the field effect and that the genetic and environmental milieu of the colon can be quantified with capillary blood content. Another possibility is that EIBS is the result of cell signaling originating from the growing pre-cancerous lesion. Measuring this effect in vivo during a colonoscopy gives the clinician a tool for detecting the presence of a precancerous adenoma without directly visualizing the lesion. This tool may potentially be used for detecting lesions that are otherwise hidden or difficult to see thus aiding in reducing the miss rate of colonoscopies[27].
Acknowledgments
This work was supported by the National Institutes of Health under grants R01 CA109861, R01 CA128641, R01 EB003682, R01 CA112315, R01 CA118794 and the Coulter Foundation.
Footnotes
OCIS Codes: 170.3660, 170.3890, 170.6510, 170.6935, 290.5855
References
- 1.Shpitz B, Gochberg S, Neufeld D, Grankin M, Buklan G, Klein E, Bernheim J. Angiogenic switch in earliest stages of human colonic tumorigenesis. Anticancer Res. 2003;23:5153–5157. [PubMed] [Google Scholar]
- 2.Hanahan D, Folkman J. Patterns and emerging mechanisms of the angiogenic switch during tumorigenesis. Cell. 1996;86:353–364. doi: 10.1016/s0092-8674(00)80108-7. [DOI] [PubMed] [Google Scholar]
- 3.Siegel MP, Kim YL, Roy HK, Wali RK, Backman V. Assessment of blood supply in superficial tissue by polarization-gated elastic light-scattering spectroscopy. Appl Optics. 2006;45:335–342. doi: 10.1364/ao.45.000335. [DOI] [PubMed] [Google Scholar]
- 4.Wali RK, Roy HK, Kim YL, Liu Y, Koetsier JL, Kunte DP, Goldberg MJ, Turzhitsky V, Backman V. Increased microvascular blood content is an early event in colon carcinogenesis. Gut. 2005;54:654–660. doi: 10.1136/gut.2004.056010. [DOI] [PMC free article] [PubMed] [Google Scholar]
- 5.Braakhuis BJM, Tabor MP, Kummer JA, Leemans CR, Brakenhoff RH. A genetic explanation of Slaughter's concept of field cancerization: Evidence and clinical implications. Cancer Res. 2003;63:1727–1730. [PubMed] [Google Scholar]
- 6.Chen LC, Hao CY, Chiu YSY, Wong P, Melnick JS, Brotman M, Moretto J, Mendes F, Smith AP, Bennington JL, Moore D, Lee NM. Alteration of gene expression in normal-appearing colon mucosa of APC(min) mice and human cancer patients. Cancer Res. 2004;64:3694–3700. doi: 10.1158/0008-5472.CAN-03-3264. [DOI] [PubMed] [Google Scholar]
- 7.Amelink A, Sterenborg HJCM, Bard MPL, Burgers SA. In vivo measurement of the local optical properties of tissue by use of differential path-length spectroscopy. Opt Lett. 2004;29:1087–1089. doi: 10.1364/ol.29.001087. [DOI] [PubMed] [Google Scholar]
- 8.Kim YL, Liu Y, Wali RK, Roy HK, Goldberg MJ, Kromin AK, Chen K, Backman V. Simultaneous measurement of angular and spectral properties of light scattering for characterization of tissue microarchitecture and its alteration in early precancer. Ieee J Sel Top Quant. 2003;9:243–256. [Google Scholar]
- 9.Kim YL, Turzhitsky VM, Liu Y, Roy HK, Wali RK, Subramanian H, Pradhan P, Backman V. Low-coherence enhanced backscattering: review of principles and applications for colon cancer screening. J Biomed Opt. 2006;11 doi: 10.1117/1.2236292. [DOI] [PubMed] [Google Scholar]
- 10.Nieman L, Myakov A, Aaron J, Sokolov K. Optical sectioning using a fiber probe with an angled illumination-collection geometry: evaluation in engineered tissue phantoms. Appl Optics. 2004;43:1308–1319. doi: 10.1364/ao.43.001308. [DOI] [PubMed] [Google Scholar]
- 11.Skala MC, Palmer GM, Zhu CF, Liu Q, Vrotsos KM, Marshek-Stone CL, Gendron-Fitzpatrick A, Ramanujam N. Investigation of fiber-optic probe designs for optical spectroscopic diagnosis of epithelial pre-cancers. Laser Surg Med. 2004;34:25–38. doi: 10.1002/lsm.10239. [DOI] [PMC free article] [PubMed] [Google Scholar]
- 12.Wang AMJ, Bender JE, Pfefer J, Utzinger U, Drezek RA. Depth-sensitive reflectance measurements using obliquely oriented fiber probes. J Biomed Opt. 2005;10 doi: 10.1117/1.1989335. [DOI] [PubMed] [Google Scholar]
- 13.Liu Y, Kim YL, Li X, Backman V. Investigation of depth selectivity of polarization gating for tissue characterization. Opt Express. 2005;13:601–611. doi: 10.1364/opex.13.000601. [DOI] [PubMed] [Google Scholar]
- 14.Ramella-Roman JC, Prahl SA, Jacques SL. Three Monte Carlo programs of polarized light transport into scattering media: part II. Opt Express. 2005;13:10392–10405. doi: 10.1364/opex.13.010392. [DOI] [PubMed] [Google Scholar]
- 15.Ramella-Roman JC, Prahl SA, Jacques SL. Three Monte Carlo programs of polarized light transport into scattering media: part I. Opt Express. 2005;13:4420–4438. doi: 10.1364/opex.13.004420. [DOI] [PubMed] [Google Scholar]
- 16.Prahl S. Tabulated Molar Extinction Coefficient for Hemoglobin in Water. 1998 [Google Scholar]
- 17.Finlay JC, Foster TH. Effect of pigment packaging on diffuse reflectance spectroscopy of samples containing red blood cells. Opt Lett. 2004;29:965–967. doi: 10.1364/ol.29.000965. [DOI] [PubMed] [Google Scholar]
- 18.Reif R, Amorosino MS, Calabro KW, A'Amar O, Singh SK, Bigioa IJ. Analysis of changes in reflectance measurements on biological tissues subjected to different probe pressures. J Biomed Opt. 2008;13 doi: 10.1117/1.2870115. [DOI] [PubMed] [Google Scholar]
- 19.Mourant JR, Freyer JP, Hielscher AH, Eick AA, Shen D, Johnson TM. Mechanisms of light scattering from biological cells relevant to noninvasive optical-tissue diagnostics. Appl Optics. 1998;37:3586–3593. doi: 10.1364/ao.37.003586. [DOI] [PubMed] [Google Scholar]
- 20.Mujat C, Greiner C, Baldwin A, Levitt JM, Tian F, Stucenski LA, Hunter M, Kim YL, Backman V, Feld M, Muenger K, Georgakoudi I. Endogenous optical biomarkers of normal and human papillomavirus immortalized epithelial cells. Int J Cancer. 2008;122:363–371. doi: 10.1002/ijc.23120. [DOI] [PubMed] [Google Scholar]
- 21.Sheppard CJR. Fractal model of light scattering in biological tissue and cells. Opt Lett. 2007;32:142–144. doi: 10.1364/ol.32.000142. [DOI] [PubMed] [Google Scholar]
- 22.Roy HK, Wali RK, Koetsier J, Liu Y, Kim Y, Goldberg MJ, Chang SY, Horwitz J, Turzhitsky V, Backman V. Increased mucosal blood supply is an early preneoplastic marker in colon neoplasia. Gastroenterology. 2004;126:A38–a38. [Google Scholar]
- 23.Wei HJ, Xing D, Wu GY, Gu HM, Lu FJ, Jin Y, Li XY. Differences in optical properties between healthy and pathological human colon tissues using a Ti : sapphire laser: an in vitro study using the Monte Carlo inversion technique. J Biomed Opt. 2005;10 doi: 10.1117/1.1990125. [DOI] [PubMed] [Google Scholar]
- 24.Beek JF, Blokland P, Posthumus P, Aalders M, Pickering JW, Sterenborg HJCM, vanGemert MJC. In vitro double-integrating-sphere optical properties of tissues between 630 and 1064 nm. Phys Med Biol. 1997;42:2255–2261. doi: 10.1088/0031-9155/42/11/017. [DOI] [PubMed] [Google Scholar]
- 25.Zonios G, Perelman LT, Backman VM, Manoharan R, Fitzmaurice M, Van Dam J, Feld MS. Diffuse reflectance spectroscopy of human adenomatous colon polyps in vivo. Appl Optics. 1999;38:6628–6637. doi: 10.1364/ao.38.006628. [DOI] [PubMed] [Google Scholar]
- 26.Roy HK, Wali RK, Kim Y, Liu Y, Hart J, Kunte DP, Koetsier JL, Goldberg MJ, Backman V. Inducible nitric oxide synthase (iNOS) mediates the early increase of blood supply (EIBS) in colon carcinogenesis. Febs Lett. 2007;581:3857–3862. doi: 10.1016/j.febslet.2007.07.012. [DOI] [PMC free article] [PubMed] [Google Scholar]
- 27.van Rijn JC, Reitsma JB, Stoker J, Bossuyt PM, van Deventer SJ, Dekker E. Polyp miss rate determined by tandem colonoscopy: A systematic review. Am J Gastroenterol. 2006;101:343–350. doi: 10.1111/j.1572-0241.2006.00390.x. [DOI] [PubMed] [Google Scholar]


