

Abstract
Objective
We sought to determine the impact of insulin resistance short of diabetes on the arteriolar-to-venular ratio (AVR). In addition, we ascertained whether AVR was related to cerebral atrophy.
Design
Cross-sectional design
Participants
Forty-six non-diabetic subjects with normal glucose tolerance and varying degrees of insulin resistance, 43 to 77 years of age.
Methods
Insulin resistance was assessed by fasting insulin and the homeostasis model assessment. AVR was determined using digital retinal photography with a non-mydriatic camera and retinal data were analyzed using a reliable semi-automated method. Cerebral atrophy was derived by means of manual tracing and thresholding procedures on structural magnetic resonance images.
Main outcome measures
AVR, cerebral atrophy
Results
We found that hyperinsulinemia negatively impacted on AVR. Furthermore, AVR was associated with cerebral atrophy. Both these findings were independent of the effects of age and hypertension.
Conclusions
These novel findings indicate that insulin resistance short of diabetes and independent of age and hypertension has a negative impact on retinal vessel health. Moreover impaired retinal vessel health was related to brain atrophy also independent of hypertension and white matter hyperintensities. Given the connections between retinal and cerebral vasculature, this may offer a partial explanation for the presence of cognitive and brain abnormalities among individuals with insulin resistance.
Keywords: Retinal vessels, AVR, insulin resistance, insulin, cerebral atrophy, brain
Recent developments in digital retinal photography and in semi-automated methods to process those images allow the retinal vasculature to be viewed and evaluated directly, thus offering a unique opportunity to noninvasively investigate the effects of disease or physiological parameters on the retinal microcirculation. A commonly used metric has been the retinal arteriolar-to-venular ratio (AVR), with a smaller AVR suggesting retinal microvascular pathothology. Retinal and cerebral blood vessel networks not only share similar pattern of vascularization during embryonic development, but also share a blood supply and vascular regulatory processes. 1;2 Furthermore, retinal arterial changes correlate with cerebral small vessel disease and a close correlation between retinal and cerebral pathology has been demonstrated in autopsy studies.3–5 Therefore, retinal vessels may perhaps be used as a readily accessible marker of cerebral microvascular health.
There is clear evidence of retinal microvascular abnormalities in type 2 diabetes.6 In addition, AVR has been a useful predictor of incipient type 2 diabetes.7;8 Apart from diabetes, retinal vascular health is affected by a number of factors that are often associated with diabetes, such as hypertension, dyslipidemia, inflammation, and obesity.9 However, it remains unclear how insulin resistance, prior to the stages of pre-diabetes that are marked by impaired glucose tolerance or elevations in fasting glucose levels, impacts on AVR. With an ever growing number of Americans being overweight or obese,10 over 50% of middle-aged and elderly individuals have some degree of insulin resistance and represent a group where retinal health has not been well characterized.11
The impact of hypertension on retinal vascular health has been extensively studied, and the literature is fairly consistent in reporting AVR reductions.12–14 It is interesting to note that AVR reductions among individuals with hypertension have been associated with measures of MRI-derived brain atrophy.3;15
In addition to hypertension, abnormalities in lipids have also been shown to affect retinal vasculature. Hypercholesterolemia may cause both functional and structural changes in the peripheral microvasculature and epidemiological studies show that among individuals with type 2 diabetes, elevated serum lipid levels are associated with the development of hard exudates and macular edema.4;16;17 There are fewer data regarding the retinal vascular effect of dyslipidemia in patients without type 2 diabetes, but there is some evidence that the association between dyslipidemia and AVR might involve endothelial dysfunction and inflammation.4;12
There is now emerging evidence that retinal microvascular abnormalities are associated with indices of pro-inflammation,18 perhaps due to the effects of inflammation on endothelial function.19 Although inflammation has been associated with low AVR, these effects are difficult to separate from hypertension, diabetes, and obesity, all conditions known to be associated with inflammation.20;21
The impact of obesity on the retinal vasculature has not been well characterized. There is evidence that obesity is a risk factor for the development of retinopathy among individuals with type 2 diabetes,4 but this is likely because obese diabetics are more likely to be in poorer glycemic control. However, it is important to note that among individuals without overt diabetes obesity has also been associated with higher rates of retinopathy and, even among non-hypertensive subjects, with retinal venular dilatation.17;22
To our knowledge previous studies have not explored the impact of insulin resistance on retinal vasculature, while accounting for other potential effects such as hypertension, dyslipidemia, and/or obesity. Furthermore, no study has simultaneously evaluated insulin resistance, retinal vasculature, and MRI-derived measures of brain atrophy in the same group of study subjects. The main goal of this study was to examine the relationship between retinal AVR and fasting insulin levels among non-diabetic individuals with varying degrees of insulin resistance. In addition, we sought to ascertain the nature of the relationship between retinal AVR and MRI-derived measures of cerebral atrophy, above and beyond the impact of insulin resistance.
MATERIALS AND METHODS
Study population
Forty-six non-diabetic subjects with normal glucose tolerance, but varying degrees of insulin resistance, between the ages of 43 and 77, were consecutively evaluated in our center as part of studies on glucose regulation and cognitive functioning. Subjects represent a typical research clinic population and were not drawn randomly from the general population. Study subjects underwent medical, neurological, psychiatric, neuropsychological, endocrine, brain MRI, and retinal evaluations. Individuals with significant neurological, medical (other than hypertension, dyslipidemia, or insulin resistance), or psychiatric (depression, alcohol or other substance abuse) illness were excluded from participation in the study. All study subjects gave written informed consent to participate and were compensated for their time and inconvenience. This study was approved by the Institutional Board of Research Associates of the New York University School of Medicine.
PROCEDURES
Bloods and Assessment of Insulin Resistance
All study subjects had a blood sample taken after a 10-hour overnight fast for the assessment of glucose and insulin levels, lipids, and inflammatory markers (C-reactive protein and fibrinogen) levels. Glucose was measured using a glucose oxidase method (VITROS 950 AT, Amersham, England), insulin by chemiluminescence (Advia Centaur, Bayer Corporation), and C-reactive protein was measured in plasma using an enzymatic immunoassay (Vitros CRP slide, Ortho Clinical Diagnostics). Fasting glucose and insulin values were used to compute the homeostasis model assessment index (HOMA),23 which has been validated against clamp assessments as a valid measure of insulin sensitivity.24;25 Both the fasting insulin level and the HOMA were used as variables of interest.
Definition of hypertension
Sitting blood pressure was measured on two separate occasions with a random-zero sphygmomanometer and an appropriate adult cuff size during one of the visits to our facility. The first reading was performed at 8:30 am, 30 minutes after the subjects arrived. A second reading was obtained at 1:45 pm. These two readings were averaged. Participants with either a systolic BP ≥ 140mmHg or a diastolic BP ≥ 90 mm Hg were defined as having hypertension. In addition, individuals being treated with antihypertensive medication (n=13) at the time of their evaluation were also defined as having hypertension, irrespective of their blood pressure readings.
Assessment of obesity
Body mass index was used as a measure of obesity. Body mass index was computed as the weight in kg divided by the square of the height in meters.
Retinal vessel caliber measurements
Digital retinal photography was performed using a non-mydriatic 45 fundus camera (Canon CR4-45NM, Canon EOS Rebel 6.1MPix), not more than 2 weeks apart from the fasting bloods assessment. Subjects were seated in a dimly lit room for 5–10 minutes to allow the pupil to dilate by dark adaptation. In general, pupillary dilation of 4 mm or greater will allow an optimal image to be taken. By having the subject follow a target, the photographs were centered on the optic disc. Field location and image focusing were accomplished by using the small camera screen. After the photograph was taken, it was immediately loaded onto a laptop computer to assess the quality of the pictures and determine whether additional pictures were needed. The digital photographs were cropped, contrast-enhanced by grayscale conversion, and red-free (green) filtered to enhance vessel edge definition.
Vessel Measurement Procedure
Utilizing a standardized protocol on the cropped, contrast-enhanced and filtered images, the vessels were measured with image analysis software developed in-house by the following procedures:
The optic disc borders were marked by placing an appropriate sized circle along the margin of the disc. Based on the size of this circle, the software automatically computes the diameter of the disc. Based on pathologic series we know that the average disc diameter is about 1,850 micro meters and this was used to estimate the absolute size of the vessels without having to refract the eye and account for refraction differences across subjects.26 After the placement of the first circle on the perimeter of the disc, the operator then places two other larger concentric circles at 0.5 and 1.0 disc diameters out from the disc margin to create zones A and B. Please refer to Figure 1.
The rater then identifies each vessel in zone B as an arteriole or venule using the original color photographs for reference. The rater then selects the straightest possible segment of each vessel (as close as possible to the center of zone B). Upon selection of any one segment, the software program produces 5 equidistant lines orthogonal to the segment of vessel selected, which transverse the vessel (see Figure 1). The pixel intensity profile for each of these five lines, which are used to calculate the width of the vessel, are displayed in turn (see box within Figure 1 for an example of one of those profiles). Based on the displayed profile the operator can accept or decline each measurement. Utilizing the accepted profiles (a minimum of 3 for any one vessel segment) the program then calculates the average width of that vessel.
The process described in the previous section is repeated for the largest 6 arterioles and 6 venules within zone B. The software then combines the individual measurements into summary indices, the central retinal arteriolar equivalent for 6 arterioles (CRAE-6) and the central retinal venular equivalent for 6 venules (CRVE-6), based on the Revised Parr-Hubbard formula for summarizing retinal vessel diameters, where w1 and w2 are the narrowest and widest vessel branches (arteriole or venule) for that eye respectively:
Figure 1.

Cropped and red-free retinal photograph showing the outline of the optic disc (blue) and circles at 0.5 and 1.0 disc diameters (yellow and green respectively) out from the disc margin, thus creating zone A and zone B. The red arrow points from the 5 equidistant lines sampling the artery segment to the corresponding profile generated by one of those lines.
By pairing up the largest vessels with the smallest in an iterative procedure, these formulas can derive a single number called a central vessel equivalent.26;27 This reflects the average arteriolar and venular diameters of that eye whiles taking into account branching patterns of the retinal vessels. Arteriolar and venular vessel equivalents can be further expressed as AVR. An AVR of 1.0 suggests that arteriolar diameters were, on average, the same as venular diameters in that eye, whereas a smaller AVR suggests narrower arterioles.28;29
Retinal vessel measurements were performed on both eyes of all participants when possible and then averaged. Mean AVR, mean CRAE, and mean CRVE were then used in our analyses.
Our method is highly reproducible. We tested the inter-rater reliability by having two raters (AT and SR) independently rate 27 randomly selected digital photographs. The intraclass correlation coefficients were 0.83 for CRAE, 0.88 for CRVE, and 0.89 for AVR, indicating a high degree of reliability between raters.
Magnetic resonance imaging
We utilized both a Magnetization Prepared Rapid Gradient Echo (MP-RAGE) and a Fast Fluid Attenuated Inversion Recovery (FLAIR) sequences to exclude gross pathology and allow the measurement of global atrophy. The FLAIR sequence parameters are: TR 9000 ms; TE 97 ms; TI 2500 ms; acquisition matrix 256 × 256; FOV 210; 50 slices; slice thickness 3 mm; no gaps; NEX 1; flip angle 180 degrees. White matter pathology shows up as a hyperintense or white signal on FLAIR images. The MP-RAGE sequence parameters are: TR 1300 ms; TE 4.38 ms; TI 800 ms; flip angle 15°; acquisition matrix 256 × 256; FOV 256 mm; NEX 1; 192 slices and slice thickness of 1.0 mm. The MP-RAGE study was used to determine the intra-cranial vault size and a measure of overall (global) atrophy (GA). All cases were blinded for the MRI analyses; raters were unaware of subject identity or the results of the retinal measurements.
Volumetric analysis of the MRI data
The intra-cranial volume (ICV) was obtained by measuring the supratentorial compartment by following the margins of the dura and tentorium. We used a thresholding procedure to estimate the CSF portion of this intracranial vault volume, which was then used as a measure of GA. To account for individual variability in brain size, the measure of global atrophy, the cerebrospinal fluid (CSF) volume within the intracranial vault, was residualized to ICV.
White matter hyperintensities
FLAIR images were used to quantify white matter disease and rule out primary neurological disease. The white matter hyperintensities were rated according to the modified Fazekas scale, which assigns scores ranging from 0 to 3 for periventricular and deep white matter hyperintensities.30 Summed scores of periventricular and deep white matter hyperintensities for each subject were computed and used in the analyses.
Statistical Analyses
Partial correlation analyses were used to establish associations between retinal measurement indices and brain variables (cerebral brain atrophy, white matter hyperintensities), as well as between retinal measurement indices and physiological measures. In order to ascertain the relative contribution of insulin function on AVR, we used linear regression analysis with AVR as the dependent variable. Established confounds were forced in the first step. In the second step, we entered markers of glucose regulation, insulin resistance, as well as additional potential confounds in a stepwise fashion. Inter-rater reliability for the AVR measurements was established by intraclass correlation analyses.31 Data were analyzed using SPSS for Windows, version 12.0 (SPSS Inc., Chicago, Ill., USA).
RESULTS
Demographics
The characteristics of the study population are summarized in Table 1. Overall participants were middle-aged, approximately half male and female, and slightly overweight.
Table 1.
Characteristics of Study Subjects (n=46)*
| Age (years) | 60.6 ± 8.2 (43.1 – 77) |
| Gender | 21 F/25 M (45.6 % Female) |
| Body mass index (kg/m2) | 26.6 ± 6.2 (18 – 52) |
| Hypertension (yes/no) | 15/31 |
| Triglycerides (mg/dl) | 109.11 ± 63.11 (31 – 356) |
| High density lipoprotein (mg/dl) | 53.1 ± 15.3 (27 – 98) |
| Fasting Glucose (mg/dl) | 81.1 ± 10.7 (59 – 111) |
| Fasting insulin (μU/ml) | 7.7±4.50 (1.00 –19.00) |
| HOMA | 1.6 ± 1.0 (0.14 – 3.99) |
| C-reactive protein (mg/dl) | 2.3 ± 2.3 (0.2 – 9.3) |
| AVR | 0.69 ± 0.07 (0.56 – 0.9) |
| CRAE (μm) | 178.31 ± 20.89 (139.86 – 219.87) |
| CRVE (μm) | 259.87 ± 31.82 (206.40 – 327.52) |
| Global Atrophy (cc) | 103.93 ± 42.92 (47.01 – 207.0) |
Values are given as mean ± standard deviation (range)
HOMA= homeostasis model assessment index
AVR=arteriolar-to-venular-ratio
CRAE= central retinal arteriolar equivalent
CRVE= central retinal venular equivalent
Impact of Hyperinsulinemia on Retinal Vessel Indices
After controlling for age, gender and hypertension, correlational analyses revealed that AVR was significantly associated with body mass index (r= 0.39, p< 0.01), fasting insulin (r= −0.35, p<0.025) and HOMA (r= −0.33, p<0.04). However, arteriolar (CRAE) or venular (CRVE) diameters were not associated with any of those parameters (i.e., insulin: CRAE: r=−0.227, p=0.130; CRVE: r=0.084, p=0.578). Based on these findings, we then ran linear regression analyses with AVR as the dependent variable, in order to determine the relative contribution of markers of insulin function on AVR. Age, gender and hypertension, which are known to affect retinal vasculature 12;32;33 were forced in the first step. In the second step, we entered markers of insulin resistance (HOMA, fasting insulin levels), fasting glucose, as well as potential confounds such as markers of proinflammation (C-reactive protein, fibrinogen), body mass index, and lipids (triglycerides, high density lipoprotein) in a stepwise fashion. Fasting insulin level significantly entered the model after accounting for the potential confounds. After accounting for age (final model: β= −0.002, t= −1.62, p= 0.12), gender (final model: β= 0.04, t= 2.46, p=0.02), and hypertension (final model: β= −0.05, t=−2.60, p= 0.012) in the first step, which together explained 32.6% of variance (F change= 6.113, p= 0.002) in AVR; fasting insulin explained an additional 12.6% (F change= 8.466, p=0.006) of the variance in AVR (final model: β= −0.006, t=−2.90, p=0.006).
White matter hyperintensities and their associations with AVR
Twenty-two subjects had no periventricular white matter hyperintensities; nine received a rating of 1 and 11 a rating of 2. No participant received a rating of 3. For the deep white matter, 18 subjects showed no evidence of hyperintensities, 19 received a rating of 1, two received a rating of 2 and 3 subjects had a rating of 3, respectively. The average hyperintensity summed score was 1.50 ± 1.49 (range: 0–5), which was inversely correlated with AVR (r=−0.370, p=0.016), and this was independent of hypertension (r=−0.302, p=0.055).
Association between AVR and cerebral atrophy
Correlation analyses revealed that cerebral atrophy was specifically inversely associated to AVR (r= −0.464, p= 0.001), and this was independent of age, gender, hypertension, white matter hyperintensities, and insulin levels (all partial correlations with p ≤ 0.005).
DISCUSSION
In this study we have established for the first time that elevations in insulin levels among non diabetic individuals with normal glucose tolerance negatively impact retinal vessel integrity as measured by AVR. It is of note that this effect on AVR existed above and beyond the impact of age, gender, and hypertension. Furthermore, we found that AVR was associated with cerebral atrophy, and this relationship was also independent of the effects of age, gender, hypertension, and white matter hyperintensities (which may indicative of microvessel disease in the white matter).
We found that age, gender and hypertension combined (with hypertension being the strongest factor) explained 32.6% of variance in AVR. This is consistent with previous reports demonstrating the negative impact of hypertension on the retinal vessels, with intimal thickening, medial hyperplasia and hyalinization, and sclerosis of the retinal arterioles having been described.2;8;34 Elevations in blood pressure may result in vasoconstriction,2;35;36 and this may in turn lead to higher stress on the vessel wall and the pathologic changes mentioned above.
After accounting for hypertension, age, and gender, fasting insulin levels explained an additional 12.6% of variance on AVR, suggesting that elevations in fasting insulin levels has an additional and independent effect on retinal vessel health. These novel findings, documenting the negative impact of elevated peripheral insulin levels on retinal vessel health, are consistent with the literature documenting the adverse effects of insulin resistance on the peripheral vasculature. Under physiological conditions, insulin has vasodilatory functions on the vasculature,37 however, in insulin resistance, insulin-mediated vasoprotection can be lost or even reversed.38 Furthermore, recent data indicates that insulin-mediated vasodilatation is impaired among obese individuals with insulin resistance and among those with type 2 diabetes.39–41 Thus, based on the parallels between our findings and what is known about the effects of insulin resistance on peripheral vessels, and given our understanding about the similarities between retinal and cerebral vessels,4;5 one could speculate that insulin resistance could have similar effects on cerebral vasculature. Indeed, insulin resistance has been associated with cognitive decrements and we have hypothesized a potential vascular mechanism for those impairments.42;43;44
Adding to the link between retinal vasculature abnormalities and brain atrophy is our finding that a higher AVR, indicative of better retinal vessel health, was strongly associated with less cerebral atrophy. It is important to note that after accounting for fasting insulin levels (which were associated with AVR) and age, hypertension, and white matter hyperintensities (which have all been associated with cerebral atrophy) there was still a strong association between AVR and cerebral atrophy. We have proposed that the compromised vascular reactivity that is associated with insulin resistance may result in decreased metabolic substrate delivery to the brain, perhaps contributing to the atrophy observed.44 However, the mechanism(s) for our findings of insulin-independent associations between lower AVR and brain atrophy remain to be better characterized.
In addition to the association with insulin, although not sufficiently strong to enter the regression model, AVR was also weakly associated with obesity (body mass index). This is not surprising, given that obesity frequently precedes insulin resistance and the accompanying elevations in insulin levels.45 Of importance here is the fact that we did not find any association between AVR and markers of proinflammation (fibrinogen and C-Reactive Protein), which are also elevated in obesity,46 and which some authors have found to be associated with retinal vessel health,18 This further highlights that the effect of insulin resistance on AVR reported here, is specific, and not simply part of the spectrum of co-morbidities often associated with obesity.
Although this study has many strengths, such as identical examination procedures across all subjects, detailed, standardized, and reliable retinal vessel measurements, image data processing blind to group membership as well as endocrine and blood pressure measurements, it has some limitations. Retinal photographs were not taken synchronized to the cardiac cycle, which can add variability to the measurement, as the retinal vessels react to the actual pulse pressure.13;47 However, the retinal photographs were likely randomly distributed within the cardiac cycle, and any possible bias would likely be reduced by having sufficient numbers of subjects. Another possible weakness is that we also did not assess intraocular pressure. However, this is mostly a theoretical concern since no associations between retinal vessel diameters and intraocular pressure were found in the Beaver Dam eye study.48
In conclusion, we have shown that reductions in retinal AVR are associated with specific elevations in insulin levels, beyond the impact of hypertension. Furthermore, we showed that retinal AVR is associated with cerebral atrophy and that this effect is independent of hypertension, age, white matter hyperintensities, and insulin levels. Given that retinal vessels share many characteristics with cerebral vessels, these data offer some support for the contention that some of the cognitive and brain abnormalities described among individuals with insulin resistance may be mediated by the impact of insulin resistance on the cerebral vascular bed.
Future studies should further characterize the relationships between insulin resistance, inflammation, and retinal vessels by utilizing a longitudinal approach so as to clarify cause and effect. Furthermore, studies involving obese children should also be conducted, a population that is likely to have significant insulin resistance, but not yet have overt micro-vessel disease.
Figure 2.
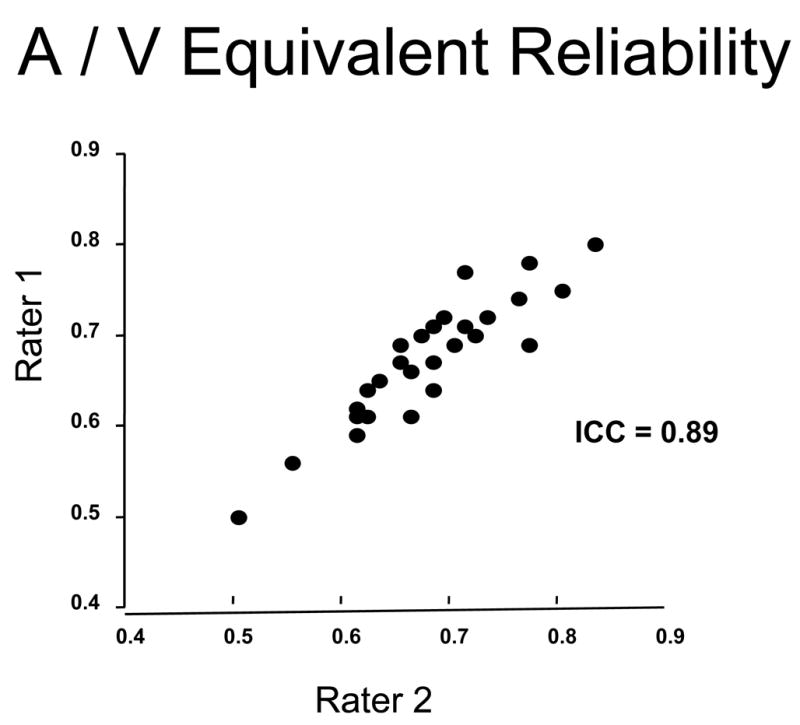
Plot of correspondence between two independent raters (AT and SR) in the measurement of arteriolar-to-venular-ratio (AVR) in 27 subjects. The inter-rater reliability was excellent with an intra-class correlations coefficient (ICC) of 0.89.
Acknowledgments
Financial Support: The study was supported by grants from the National Institutes of Health DK064087 and P30-AG-08051 and support from the NYU General Clinical Research Center (NCRR M01 RR00096).
Footnotes
No authors have any financial/conflicting interests to disclose.
Publisher's Disclaimer: This is a PDF file of an unedited manuscript that has been accepted for publication. As a service to our customers we are providing this early version of the manuscript. The manuscript will undergo copyediting, typesetting, and review of the resulting proof before it is published in its final citable form. Please note that during the production process errors may be discovered which could affect the content, and all legal disclaimers that apply to the journal pertain.
References
- 1.Patton N, Aslam T, MacGillivray T, et al. Retinal vascular image analysis as a potential screening tool for cerebrovascular disease: a rationale based on homology between cerebral and retinal microvasculatures. J Anat. 2005;206:319–48. doi: 10.1111/j.1469-7580.2005.00395.x. [DOI] [PMC free article] [PubMed] [Google Scholar]
- 2.Wong TY, Klein R, Sharrett AR, et al. Retinal arteriolar diameter and risk for hypertension. Ann Intern Med. 2004;140:248–55. doi: 10.7326/0003-4819-140-4-200402170-00006. [DOI] [PubMed] [Google Scholar]
- 3.Kwa VIH, Van Der SJ, Stam J, et al. Retinal arterial changes correlate with cerebral small-vessel disease. Am J Ophthalmol. 2002;59:1536–40. doi: 10.1212/01.wnl.0000033093.16450.5c. [DOI] [PubMed] [Google Scholar]
- 4.Nguyen TT, Wong TY. Retinal vascular manifestations of metabolic disorders. Trends Endocrinol Metab. 2006;17:262–8. doi: 10.1016/j.tem.2006.07.006. [DOI] [PubMed] [Google Scholar]
- 5.Goto I, Katsuki S, Ikui H, et al. Pathological studies on the intracerebral and retinal arteries in cerebrovascular and noncerebrovascular diseases. Stroke. 1975;6:263–9. doi: 10.1161/01.str.6.3.263. [DOI] [PubMed] [Google Scholar]
- 6.Smith DO, LeRoith D. Insulin resistance syndrome, pre-diabetes, and the prevention of type 2 diabetes mellitus. Clin Cornerstone. 2004;6:7–13. doi: 10.1016/s1098-3597(04)80050-4. [DOI] [PubMed] [Google Scholar]
- 7.Wong TY, Shankar A, Klein R, et al. Retinal arteriolar narrowing, hypertension, and subsequent risk of diabetes mellitus. Arch Intern Med. 2005;165:1060–5. doi: 10.1001/archinte.165.9.1060. [DOI] [PubMed] [Google Scholar]
- 8.Wong TY, Klein R, Sharrett AR, et al. Retinal arteriolar narrowing and risk of diabetes mellitus in middle-aged persons. JAMA. 2002;287:2528–33. doi: 10.1001/jama.287.19.2528. [DOI] [PubMed] [Google Scholar]
- 9.Fulop T, Tessier D, Carpentier A. The metabolic syndrome. Pathol Biol (Paris) 2006;54:375–86. doi: 10.1016/j.patbio.2006.07.002. [DOI] [PubMed] [Google Scholar]
- 10.Wang Y, Beydoun MA. The obesity epidemic in the United States--gender, age, socioeconomic, racial/ethnic, and geographic characteristics: a systematic review and meta-regression analysis. Epidemiol Rev. 2007;29:6–28. doi: 10.1093/epirev/mxm007. [DOI] [PubMed] [Google Scholar]
- 11.Lee IM, Manson JE, Hennekens CH, Paffenbarger RS., Jr Body weight and mortality. A 27-year follow-up of middle-aged men. JAMA. 1993;270:2823–8. doi: 10.1001/jama.270.23.2823. [DOI] [PubMed] [Google Scholar]
- 12.Ikram MK, De Jong FJ, Vingerling JR, et al. Are retinal arteriolar or venular diameters associated with markers for cardiovascular disorders? The Rotterdam Study. Invest Ophthalmol Vis Sci. 2004;45:2129–34. doi: 10.1167/iovs.03-1390. [DOI] [PubMed] [Google Scholar]
- 13.Ikram MK, Witteman JC, Vingerling JR, et al. Retinal vessel diameters and risk of hypertension: the Rotterdam Study. Hypertension. 2006;47:189–94. doi: 10.1161/01.HYP.0000199104.61945.33. [DOI] [PubMed] [Google Scholar]
- 14.Liew G, Wang JJ. Retinal vascular signs in diabetes and hypertension--review. Arq Bras Endocrinol Metabol. 2007;51:352–62. doi: 10.1590/s0004-27302007000200027. [DOI] [PubMed] [Google Scholar]
- 15.Wong TY, Mosley TH, Klein R, et al. Retinal microvascular changes and MRI signs of cerebral atrophy in healthy, middle-aged people. Neurol. 2003;61:811. doi: 10.1212/01.wnl.0000086372.05488.8d. [DOI] [PubMed] [Google Scholar]
- 16.Leung H, Wang JJ, Rochtchina E, et al. Dyslipidaemia and microvascular disease in the retina. Eye. 2005;19:861–8. doi: 10.1038/sj.eye.6701668. [DOI] [PubMed] [Google Scholar]
- 17.van Leiden HA, Dekker JM, Moll AC, et al. Blood pressure, lipids, and obesity are associated with retinopathy: the hoorn study. Diabetes Care. 2002;25:1320–5. doi: 10.2337/diacare.25.8.1320. [DOI] [PubMed] [Google Scholar]
- 18.Klein R, Klein BE, Knudtson MD, et al. Are inflammatory factors related to retinal vessel caliber? The Beaver Dam Eye Study. Arch Ophthalmol. 2006;124:87–94. doi: 10.1001/archopht.124.1.87. [DOI] [PubMed] [Google Scholar]
- 19.Singh U, Devaraj S, Vasquez-Vivar J, Jialal I. C-reactive protein decreases endothelial nitric oxide synthase activity via uncoupling. J Mol Cell Cardiol. 2007;43:780–91. doi: 10.1016/j.yjmcc.2007.08.015. [DOI] [PMC free article] [PubMed] [Google Scholar]
- 20.Lagrand WK, Visser CA, Hermens WT, et al. C-reactive protein as a cardiovascular risk factor: more than an epiphenomenon? Circulation. 1999;100:96–102. doi: 10.1161/01.cir.100.1.96. [DOI] [PubMed] [Google Scholar]
- 21.Duncan BB, Schmidt MI, Pankow JS, et al. Low-grade systemic inflammation and the development of type 2 diabetes: the atherosclerosis risk in communities study. Diabetes. 2003;52:1799–805. doi: 10.2337/diabetes.52.7.1799. [DOI] [PubMed] [Google Scholar]
- 22.Wang JJ, Taylor B, Wong TY, et al. Retinal vessel diameters and obesity: a population-based study in older persons. Obesity (Silver Spring) 2006;14:206–14. doi: 10.1038/oby.2006.27. [DOI] [PubMed] [Google Scholar]
- 23.Mather KJ, Hunt AE, Steinberg HO, et al. Repeatability Characteristics of Simple Indices of Insulin Resistance: Implications for Research Applications. J Clin Endocrinol Metab. 2001;86:5457–64. doi: 10.1210/jcem.86.11.7880. [DOI] [PubMed] [Google Scholar]
- 24.Matthews DR, Hosker JP, Rudenski AS, et al. Homeostasis model assessment: insulin resistance and β-cell function from fasting plasma glucose and insulin concentrations in man. Diabetologia. 2004;28:412–9. doi: 10.1007/BF00280883. [DOI] [PubMed] [Google Scholar]
- 25.Radziuk J. Insulin sensitivity and its measurement: structural commonalities among the methods. J Clin Endocrinol Metab. 2004;85:4426–33. doi: 10.1210/jcem.85.12.7025. [DOI] [PubMed] [Google Scholar]
- 26.Knudtson MD, Lee KE, Hubbard LD, et al. Revised formulas for summarizing retinal vessel diameters. Curr Eye Res. 2003;27:143–9. doi: 10.1076/ceyr.27.3.143.16049. [DOI] [PubMed] [Google Scholar]
- 27.Wong TY, Knudtson MD, Klein R, et al. Computer-assisted measurement of retinal vessel diameters in the Beaver Dam Eye Study: methodology, correlation between eyes, and effect of refractive errors. Ophthalmology. 2004;111:1183–90. doi: 10.1016/j.ophtha.2003.09.039. [DOI] [PubMed] [Google Scholar]
- 28.Hubbard LD, Brothers RJ, King WN, et al. Methods for evaluation of retinal microvascular abnormalities associated with hypertension/sclerosis in the atherosclerosis risk in communities study1, *1. Ophthalmology. 1999;106:2269–80. doi: 10.1016/s0161-6420(99)90525-0. [DOI] [PubMed] [Google Scholar]
- 29.Sharrett AR, Hubbard LD, Cooper LS, et al. Retinal arteriolar diameters and elevated blood pressure: the Atherosclerosis Risk in Communities Study. Am J Epidemiol. 1999;150:263–70. doi: 10.1093/oxfordjournals.aje.a009997. [DOI] [PubMed] [Google Scholar]
- 30.Scheltens P, Barkhof F, Leys D, et al. A semiquantative rating scale for the assessment of signal hyperintensities on magnetic resonance imaging. J Neurol Sci. 1993;114:7–12. doi: 10.1016/0022-510x(93)90041-v. [DOI] [PubMed] [Google Scholar]
- 31.Shrout PE, Fleiss JL. Intraclass correlations: Uses in assessing rater reliability. Psychological Bulletin. 1979;86:420–8. doi: 10.1037//0033-2909.86.2.420. [DOI] [PubMed] [Google Scholar]
- 32.Kaushik S, Kifley A, Mitchell P, Wang JJ. Age, blood pressure, and retinal vessel diameter: separate effects and interaction of blood pressure and age. Invest Ophthalmol Vis Sci. 2007;48:557–61. doi: 10.1167/iovs.06-0893. [DOI] [PubMed] [Google Scholar]
- 33.Wong TY, Klein R, Sharrett AR, et al. Retinal arteriolar narrowing and risk of coronary heart disease in men and women. The Atherosclerosis Risk in Communities Study. JAMA. 2002;287:1153–9. doi: 10.1001/jama.287.9.1153. [DOI] [PubMed] [Google Scholar]
- 34.Wong TY, Klein R, Klein BEK, et al. Retinal Microvascular Abnormalities and their Relationship with Hypertension, Cardiovascular Disease, and Mortality. Surv Ophthalmol. 2001;46:59–80. doi: 10.1016/s0039-6257(01)00234-x. [DOI] [PubMed] [Google Scholar]
- 35.Mulvany MJ. Are vascular abnormalities a primary cause or secondary consequence of hypertension? Hypertension. 1991;18:I52–I57. doi: 10.1161/01.hyp.18.3_suppl.i52. [DOI] [PubMed] [Google Scholar]
- 36.Levy BI, Ambrosio G, Pries AR, Struijker-Boudier HA. Microcirculation in hypertension: a new target for treatment? Circulation. 2001;104:735–40. doi: 10.1161/hc3101.091158. [DOI] [PubMed] [Google Scholar]
- 37.Caglayan E, Blaschke F, Takata Y, Hsueh WA. Metabolic syndrome-interdependence of the cardiovascular and metabolic pathways. Curr Opin Pharmacol. 2005;5:135–42. doi: 10.1016/j.coph.2005.01.008. [DOI] [PubMed] [Google Scholar]
- 38.Cusi K, Maezono K, Osman A, et al. Insulin resistance differentially affects the PI 3-kinase- and MAP kinase-mediated signaling in human muscle. J Clin Invest. 2000;105:311–20. doi: 10.1172/JCI7535. [DOI] [PMC free article] [PubMed] [Google Scholar]
- 39.Williams SB, Cusco JA, Roddy MA, et al. Impaired nitric oxide-mediated vasodilation in patients with non-insulin-dependent diabetes mellitus. J Am Coll Cardiol. 1996;27:567–74. doi: 10.1016/0735-1097(95)00522-6. [DOI] [PubMed] [Google Scholar]
- 40.Nystrom T, Nygren A, Sjoholm A. Increased levels of tumour necrosis factor-alpha (TNF-alpha) in patients with Type II diabetes mellitus after myocardial infarction are related to endothelial dysfunction. Clin Sci (Lond) 2006;110:673–81. doi: 10.1042/CS20050353. [DOI] [PubMed] [Google Scholar]
- 41.Zavaroni I, Ardigo D, Zuccarelli A, et al. Insulin resistance/compensatory hyperinsulinemia predict carotid intimal medial thickness in patients with essential hypertension. Nutr Metab Cardiovasc Dis. 2006;16:22–7. doi: 10.1016/j.numecd.2004.11.003. [DOI] [PubMed] [Google Scholar]
- 42.Geroldi C, Frisoni GB, Paolisso G, et al. Insulin Resistance in Cognitive Impairment: The InCHIANTI Study. Arch Neurol. 2005;62:1067–72. doi: 10.1001/archneur.62.7.1067. [DOI] [PubMed] [Google Scholar]
- 43.Umegaki H, Kawamura T, Mogi N, et al. Glucose control levels, ischaemic brain lesions, and hyperinsulinaemia were associated with cognitive dysfunction in diabetic elderly. Age Ageing. 2008;37:458–61. doi: 10.1093/ageing/afn051. [DOI] [PubMed] [Google Scholar]
- 44.Convit A. Links between cognitive impairment in insulin resistance: An explanatory model. Neurobiol Aging. 2005;26:31–5. doi: 10.1016/j.neurobiolaging.2005.09.018. [DOI] [PubMed] [Google Scholar]
- 45.Ferrannini E, Natali A, Bell P, et al. Insulin Resistance and Hypersecretion in Obesity. J Clin Invest. 1997;100:1166–73. doi: 10.1172/JCI119628. [DOI] [PMC free article] [PubMed] [Google Scholar]
- 46.Parikh NI, Pencina MJ, Wang TJ, et al. Increasing Trends in Incidence of Overweight and Obesity over 5 Decades. Am J Med. 2007;120:242–50. doi: 10.1016/j.amjmed.2006.06.004. [DOI] [PubMed] [Google Scholar]
- 47.Knudtson MD, Klein BE, Klein R, et al. Variation associated with measurement of retinal vessel diameters at different points in the pulse cycle. Br J Ophthalmol. 2004;88:57–61. doi: 10.1136/bjo.88.1.57. [DOI] [PMC free article] [PubMed] [Google Scholar]
- 48.Klein R, Klein BE, Tomany SC, Wong TY. The relation of retinal microvascular characteristics to age-related eye disease: the Beaver Dam eye study. Am J Ophthalmol. 2004;137:435–44. doi: 10.1016/j.ajo.2003.10.020. [DOI] [PubMed] [Google Scholar]