

Summary
The role of cell size and shape in controlling local intracellular signaling reactions, and how this spatial information originates and is propagated, is not well understood. We have used partial differential equations to model the flow of spatial information from the β-adrenergic receptor to MAPK1,2 through the cAMP/PKA/B-Raf/MAPK1,2 network in neurons using real geometries. The numerical simulations indicated that cell shape controls the dynamics of local biochemical activity of signal-modulated negative regulators, such as phosphodiesterases and protein phosphatases within regulatory loops to determine the size of microdomains of activated signaling components. The model prediction that negative regulators control the flow of spatial information to downstream components was verified experimentally in rat hippocampal slices. These results suggest a mechanism by which cellular geometry, the presence of regulatory loops with negative regulators, and key reaction rates all together control spatial information transfer and microdomain characteristics within cells.
Introduction
Many hormones and neurotransmitters bind to cell-surface receptors to initiate biological action. The cellular signal transducing process often involves the local production of small molecule second messengers, such as cAMP, and the local activation of protein kinases, protein phosphatases, and other signaling components. Such local activation and deactivation gives rise to the spatial segregation of signal flow, which in turn leads to the formation of microdomains of activated signaling components. A microdomain is a small dynamic subcellular region that has an elevated level of one or more signaling components. The length scale of the microdomain depends on the particular component being observed and also the nature of the stimulus applied.
It has long been thought that the diverse physiological outcomes observed for extracellular signals that share similar or identical intracellular signaling pathways arise from these spatial microdomains of signaling components within the cell (Brunton et al., 1981; Buxton and Brunton, 1983; Corbin et al., 1977; Keely, 1979). Advances in live cell imaging enable the observation of microdomains for a range of signaling components including small molecules such as cAMP (Bacskai et al., 1993; Nikolaev et al., 2004; Zaccolo et al., 2000; Zaccolo and Pozzan, 2002), ions such as Ca2+ (Cancela et al., 2002; Llinas et al., 1992; Marsault et al., 1997), GTPases (Janetopoulos et al., 2001; Mochizuki et al., 2001), and protein kinases (Nagai et al., 2000; Ting et al., 2001; Wang et al., 2005). These microdomains are dynamic in nature, and their modulation may be responsible for spatial signal specificity. How microdomains originate and how they propagate through signaling networks are not understood. To address these questions it is useful to define the term “spatial information” as those characteristics of the microdomain of an upstream component that propagates to downstream components in the signaling network. These may include the highest concentration of the component of interest in a region and the slope of the concentration gradient within a region.
Understanding the origins and dynamics of microdomains of signaling components is important for unraveling cellular complexity and information flow, since the inhomogeneous nature of coupled signaling reactions is likely to be a major aspect of the systems level behavior of the cell. In order to incorporate spatial information to obtain realistic representations of biochemical processes within the cell, the “well-stirred” solution approach we have used in the past (Bhalla and Iyengar, 1999; Bhalla et al., 2002) needs to be replaced by analyses that explicitly specify the location of components and reactions within the overall reaction space of cellular networks.
Reaction-diffusion mechanisms provide a well-understood explanation for microdomain dynamics. The balance between reactions and diffusion has been studied for over half a century in biological pattern formation (Turing, 1952) and more recently in extracellular morphogen gradients (Eldar et al., 2002; Goentoro et al., 2006). However, diffusion may not be the sole determinant of intracellular spatial dynamics, especially for larger molecules such as MAP-kinase1,2 (MAPK; 42–44 KDa), given the amount of molecular crowding within a cell (Fulton, 1982; Medalia et al., 2002). Experimental and theoretical observations suggest that negative regulators (Brown and Kholodenko, 1999; Zaccolo and Pozzan, 2002) and cell shape (Craske et al., 2005; Meyers et al., 2006; Neves, 2006; Onsum et al., 2006; Schneider et al., 2005) may also have roles in defining microdomains and their dynamics. Nevertheless, it is not clear how spatial information is transmitted as signal flows through an intracellular network. To understand the interplay of cell shape and negative regulators within reaction-diffusion systems in the transmission of spatial information, we have developed a partial differential equation-based model using realistic cell shapes and locations of relevant components. The model focuses on the β-adrenergic receptor-cAMP/protein kinase A (PKA)-MAPK network in neurons. β-adrenergic stimulation is an important regulator of synaptic plasticity such as long-term potentiation in the hippocampus (Katsuki et al., 1997). It is well known that synaptic plasticity occurs locally in the CA1 region of the hippocampus (Frey and Morris, 1997). Thus, a role for microdomains of signaling components in local plasticity is highly plausible.
Here we describe our studies on the β-adrenergic receptor to MAPK-signaling network. We determined the origins of spatial domains. We also determined if spatial information can be accurately transmitted from upstream to downstream components and the mechanisms that control this flow of spatial information. For this, numerical simulations were carried out in the modeling platform Virtual Cell (Loew and Schaff, 2001; Slepchenko et al., 2002, 2003) to analyze the effect of various factors on the dynamics of the microdomains. From these numerical simulations, we predicted and experimentally verified the existence of receptor-stimulated phospho-MAPK (P-MAPK) microdomains in rat CA1 hippocampal neurons in tissues slices.
Results
Isoproterenol-Stimulated cAMP Microdomains in Neurons
We developed the computational model of signal flow from the β-adrenergic receptor to MAPK in two stages. Initially we set up a compartmental ordinary differential equation (ODE) model assuming a circle with a surface-to-volume ratio of 0.3. We utilized rate constants from the biochemical literature and constrained input-output relationships with experiments in the literature and performed in our laboratory for this study. Two types of experiments were used: time courses and dose-response curves. We compared the dose response for cAMP formation in response to isoproterenol in our simulations to those obtained experimentally (Figure S1A). We also compared experiments to simulations for PKA and P-MAPK (Figure S1). These comparisons show that our model reasonably recapitulates the biochemical dynamics of the signaling network. This compartmental model was then converted into a spatial partial differential equation (PDE) model. We used cellular geometries taken from microscopy images, mapped the compartments from the ODE model to their appropriate subcellular location, and specified diffusion rates for each component (see Supplemental Data for details). Simulations were run on the spatial model, and the predictions were used as hypothesis for experiments. These steps are summarized in Figure 1A.
Figure 1. Cell Shape Control of cAMP Microdomains.
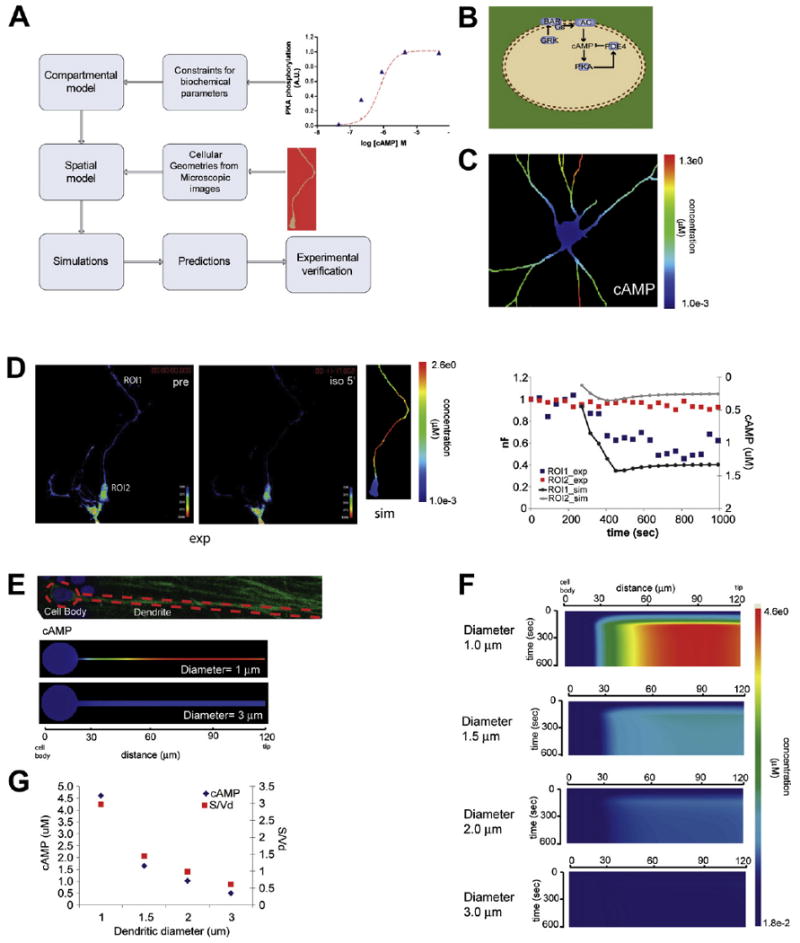
(A) Schematic of overall modeling approach used in this study.
(B) Schematic depiction of the spatially specified signaling network used in these simulations, starting from β-adrenergic receptor to cAMP. The receptor and adenylyl cyclase are in the plasma membrane while cAMP, PDE4, and PKA are freely diffusible in the cytoplasm.
(C) Simulation of cAMP microdomain formation in response to 1 μM isoproterenol activation of the signaling network depicted in (B) using a neuronal geometry.
(D) Dynamics of cAMP formation in live primary hippocampal neurons (DIV 4) using the cAMP FRET sensor EPAC1. The images show the calculated nF prior to addition of isoproterenol (10 μM, left panel) and 5 min post addition (middle panel). Simulated cAMP gradient using neuronal geometry from FRET experiment (right panel). Comparison of cAMP FRET at ROI1 (dendrite) and ROI2 (cell body) with simulation results in their corresponding locations.
(E) Image of a CA1 hippocampal neuron in a tissue-slice preparation, with its contours outlined, and the cell body and dendrite labeled (top panel). Simulation of the cAMP microdomains obtained using two of the idealized geometries (bottom panels).
(F) Kymographs of simulation results of cAMP concentration with respect to time and space for varying dendritic diameters.
(G) Concentration of cAMP at 600 s, plotted against dendritic diameter, and its corresponding surface-to-volume ratio, S/Vd.
We tested the network from the activation of the β-adrenergic receptor to the production of cAMP (Figure 1B). We traced the contours of the image of a hippocampal neuron (Banker and Goslin, 1998) in culture and used this as the initial geometry in our model. The β-adrenergic receptor system in hippocampal CA1 neurons is particularly useful to study the effects of cell shape, since, using receptor autoradiography, it has been shown that these receptors are present in both the cell body and dendrites of CA1 neurons with little (Duncan et al., 1991; Rainbow et al., 1984) to no (Ordway et al., 1988) observable difference in the density of receptors. Therefore, we made the assumption of uniform receptor distribution. The density of receptor is provided in Table S1. We used a physiological value that was determined experimentally (Post et al., 1995).
In the model, the β-adrenergic receptor, Gs, and adenylyl cyclase were placed at the cell membrane, and their concentrations were evenly distributed along the perimeter of the cell. All others components were cytoplasmic, and their diffusion coefficients were estimated from their molecular weights (Supplemental Data, see Box 1). The simulations were started by activating the receptors with saturating concentrations of the receptor agonist isoproterenol. We found that although the cAMP production system is activated globally, distinct microdomains of cAMP were formed in the distal dendrites (Figure 1C; Movie S1), with little to no increase in the cell body. We tested if this spatial profile could be experimentally observed. For this primary hippocampal neurons were transfected with the cAMP FRET probe (Nikolaev et al., 2004). Stimulation of cAMP by isoproterenol was visualized in live neurons as loss of FRET (Figure 1D). We traced the geometry of the neuron from these experiments for simulation, as well. The experimental results agree with the simulations (Figure 1D, right panel) with the preferential accumulation of cAMP at the dendrites.
To systematically analyze the role of cell body and dendritic geometry within a tissue context in microdomain formation, we used an image of a CA1 neuron in a hippocampal slice to develop an idealized geometry for the neuron depicted as a circle with a protruding rectangle representing cell body with an extended dendrite (Figure 1E). The idealized geometry was based on the physiological dimensions measured in CA1 neurons (Fiala and Harris, 1999). The length of the dendrite in the geometries was kept constant at 100 μm, and the cell body had a diameter of 20 μm. The dendritic diameter was either 1 or 3 μm. For both idealized geometries, there is a preferential accumulation of cAMP in the dendrite compared to the cell body, creating a gradient, especially for the thin dendrite (Figure 1E). This spatial profile can be explained by the cell body acting as a sink. However, selectively increasing the number of molecules of receptor, Gs and adenylyl cyclase in the plasma membrane of the cell body leads to a uniform distribution of cAMP independent of the compartment (Figure S2). This observation suggests that the cell body does not function as a simple sink, but other factors may be at play. The cAMP microdomain was dependent on receptor occupancy, since changes in the initial concentration of ligand had a significant effect on microdomain dynamics (Figure S3). To determine how sensitive the cAMP domains were to changes in dendritic diameter, we used the geometries with dendritic diameters that ranged from 1 to 3 μm. We varied the dendritic diameter, since these diameters range from about 0.25 to 3 μm in hippocampal CA1 neurons (Fiala and Harris, 1999). Under the same activation conditions originally used (uniform receptor density, saturating ligand concentration), dendritic diameter was inversely proportional to the cAMP concentration in the microdomain (Figure 1F). The dendritic diameter is inversely proportional to cAMP concentration because, in thinner dendrites, the surface to volume ratio is high, thus increasing the apparent receptor-adenylyl cyclase density per unit area. The surface-to-volume ratio effect was very pronounced on the dynamics of cAMP microdomains (Figure 1G), given that its production is membrane delimited.
In addition to our own experiments, we compared our model using the geometry for an Aplysia neuron with FRET experiments conducted by Bacskai et al. (1993). These simulations were then used for a curve-fitting exercise to develop a limited mathematical representation of the relationship between the dynamics of cAMP microdomain and the cell shape-constrained reactions (Figures S4–S7 and Equations S1–S16). This relationship provides a preliminary insight into the relationship between the dynamics of microdomain characteristics, biochemical activities, and cell shape.
Propagation of Spatial Information from cAMP Microdomain to Downstream Components
We then extended our initial model to include the activation of MAPK by cAMP. The resulting network is depicted in Figure 2A. This is a stacked network with a negative feedback loop sitting on top of a positive feed-forward motif. The microdomains of activated PKA (PKA*) and P-MAPK from the simulations of the partial differential equation model is shown in Figure 2B. These results suggest that the cAMP microdomain is maintained in its downstream components. We then determined the effect of varying dendritic diameter on microdomain dynamics (Figure 2C). Increasing dendritic diameter led to the dissipation of PKA and P-MAPK microdomains. The surface-to-volume effect is plotted in Figure 2D, and the effect was less prominent than that seen for cAMP microdomain (compare Figure 2D to Figure 1G). Since PKA and P-MAPK microdomains appear to be less sensitive to dendritic diameter changes, we hypothesized that other mechanism(s) in addition to cellular geometry are needed for the transmission of spatial information, and the most obvious explanation would be diffusion.
Figure 2. Dendritic Diameter Controls PKA and P-MAPK Microdomains.
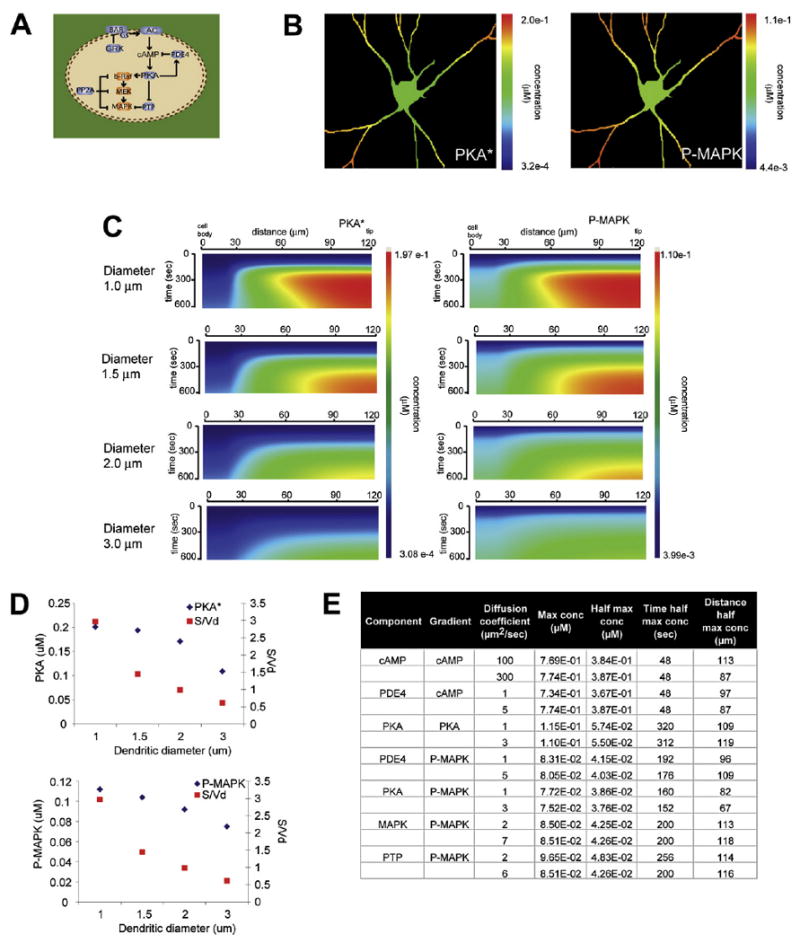
(A) Schematic depiction of extended signaling network used in these simulations, starting from β-adrenergic receptor to MAPK. cAMP and all components downstream of cAMP are freely diffusible.
(B) Simulation of the isoproterenol-activated PKA (PKA*, left panel) and activated MAPK (P-MAPK, right panel) microdomains obtained.
(C) Kymographs of simulation of PKA* (left) and P-MAPK (right) concentration with respect to time and space for varying dendritic diameters.
(D) Concentration of PKA* (left) and P-MAPK (right) at 600 s, plotted against dendritic diameter and its corresponding surface-to-volume ratio, S/Vd.
(E) Table summary of the effect of varying diffusion coefficients on gradients obtained (see Figures S8–S14 for details and original kymographs). The label “component” identifies the component that the diffusion coefficient was varied, “gradient” identifies the component that was examined, “max conc” is maximal concentration, “half max conc” stands for half maximal concentration, “time half max conc” identifies the time at which the half-maximal concentration is achieved during the simulation, “distance half max conc” identifies the transverse length (0 μm is the outer edge of the cell body, 120 μm is the tip of the dendrite) at which the half-maximal concentration is achieved during the simulation.
Given that cell shape would affect diffusion, we next addressed the role of diffusion in the observed microdomain dynamics in these idealized geometries. We ran a set of simulations varying the diffusion coefficients from zero to values that are twice that of the calculated diffusion coefficient for many of the diffusible components, and looked at the resulting cAMP, PKA, and P-MAPK microdomains (Figures S8–S14, summarized in Figure 2E). The microdomains are robust to changes in diffusion coefficients, with the exception of PTP (Figure S14). Increasing the diffusion coefficient of PTP changed the spatial distribution of the P-PTP and PTP activities, and this led to a shallower P-MAPK gradient (Figure S14B). The critical role of PTP, and its regulation in the transmission of spatial information, is further explored in the simulations and experiments in Figure 5. We also calculated the Thiele modulus (Bird et al., 1960; Levenspiel, 1995) and characteristic path length (CPL) (Berg, 1993) to estimate the contribution of diffusion to the dynamic characteristics of our system (Figure S15, Tables S6 and S7). The Thiele modulus is a commonly used nondimensional parameter that defines the relative contribution of reactions versus diffusion in a reaction-diffusion system. These calculations and the numerical simulations suggest that in the reaction-diffusion system for this signaling network using these geometries, reactions have a larger influence on the microdomain dynamics than diffusion. The relatively small contribution of diffusion is due to the limited volume of the dendritic compartment. As the dendritic diameter increases, the volume increases and the role of diffusion becomes dominant for the microdomain characteristics, leading to a loss of gradients. This is evident in the cell body. The major effect of cellular geometry (i.e., cell shape) in this system appears to arise from the surface-to-volume ratio difference between the cell body and the dendrite, since β-adrenergic receptor, Gs, and adenylyl cyclase are membrane bound.
Figure 5. Effect of the Negative Regulator PTP on P-MAPK Microdomains in Neurons.
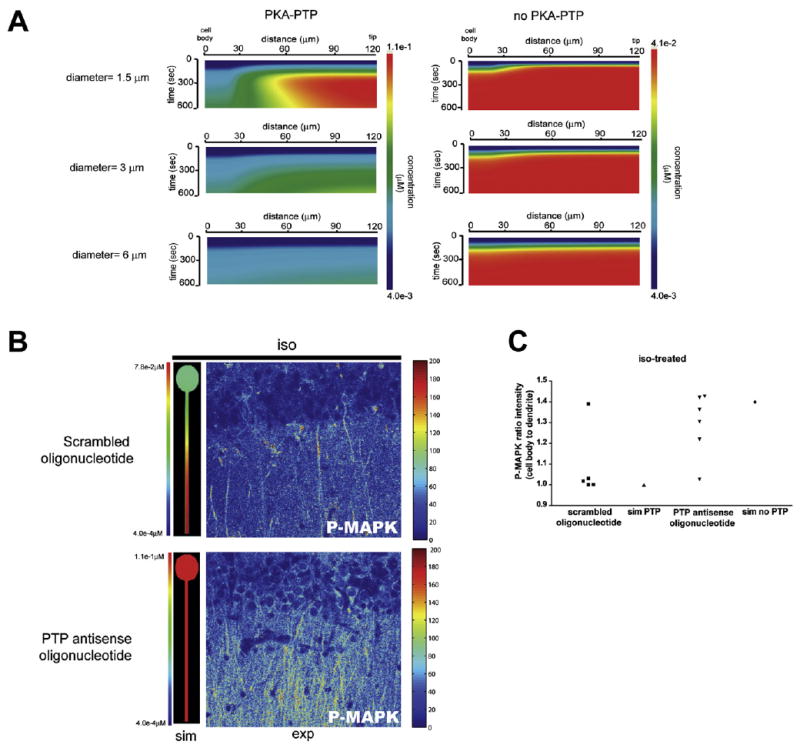
(A) Simulations analyzing the contribution of PKA-PTP link to P-MAPK gradient in geometries with varying dendritic diameters using idealized neuronal geometry.
(B) Comparison of P-MAPK in simulations and pseudocolored experimental images from Figure S27. Simulated microdomain P-MAPK in response to isoproterenol activation, in the presence (top) and absence of PTP (bottom).
(C) Quantification mean intensity ratio of P-MAPK in cell body to dendrites as described in Figures 3 and 4. Experimental data represent two to three slices per condition from two animals in separate experiments, each injected with antisense or scrambled oligonucleotides.
Effect of an Upstream Negative Regulator on a Microdomain of a Downstream Component
Since cell shape and diffusion appear not to be the only contributors to the formation of downstream microdomains, we looked at the key negative regulators in the network. To analyze the role of negative regulators in the transmission of spatial information, we simulated the effects varying levels of PDE4 on isoproterenol-induced cAMP and P-MAPK microdomains. In the simulations shown in Figure S16A, we looked at the effect of inhibiting phosphodiesterase on the isoproterenol-stimulated cAMP microdomains. We found that once the PDE4 is inhibited, isoproterenol elevates cAMP levels both in the cell body and the dendrites. We verified this prediction in primary hippocampal neurons using the cAMP FRET probe. As predicted by the simulations, pretreatment with rolipram, a PDE4 inhibitor, resulted in enhanced cAMP accumulation in the cell body and dendrites (Figure S16B). We traced the geometry of the neuron from these experiments for use in the simulations. The simulations (Figure S16C) agree with the experimental results when the cAMP values are calculated at 2 regions of interest (Figure S16D).
We then used simulation to determined by simulations how the reduction in PDE4 affected PKA* and P-MAPK microdomains in neurons. For both components, isoproterenol-dependent activation was seen in both the cell body and dendrites (Figure S16E). This is in contrast to the dendrite selective activation seen in the simulations in Figure 2D when PDE4 is active. We then simulated the effect of varying the concentration of PDE4 on the P-MAPK microdomain in the 1 and 3 μm dendritic diameter geometries. The kymographs show the dynamics of the P-MAPK microdomains across time and space (Figure 3A) and the line plots show the P-MAPK gradient at 600 s from the cell body (0 μm) to the tip of the dendrite (120 μm, Figure 3A). In both geometries, there was an optimal PDE4 concentration that leads to the sharpest gradient of P-MAPK. When the dendritic diameter is 3 μm (right panel), either end of the PDE4 concentration range (0 or 0.8 μM) tested showed a lack of sharp microdomains, (i.e., shallow gradient). In the intermediate range of 0.2–0.4 μM PDE4, the microdomain is steeper (Figure 3B, left and right panels). The simulation results from the 1 μm geometry show a sharply defined microdomain at the two middle concentrations of PDE4 (Figures 3A and 3B, left panels). We have plotted the linear range of the gradients of activated PKA, P-PTP, and P-MAPK as a function of distance (Figure S17), and their corresponding slopes as a function of PDE4 concentration (Figure S18). The results indicate that a combination of cellular geometry, specified by dendritic diameter, and optimal level of negative regulator (PDE4) activity is required for the formation of the P-MAPK microdomains.
Figure 3. Effect of the Upstream Negative Regulator PDE4 on P-MAPK Microdomains in Neurons.
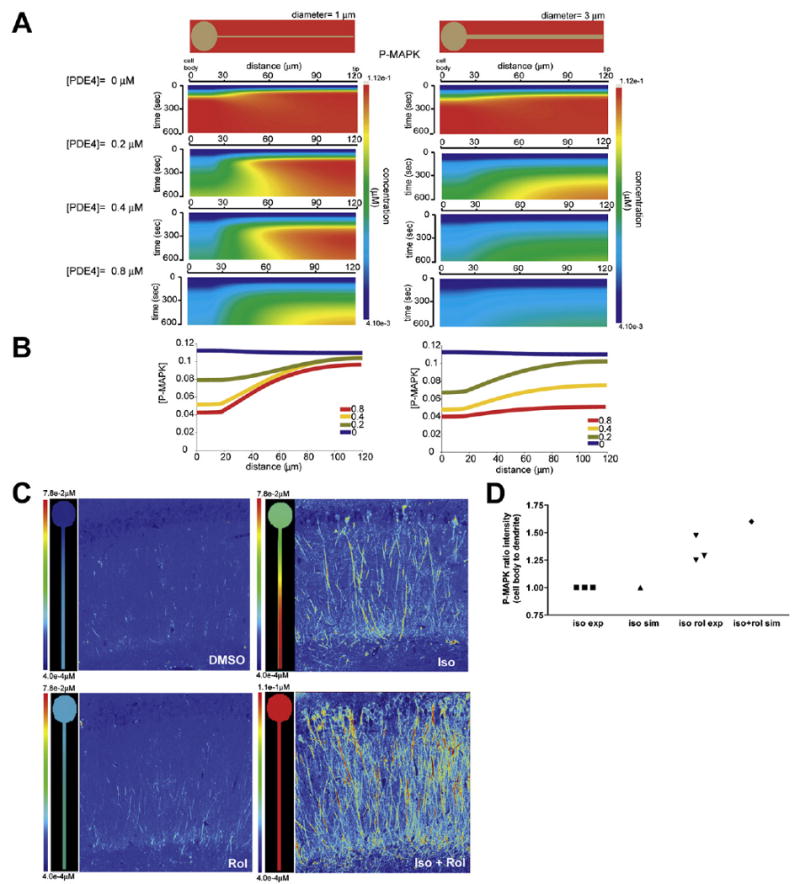
(A) Kymographs of simulated P-MAPK concentrations with respect to time and space for idealized geometry and with varying PDE4 concentrations at 1 μm (left panel) and 3 μm (right panel) dendritic diameter.
(B) Line plots of spatial gradients (microdomain characteristics), depicting the P-MAPK gradient at 600 s in dendrites with 1 μm (left panel) and 3 μm (right panel) diameter with varying concentrations of PDE4. The concentrations of PDE4 used are color coded.
(C) Comparison of P-MAPK in simulation and pseudocolored experimental images from Figure S19. For ease of visualization, the simulation and pseudocolor experimental images have similar color scales with blue (low levels) and red (high levels). Numerical scale values are different. Simulated gradient of P-MAPK in response to isoproterenol stimulation in the presence of normal phosphodiesterase concentration (0.4 μM, DMSO, Iso) or reduced phosphodiesterase concentration (0.01 μM Rol, Iso + Rol) at 10 min.
(D) Comparison of the simulated and experimentally obtained mean intensity ratio of P-MAPK in cell body to dendrite. Ratios of the intensity in the cell body to the dendrite were calculated and normalized to those of the isoproterenol (iso) treatment. For each experiment, the normalization was performed independently. Data are shown from three animals.
The simulations in Figure 3A yielded an experimentally testable hypothesis. We hypothesized that stimulation of the β-adrenergic receptor in rat CA1 neurons in a tissue slice by bath application of isoproterenol should lead to the predominant dendritic activation of MAPK. If the PDE4 activity is inhibited, then MAPK activation should also be observed in the cell body. We conducted simulations to quantify these predictions (Figure 3C; left panels, SM2 and SM3). For the experiments, hippocampal slices were prepared and treated with isoproterenol in the presence and absence of rolipram. Slices were then fixed, further subsectioned, stained with phospho-MAPK antibody and visualized by confocal microscopy. Treatment with rolipram by itself did not increase P-MAPK levels (Figure S19C), while when the slices were treated only with isoproterenol, there was elevated dendritic P-MAPK levels (Figure S19C). Treatment with both isoproterenol and rolipram led to increased P-MAPK levels in the cell body and dendrites (Figure S19C). For easier comparison, we have pseudocolored the microscopy images in the same scale as used in the simulation results (Figure 3C, right panels). The images were processed, and the intensity ratios of cell body region to the dendritic region were obtained. These values were compared to values obtained from the numerical simulations at analogous locations. We plotted the ratio of intensity of P-MAPK staining in cell body over the dendrite as a measure of the loss of P-MAPK microdomain that occurs when PDE4 is inhibited (iso-rol treatment). For the experimental ratios, the values represent three independent experiments (Figure 3D). The ratios from the experiments agree those obtained from the simulations.
PP2A and PP1 are known common negative regulators for the protein kinase cascade leading to MAPK activation. PP2A dephosphorylates B-Raf, MEK, and MAPK, while PP1 dephosphorylates and activates PTP, which in turn dephosphorylates and inhibits MAPK (Nika et al., 2004). We tested if inhibiting PP2A/PP1 with okadaic acid, would lead to MAPK activation in both the cell body and dendrites. Simulations (Figure S20) and experiments (Figure S21) indicated that okadaic acid treatment (PP2A/PP1 inhibition) resulted in isoproterenol-stimulated MAPK activation in both the cell body and dendrites. The simulation movie corresponding to the okadaic acid experiment is SM4. These comparisons between simulations and experiments indicate that our simulations were able to predict the location of activated MAPK microdomains within hippocampal neurons.
Since all of the simulations were done in two dimensions, we tested if results would be valid in three dimensions, using an idealized geometry shown in Figure 1E. For this we treated the cell body as a sphere with a protruding cylinder representing the dendrite (Figure S22). The simulation was run using the same kinetic parameters previously described but in 3D. As shown in Figure S22A, the isoproterenol-stimulated P-MAPK microdomain is observable in the dendrites just like in the 2D simulation (Figure S22B).
Transmittal of Spatial Information
We next determined how the spatial information, as manifested by the cAMP microdomain characteristics in Figure 1, was transmitted through the signaling network so that it was observable as a MAPK microdomain. The origins of the cAMP microdomain are mostly due to (1) cAMP production at the plasma membrane by adenylyl cyclase, an intrinsic membrane protein, and (2) the significant surface-to-volume ratio differences resulting from the shape of the neuron. The surface-to-volume effect is not as pronounced for microdomains of downstream components as the cAMP microdomain (compare Figures 1G and 2D). Therefore, we looked for other mechanisms that may be required for the formation of P-MAPK microdomains. We analyzed the spatial dynamics of the activated forms of the diffusible components. The simulation results are plotted as kymographs for a single dendrite denoted by a white line in Figure 4A. cAMP microdomains at the distal end of the dendrites are spatially preserved downstream in both activated PKA and P-MAPK (Figure 4B). Although a well-defined PKA microdomain is observable, such microdomains were not seen for either activated B-Raf or MEK. We experimentally verified this distribution of activated MEK (P-MEK). Tissue slices were treated as described previously for Figure 3 and stained for P-MEK. We found MEK activation in both cell body and dendrites (Figures S23, 4C, and 4D), confirming our simulation results.
Figure 4. Transmission of Spatial Information within Signaling Networks.
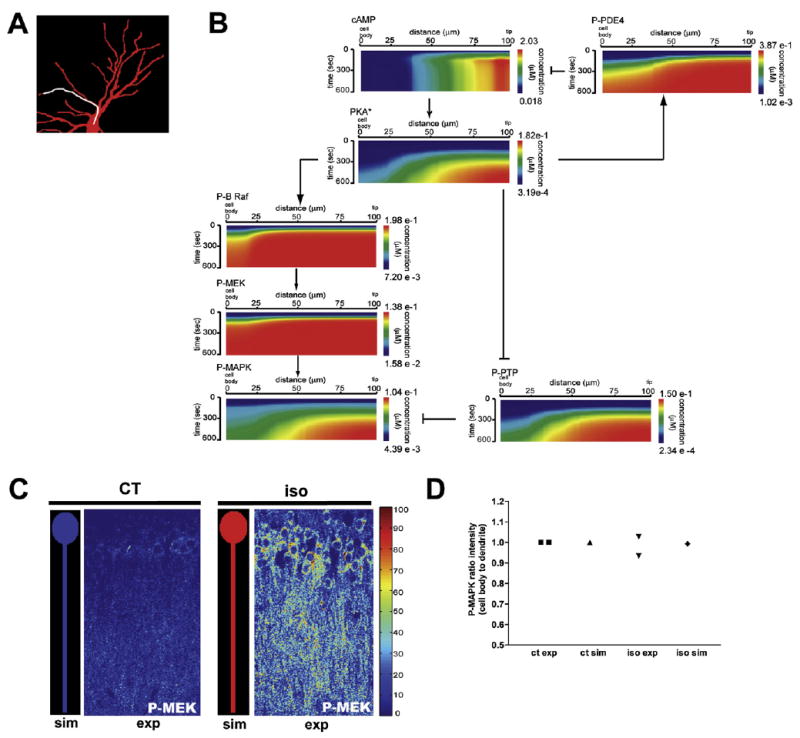
(A) Neuronal geometry used in the simulations in (B).
(B) The cAMP microdomain is conserved during signal propagation. A line scan was done on the dendrite highlighted (white line) in the neuronal geometry used (A). Kymographs along that dendrite depict the activation profile of components downstream of cAMP, after isoproterenol stimulation. Information flow for conservation of microdomain from cAMP to MAPK appears to occur through modulation of PTP by PKA.
(C) Comparison of P-MEK in simulation and pseudocolored experimental confocal images from Figure S23. Both have similar color scales. P-MEK levels were measured in control (ct) and iso neurons.
(D) Comparison of the simulated and experimentally obtained mean intensity ratio of P-MEK in cell body to dendrite. Ratios of the intensity in the cell body to the dendrite were calculated and normalized to those of the ct. For each experiment, the normalization was performed independently.
In contrast, in the simulations, the microdomain for inactive (phosphorylated) PTP closely resembles the PKA microdomain (Figure 4B). These results suggest that the PKA to PTP link may play a role in the transmittal of spatial information. We evaluated the importance of the PKA-PTP link for the formation of P-MAPK microdomains at varying dendritic diameters.
We then explored how the biochemical reaction of PKA phosphorylating PTP was regulated by the spatial dimensions to produce the observed gradients. We ran a set of simulations in which we varied the dendritic diameter in the idealized geometry in the presence and absence of the PKA to PTP link (Figure 5A). Two features were observable. First, at thin diameters the P-MAPK gradient was dependent on the presence of the PKA to PTP link (compare upper-most kymographs horizontally). It is also noteworthy that as the dendritic diameter increases the gradient dissipates even if the PKA to PTP link is present (left vertical panels). Without the PKA to PTP link, there is not much of a gradient, and the effect of increasing dendritic diameters is small.
This set of simulations highlights the tight interrelationship between cellular geometry and the biochemical loops in origins of microdomains of intracellular signaling components.
From these simulations it can be seen that microdomain characteristics are transmitted from PKA to MAPK through PTP. This suggested that the two populations of phosphatase activities, PTP and P-PTP (one directly under the control of PKA), lead to the formation of the P-MAPK microdomain. The P-MAPK microdomains results from the double negative arm of the feed-forward motif involving PKA, which phosphorylates and inhibits PTP (e.g., PTP-SL) that in turn dephosphorylates and deactivates MAPK (Blanco-Aparicio et al., 1999; Pulido et al., 1998).
To understand the biochemical mechanisms underlying the transfer of spatial information from PKA to MAPK through PTP, we ran a set of simulations using the idealized neuronal geometry shown in Figure 3A. We used two dendritic diameters 1 μm (thin) and 3 μm (thick). As expected, the P-MAPK gradients were dependent on total PTP concentrations. In the thin dendrites increasing PTP concentration led to an increase in the slope of the P-MAPK gradient (Figure S24) similar to what is observed for PDE4 (Figure 3). We then compared the gradients of cAMP, activated PKA, ratio of phospho-PTP to PTP, and P-MAPK (Figure S25). For the thick dendrite, the cAMP microdomain is not well preserved for activated PKA and beyond, although a shallow microdomain is observed. In contrast, in the thin dendrite the microdomain characteristic transmitted from cAMP to MAPK. The simulation in Figure S25 combined with that in Figure 5A show that although the information regarding the activity state of the signaling components from PKA to MAPK flows through the B-Raf-MEK pathway, the spatial information that defines microdomain characteristics such as maximal concentration of activated component, length, and slope of the microdomain flows from PKA to PTP to MAPK. This indicates a critical role for PTP in the transmittal of spatial information. To experimentally test this hypothesis, we ablated the expression of PTP in tissue slices. We injected antisense oligonucleotides targeting PTP into the hippocampus of cannulated animals. Animals were sacrificed, and hippocampal tissue slices were prepared. Treatment with antisense oligonucleotides led to a reduction in the expression of PTPRR gene products (Figure S26). To assess the role of PTP, tissue slices from scrambled and antisense oligonucleotide treated animals were made, treated with isoproterenol, fixed, and stained for P-MAPK. In the scrambled oligonucleotide-treated tissue, stimulation with isoproterenol led to the preferential accumulation of P-MAPK in the dendrites. On the other hand, PTP-antisense oligonucleotide-treated tissue exposed to isoproterenol showed P-MAPK in both dendrities and cell body (Figures S27 and 5B). This is in agreement with our simulation results as seen in Figures 5B and 5C, showing side-by-side comparisons of the pseudocolored images from Figure S27 and the simulations. The quantification of the activation in the cell body to dendrite is shown in Figure 5D.
An obvious question arises from the observations in Figures 4 and 5. What is the difference between the PKA to PTP connection and the PKA to B-Raf to MEK connection that, in one case, there is a spatial fidelity and, in the other case, there is not? Our initial hypothesis was that this difference in spatial fidelity arose from the differences in kinetic parameters for the two reactions. To test this hypothesis we swapped the kinetic rates for the PKA phosphorylation of B-Raf reaction and the PKA phosphorylation of PTP reaction (Figures 6A and 6B), ran simulations, and plotted the results as kymographs. For B-Raf, when its original parameters were used, the gradient was similar to what is seen in the simulation in Figure 4B (compare the panels in Figure 6A marked with white asterisks to Figure 4B, P-B-Raf panel). This lack of a gradient of P-B-Raf is driven by the high kcat value of the reaction of PKA phosphorylating B-Raf. (Compare horizontally the lower panels in Figure 6A.) However, if the B-Raf to P-B-Raf reaction had the same parameters as the PTP to P-PTP reaction, then one would observe a P-B-Raf gradient, as well (Figure 6A, uppermost left panel). Since the experiments to test the predictions from Figure 4B used P-MEK antibodies, we also checked how the P-MEK gradients varied with changes in the kinetic parameters for the upstream B-Raf to P-B-Raf reaction. We found that native parameters also yielded the observed lack of gradient profile for P-MEK (Figure 6A, lower panels marked with white asterisks). Likewise, for the PKA catalyzed PTP to P-PTP reaction, only the native parameters yielded a gradient (Figure 6B, panels marked with black asterisk). Here too, increasing dendritic diameter led to a loss of sharpness of the gradient (Figure 6B, compare the two panels labeled with black asterisk). In contrast to the PKA catalyzed phosphorylation reactions, the dephosphorylation reactions catalyzed by PP2A for P-B-Raf to B-Raf and PP1 for P-PTP to PTP had a less pronounced effect on gradient profiles due to their small kcat values (Figures 6C and 6D). Thus, it appears that kinetic parameters play a critical role in determining which arm of the feed-foward loop transmits the spatial information.
Figure 6. Comparison of the Effects of the Kinetic Parameters for PKA, PP2A, and PP1 Reactions with B-Raf and PTP on Microdomains of Activated B-Raf, MEK, and P-PTP.
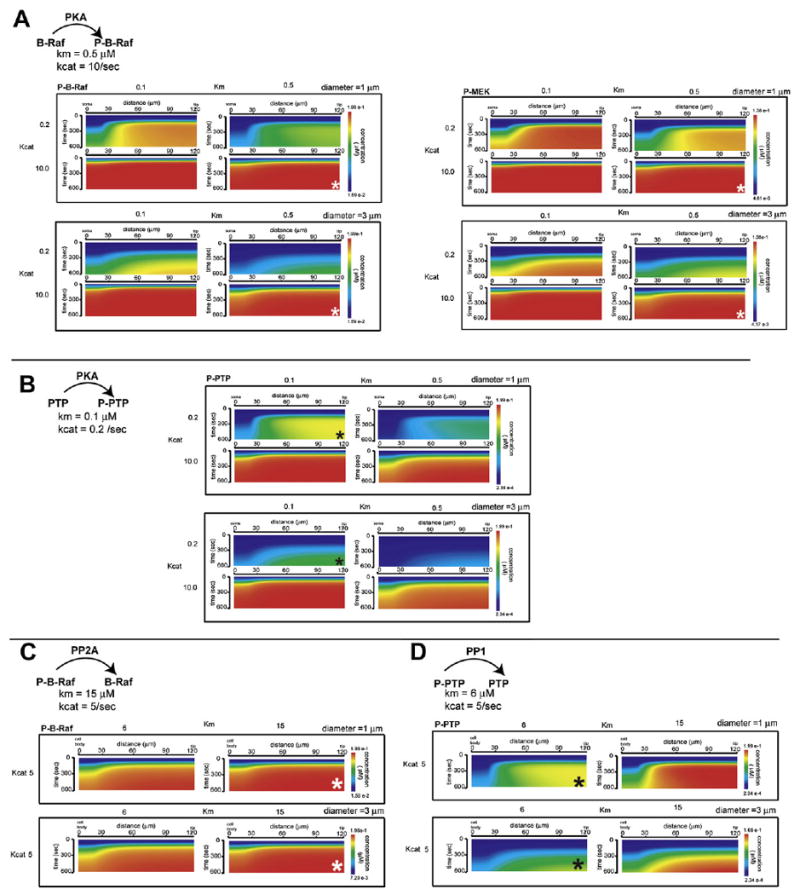
For all of these simulations, the idealized neuronal geometry was used. Dendritic diameter was either 1 or 3 μm. The standard kinetic parameters used are noted under the reaction.
(A) Simulation of the P-B-Raf microdomain with kinetic parameter variation for the reaction of PKA phosphorylating B-Raf in a neuron with a dendritic diameter of 1 μm (top) or 3 μm (bottom). White asterisk marks the standard kinetics parameter combination used in all the simulations in this study. Simulation of the P-MEK microdomain with kinetic parameter variation for the reaction of PKA phosphorylating B-Raf in neuron with a dendritic diameter of 1 μm (top) or 3 μm (bottom). White asterisk marks the standard kinetics parameter combination used in all the simulations used in this study.
(B) Simulation of the P-PTP microdomain with kinetic parameter variation for the reaction of PKA phosphorylating PTP in a geometry with a dendritic diameter of 1 μm (top) or 3 μm (bottom). Black asterisk marks the standard kinetics parameter combination used in all the simulations used in this study.
(C) Simulation of the P-B-Raf microdomain with kinetic parameter variation for the reaction of PP2A dephosphorylating P-B-Raf in a geometry with a dendritic diameter of 1 μm (top) or 3 μm (bottom). Black asterisk marks the standard kinetics parameter combination used in all the simulations used in this study.
(D) Simulation of the P-PTP microdomain with kinetic parameter variation for the reaction of PP1 dephosphorylating P-PTP in a geometry with a dendritic diameter of 1 μm (top) or 3 μm (bottom). White asterisk marks the standard kinetics parameter combination used in all the simulations used in this study.
Discussion
These simulations and experiments show a tightly coordinated relationship between four factors in the origins and dynamics of spatial domains. These factors are cell shape, subcellular localization of components, network topology, and the kinetic parameters for biochemical reactions. Intracellular signals most often arise from the activity of plasma membrane-bound components. The local shape of the region involved in the production of the signal predisposes how these signals spread. This effect of cell shape implies that mechanical forces at the plasma membrane will control the flow of spatial information through intracellular networks. In the case of a cell with projections like a neuron, the dendritic structure, with its high surface-to-volume ratio, favors the local accumulation of membrane-generated signals. Thus, the physical constraints for microdomain formation comes from cell shape (and presumably cell mechanics) and the resulting surface to volume effect (Figure 7). These physical constraints are, however, insufficient to permit the transmission of spatial information to downstream components. For transmission of spatial information, both the topology of the network and the kinetic parameters for the biochemical reactions need to be appropriately tuned. In the system we have studied, a feed-foward loop is necessary to transmit both the information regarding the extent of the activity as well as the spatial range (microdomain characteristics). Network topology by itself is also insufficient, since the appropriate kinetic parameters for key reac-tants are essential for the propagation of spatial information. Thus, the dynamics of the microdomains of signaling components is truly a systems property arising from the interplay of the physical and chemical characteristics of a cell (Figure 7).
Figure 7. Integration of the Physical Determinants and the Biochemical Characteristics Required for the Transmittal of Spatial Information through Signaling Networks.
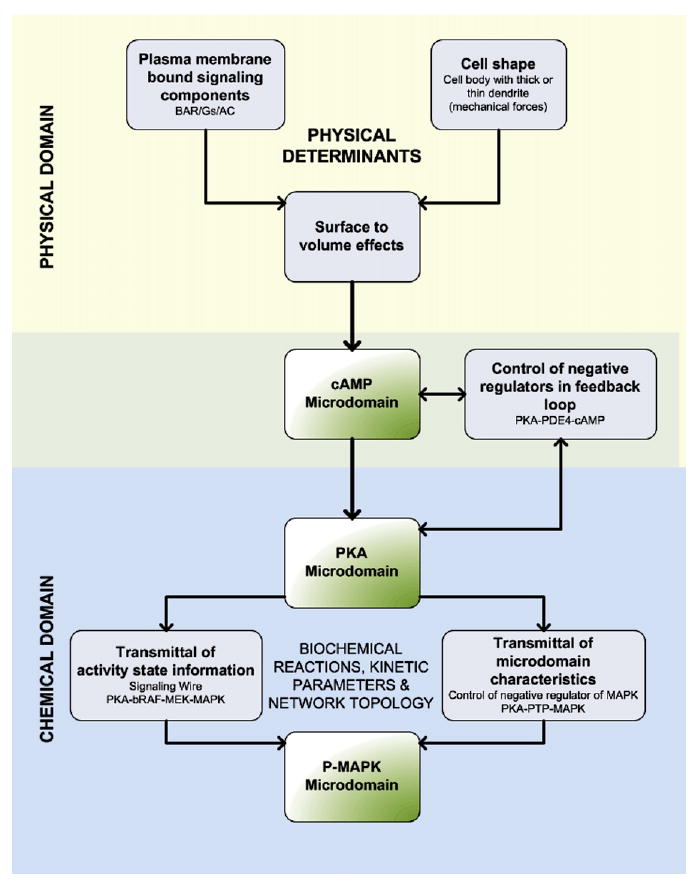
The flowchart depicts the origins of spatially restricted signal generation and how the integration of physical constraints (physical domains: cell shape and membrane-delimited reactions) and biochemical reactions, kinetic parameters, and network topology (chemical domain) allows for the flow of spatial information from upstream to downstream components in signaling networks.
The development of live-cell imaging techniques has demonstrated the realtime existence of microdomains of components within the cell. Are such microdomains relevant to the specificity of physiological effects? In hippocampal neurons, the answer is yes. For example, MAPK phosphorylates A-type potassium channels Kv4.2 (Morozov et al., 2003), which are predominantly expressed in the distal dendrites as compared to the cell bodies (Maletic-Savatic et al., 1995; Sheng et al., 1992). Local increases in dendritic MAPK, even when the entire cell is stimulated, may allow for inhibition of Kv4.2 in a spatially defined manner. This process could facilitate depolarization at particular dendrites through dendritic action potentials of local origin or by routing back-propagating action potentials, both of which have been implicated in long-term potentiation of synaptic transmission (Remy and Spruston, 2007; Watanabe et al., 2002; Losonczy et al., 2008). Moreover, cAMP microdomains could influence the scaling of distal and proximal synaptic contributions to the integrated response at the cell body, and in this way help to determine the pattern of firing generated by inputs to different regions of the dendritic arbor. For example, local increases in the concentration of cAMP would shift the activation range of HCN-type cation channels to less negative membrane potentials and thus be expected to maintain the inward current through these channels during an excitatory postsynaptic potential (Magee, 1999). Thus, the MAPK- and cAMP-mediated effects on Kv4.2 and HCN channels, respectively, could have important consequences for the spatial specification of synaptic plasticity.
From these simulations, it becomes apparent that defining the underlying causes for the formation and dissipation of spatial domains of signaling components can be very useful in understanding how the interplay between structural changes at the cellular level and biochemical changes can lead to altered physiological and pathophysiological responses. For spatially restricted systems such as the plasma membrane-bound β-adrenergic receptor-Gs-adenylyl cyclase, surface-to-volume ratios will play a role in the formation of microdomains. Our simulations show that in real geometries of cells like neurons, diffusion appears not to be a major contributor of microdomain dynamics. In contrast, negative regulators such as phosphodiesterases and phosphatases as part of regulatory loops are major determinants of microdomain dynamics. Our results show that these negative regulators not only modulate dynamics of microdomains of upstream components but also propagate spatial information through signaling networks. The ability to transmit spatial information arises from the modulation of activity that the negative regulators are subjected to as part of a regulatory loop. Changing the net reaction balance between production and degradation of signaling components at any location affects the overall size of the microdomain. Thus, reaction balance at the various parts of the signaling network within the overall reaction diffusion system can be a critical driver of spatial patterns within cells. Here, the importance of kinetic parameters for key reactions within the network should also be emphasized. Evolution may have selected these biochemical parameters so as to achieve dynamic systems level spatial behaviors. The role of diffusible negative regulators in defining the boundaries of microdomains adds to the list of important systems-level properties that can be attributed to negative regulators. Previous studies from our laboratory had shown the critical role of negative regulators such as PP1 in the gating of the CaMKII signal in LTP (Blitzer et al., 1998) and MKP in the design of a flexible MAPK switch (Bhalla et al., 2002).
In conclusion, these studies show that the dynamics of microdomains of signaling components in cells arises from shape-constrained net-reaction balance within regulatory loops. The microdomains of signaling components provide compelling evidence for the inhomogeneous nature of coupled biochemical reactions within cells. Since such coupled biochemical reactions can store information (Bhalla and Iyengar, 1999), the existence of microdomains indicates that such information may be stored in specific locations within the cell.
Experimental Procedures
Simulation
Modeling was conducted in the Virtual Cell modeling environment. Initially, the model was developed as an ODE compartmental model, and then converted into a spatial PDE model to incorporate the cell shape and resultant constraints of the geometry and diffusion. Details are provided in the Supplemental Data. All of the computational models are available www.vcell.org.
Experiments
Primary Hippocampal Cultures
Hippocampal cultures were prepared from embryonic day 18 rat fetuses and cultured for 3–6 days (Days in Vitro, DIV). The protocols for animal experiments have been approved by the Mount Sinai IUACCUC. Neurons were transfected with Lipofectamine 2000 (Invitrogen) and imaged 24 hr post transfection.
FRET Imaging
Primary hippocampal neurons transfected with EPAC1 were imaged in a Zeiss LSM meta-510 confocal microscope. FRET was calculated using the nF method in Volocity (Improvision).
Hippocampal Slice Preparation and Treatment
Hippocampal slices were prepared from male adult Sprague Dawley rats. The 500-μm-thick hippocampal slices were treated with various agents as required. After treatment slices were fixed in Paraformaldehyde at 4°C for immunofluorescence or flash-frozen and stored at −80°C for immunoblotting or cAMP assay.
Antisense Oligonucleotide Treatment
Male Sprague Dawley rats were anesthetized with Ketamine-Xylazine, and stereotaxic procedures were used to implant stainless steel guided cannulae bilaterally into the hippocampus. After a 7 day recovery period, rats were injected (2 nmol in 1 μl) every 12 hr for 48 hr (a total of four injections) with either PTPRR antisense combo or scrambled oligodeoxynucleotide both diluted in phosphate-buffered saline (PBS) at pH 7.4. Rats were sacrificed 12–16 hr post last injection, and slices were obtained for treatment. This protocol has been approved by the Mount Sinai IUACUC.
Immunohistochemistry
After washing, slices were subsectioned to 40 μm on a vibrotome. Sections were blocked with 10% normal goat serum, 1% BSA, and 0.01% Na-azide in PBS. The sections were incubated overnight with the appropriate antibodies. After washes, sections were incubated with secondary antibodies complexed to either Alexa Fluor 568 or Alexa Fluor 488 dyes. After washing, the sections were imaged using a Zeiss LSM meta-510 confocal microscope. Contrast and brightness were constant for all sections from the same experiment.
Supplementary Material
Acknowledgments
This research was supported by NIH grants GM072853 and DK 38761. S.R.N. was supported by NRSA GM-65065. Additional support was provided by the NIH Nanomedicine Center (PN2EY016586) and the System Biology Center (PSDGM071558). We thank Dr. M Loshe for the cAMP FRET probe; Drs. G Huntley, D. Benson, and V. Nagy for helpful advice regarding immunohistochemistry experiments: Dr. A. Lipshtat for critical comments on curve fitting; and Dr. S. Shvartsman (Princeton University) for helpful comments. We thank Dr. R. Tsien for valuable questions during an oral presentation by one of us (R.I.) that led to the design of the simulations in Figure 6.
S.R.N. developed the models and ran all of the simulations in Virtual Cell, and conducted the biochemical experiments related to input-output constraints, the immunohistochemistry for okadaic acid treatment, localization of PDE4 and PP2A, and antisense oligonucleotide experiments. P.T. conducted the hippocampal slice experiments and antisense oligonucleotide experiments. A.S. developed the curve fitting and initial mathematical representation. P.R. helped with the curve fitting and reaction diffusion system analysis. S.M.T. and C.M.A. helped develop and conduct the antisense oligonucleotide experiments. J.C.S. and I.I.M. assisted S.R.N. in the initial development and implementation of the model, and provided continuing support during the simulations. I.I.M. and S.R.N. cooperated in running and assessing the final simulations used in this publication. R.D.B. designed the conditions for the hippocampal slice treatment and provided overall supervision for these experiments. S.R.N., P.R., and R.I. wrote the paper. R.I. was responsible for overall design of experiments and simulations and ongoing supervision of the project and is responsible for the final publication.
Footnotes
Supplemental Data: Supplemental Data include 27 figures, 7 tables, 6 movies, Supplemental Experimental Procedures, Supplemental References and and can be found with this article online at http://www.cell.com/cgi/content/full/133/4/666/DC1/.
References
- Bacskai BJ, Hochner B, Mahaut-Smith M, Adams SR, Kaang BK, Kandel ER, Tsien RY. Spatially resolved dynamics of cAMP and protein kinase A subunits in Aplysia sensory neurons. Science. 1993;260:222–226. doi: 10.1126/science.7682336. [DOI] [PubMed] [Google Scholar]
- Banker G, Goslin K. Culturing Nerve Cells. Second. Cambridge, MA: MIT Press; 1998. [Google Scholar]
- Berg HC. Random Walks in Biology. Princeton, NJ: Princeton University Press; 1993. [Google Scholar]
- Bhalla US, Iyengar R. Emergent properties of networks of biological signaling pathways. Science. 1999;283:381–387. doi: 10.1126/science.283.5400.381. [DOI] [PubMed] [Google Scholar]
- Bhalla US, Ram PT, Iyengar R. MAP kinase phosphatase as a locus of flexibility in a mitogen-activated protein kinase signaling network. Science. 2002;297:1018–1023. doi: 10.1126/science.1068873. [DOI] [PubMed] [Google Scholar]
- Bird R, Stewart WE, Lightfoot EN. Transport Phenomena. New York: Wiley Press; 1960. [Google Scholar]
- Blanco-Aparicio C, Torres J, Pulido R. A novel regulatory mechanism of MAP kinases activation and nuclear translocation mediated by PKA and the PTP-SL tyrosine phosphatase. J Cell Biol. 1999;147:1129–1136. doi: 10.1083/jcb.147.6.1129. [DOI] [PMC free article] [PubMed] [Google Scholar]
- Blitzer RD, Connor JH, Brown GP, Wong T, Shenolikar S, Iyengar R, Landau EM. Gating of CaMKII by cAMP-regulated protein phosphatase activity during LTP. Science. 1998;280:1940–1942. doi: 10.1126/science.280.5371.1940. [DOI] [PubMed] [Google Scholar]
- Brown GC, Kholodenko BN. Spatial gradients of cellular phospho-proteins. FEBS Lett. 1999;457:452–454. doi: 10.1016/s0014-5793(99)01058-3. [DOI] [PubMed] [Google Scholar]
- Brunton L, Hayes J, Mayer S. Functional compartmentation of cAMP and protein kinase in heart. Adv Cyclic Nucleotide Res. 1981;14:391. [PubMed] [Google Scholar]
- Buxton I, Brunton L. Compartmentation of cAMP and protein kinase in cardiac myocytes. J Biol Chem. 1983;258:10233. [PubMed] [Google Scholar]
- Cancela JM, Van Coppenolle F, Galione A, Tepikin AV, Petersen OH. Transformation of local Ca2+ spikes to global Ca2+ transients: the combinatorial roles of multiple Ca2+ releasing messengers. EMBO J. 2002;21:909–919. doi: 10.1093/emboj/21.5.909. [DOI] [PMC free article] [PubMed] [Google Scholar]
- Corbin J, Sugden P, Lincoln T, Keely S. Compartmentalization of adenosine 3′ :5′-monophosphate and adenosine 3′:5′-monophosphate-dependent protein kinase in heart tissue. J Biol Chem. 1977;252:3854. [PubMed] [Google Scholar]
- Craske ML, Fivaz M, Batada NN, Meyer T. Spines and neurite branches function as geometric attractors that enhance protein kinase C action. J Cell Biol. 2005;170:1147–1158. doi: 10.1083/jcb.200503118. [DOI] [PMC free article] [PubMed] [Google Scholar]
- Duncan GE, Little KY, Koplas PA, Kirkman JA, Breese GR, Stumpf WE. Beta-adrenergic receptor distribution in human and rat hippocampal formation: marked species differences. Brain Res. 1991;561:84–92. doi: 10.1016/0006-8993(91)90752-h. [DOI] [PubMed] [Google Scholar]
- Eldar A, Dorfman R, Weiss D, Ashe H, Shilo BZ, Barkai N. Robustness of the BMP morphogen gradient in Drosophila embryonic patterning. Nature. 2002;419:304–308. doi: 10.1038/nature01061. [DOI] [PubMed] [Google Scholar]
- Fiala JC, Harris KM. Dendrite Structure. In: Stuart G, Spruston N, Häusser M, editors. Dendrites. Oxford, UK: Oxford University Press; 1999. [Google Scholar]
- Frey U, Morris RG. Synaptic tagging and long-term potentiation. Nature. 1997;385:533–536. doi: 10.1038/385533a0. [DOI] [PubMed] [Google Scholar]
- Fulton AB. How crowded is the cytoplasm? Cell. 1982;30:345–347. doi: 10.1016/0092-8674(82)90231-8. [DOI] [PubMed] [Google Scholar]
- Goentoro LA, Reeves GT, Kowal CP, Martinelli L, Schupbach T, Shvartsman SY. Quantifying the Gurken morphogen gradient in Drosophila oogenesis. Dev Cell. 2006;11:263–272. doi: 10.1016/j.devcel.2006.07.004. [DOI] [PMC free article] [PubMed] [Google Scholar]
- Janetopoulos C, Jin T, Devreotes P. Receptor-mediated activation of heterotrimeric G-proteins in living cells. Science. 2001;291:2408–2411. doi: 10.1126/science.1055835. [DOI] [PubMed] [Google Scholar]
- Katsuki H, Izumi Y, Zorumski CF. Noradrenergic regulation of synaptic plasticity in the hippocampal CA1 region. J Neurophysiol. 1997;77:3013–3020. doi: 10.1152/jn.1997.77.6.3013. [DOI] [PubMed] [Google Scholar]
- Keely S. Prostaglandin E1 activation of heart cAMP-dependent protein kinase: apparent dissociation of protein kinase activation from increases in phosphorylase activity and contractile force. Mol Pharmacol. 1979;15:235. [PubMed] [Google Scholar]
- Levenspiel O. Chemical Reaction Engineering. 2. New York: Wiley and Sons; 1995. [Google Scholar]
- Llinas R, Sugimori M, Silver RB. Microdomains of high calcium concentration in a presynaptic terminal. Science. 1992;256:677–679. doi: 10.1126/science.1350109. [DOI] [PubMed] [Google Scholar]
- Loew LM, Schaff JC. The Virtual Cell: a software environment for computational cell biology. Trends Biotechnol. 2001;19:401–406. doi: 10.1016/S0167-7799(01)01740-1. [DOI] [PubMed] [Google Scholar]
- Losonczy A, Makara JK, Magee JC. Compartmentalized dendritic plasticity and input feature storage in neurons. Nature. 2008;452:436–441. doi: 10.1038/nature06725. [DOI] [PubMed] [Google Scholar]
- Magee JC. Dendritic Ih normalizes temporal summation in hippocampal CA1 neurons. Nat Neurosci. 1999;2:848. doi: 10.1038/12229. [DOI] [PubMed] [Google Scholar]
- Maletic-Savatic M, Lenn NJ, Trimmer JS. Differential spatio-temporal expression of K+ channel polypeptides in rat hippocampal neurons developing in situ and in vitro. J Neurosci. 1995;15:3840–3851. doi: 10.1523/JNEUROSCI.15-05-03840.1995. [DOI] [PMC free article] [PubMed] [Google Scholar]
- Marsault R, Murgia M, Pozzan T, Rizzuto R. Domains of high Ca2+ beneath the plasma membrane of living A7r5 cells. EMBO J. 1997;16:1575–1581. doi: 10.1093/emboj/16.7.1575. [DOI] [PMC free article] [PubMed] [Google Scholar]
- Medalia O, Weber I, Frangakis AS, Nicastro D, Gerisch G, Bau-meister W. Macromolecular architecture in eukaryotic cells visualized by cryoelectron tomography. Science. 2002;298:1209–1213. doi: 10.1126/science.1076184. [DOI] [PubMed] [Google Scholar]
- Meyers J, Craig J, Odde DJ. Potential for control of signaling pathways via cell size and shape. Curr Biol. 2006;16:1685–1693. doi: 10.1016/j.cub.2006.07.056. [DOI] [PubMed] [Google Scholar]
- Mochizuki N, Yamashita S, Kurokawa K, Ohba Y, Nagai T, Miyawaki A, Matsuda M. Spatio-temporal images of growth-factor-induced activation of Ras and Rap1. Nature. 2001;411:1065–1068. doi: 10.1038/35082594. [DOI] [PubMed] [Google Scholar]
- Morozov A, Muzzio IA, Bourtchouladze R, Van-Strien N, Lapidus K, Yin D, Winder DG, Adams JP, Sweatt JD, Kandel ER. Rap1 couples cAMP signaling to a distinct pool of p42/44MAPK regulating excitability, synaptic plasticity, learning, and memory. Neuron. 2003;39:309–325. doi: 10.1016/s0896-6273(03)00404-5. [DOI] [PubMed] [Google Scholar]
- Nagai Y, Miyazaki M, Aoki R, Zama T, Inouye S, Hirose K, Iino M, Hagiwara M. A fluorescent indicator for visualizing cAMP-induced phosphorylation in vivo. Nat Biotechnol. 2000;18:313–316. doi: 10.1038/73767. [DOI] [PubMed] [Google Scholar]
- Neves SR. PhD thesis. New York: Mount Sinai School of Medicine of New York University; 2006. Origins of dynamic spatial domains of signaling components within networks. [Google Scholar]
- Nika K, Hyunh H, Williams S, Paul S, Bottini N, Tasken K, Lombroso PJ, Mustelin T. Haematopoietic protein tyrosine phosphatase (HePTP) phosphorylation by cAMP-dependent protein kinase in T-cells: dynamics and subcellular location. Biochem J. 2004;378:335–342. doi: 10.1042/BJ20031244. [DOI] [PMC free article] [PubMed] [Google Scholar]
- Nikolaev VO, Bunemann M, Hein L, Hannawacker A, Lohse MJ. Novel single chain cAMP sensors for receptor-induced signal propagation. J Biol Chem. 2004;279:37215–37218. doi: 10.1074/jbc.C400302200. [DOI] [PubMed] [Google Scholar]
- Onsum MD, Wong K, Herzmark P, Bourne HR, Arkin AP. Morphology matters in immune cell chemotaxis: membrane asymmetry affects amplification. Phys Biol. 2006;3:190–199. doi: 10.1088/1478-3975/3/3/004. [DOI] [PubMed] [Google Scholar]
- Ordway GA, Gambarana C, Frazer A. Quantitative autoradiography of central beta adrenoceptor subtypes: comparison of the effects of chronic treatment with desipramine or centrally administered l-isoproterenol. J Pharmacol Exp Ther. 1988;247:379–389. [PubMed] [Google Scholar]
- Post SR, Hilal-Dandan R, Urasawa K, Brunton LL, Insel PA. Quantification of signalling components and amplification in the beta-adrenergic-receptor-adenylate cyclase pathway in isolated adult rat ventricular myocytes. Biochem J. 1995;311:75–80. doi: 10.1042/bj3110075. [DOI] [PMC free article] [PubMed] [Google Scholar]
- Pulido R, Zuniga A, Ullrich A. PTP-SL and STEP protein tyrosine phosphatases regulate the activation of the extracellular signal-regulated kinases ERK1 and ERK2 by association through a kinase interaction motif. EMBO J. 1998;17:7337–7350. doi: 10.1093/emboj/17.24.7337. [DOI] [PMC free article] [PubMed] [Google Scholar]
- Rainbow TC, Parsons B, Wolfe BB. Quantitative autoradiography of beta 1- and beta 2-adrenergic receptors in rat brain. Proc Natl Acad Sci USA. 1984;81:1585–1589. doi: 10.1073/pnas.81.5.1585. [DOI] [PMC free article] [PubMed] [Google Scholar]
- Remy S, Spruston N. Dendritic spikes induce single-burst long-term potentiation. Proc Natl Acad Sci USA. 2007;104:17192–17197. doi: 10.1073/pnas.0707919104. [DOI] [PMC free article] [PubMed] [Google Scholar]
- Schneider IC, Parrish EM, Haugh JM. Spatial analysis of 3′ phosphoinositide signaling in living fibroblasts, III: influence of cell morphology and morphological Polarity. Biophys J. 2005;89:1420–1430. doi: 10.1529/biophysj.105.061218. [DOI] [PMC free article] [PubMed] [Google Scholar]
- Sheng M, Tsaur ML, Jan YN, Jan LY. Subcellular segregation of two A-type K+ channel proteins in rat central neurons. Neuron. 1992;9:271–284. doi: 10.1016/0896-6273(92)90166-b. [DOI] [PubMed] [Google Scholar]
- Slepchenko BM, Schaff JC, Carson JH, Loew LM. Computational cell biology: spatiotemporal simulation of cellular events. Annu Rev Biophys Biomol Struct. 2002;31:423–441. doi: 10.1146/annurev.biophys.31.101101.140930. [DOI] [PubMed] [Google Scholar]
- Slepchenko BM, Schaff JC, Macara I, Loew LM. Quantitative cell biology with the Virtual Cell. Trends Cell Biol. 2003;13:570–576. doi: 10.1016/j.tcb.2003.09.002. [DOI] [PubMed] [Google Scholar]
- Ting AY, Kain KH, Klemke RL, Tsien RY. Genetically encoded fluorescent reporters of protein tyrosine kinase activities in living cells. Proc Natl Acad Sci USA. 2001;98:15003–15008. doi: 10.1073/pnas.211564598. [DOI] [PMC free article] [PubMed] [Google Scholar]
- Turing AM. The chemical basis of morphogens. Philos Trans R Soc Lond B Biol Sci. 1952;237:37–72. doi: 10.1098/rstb.2014.0218. [DOI] [PMC free article] [PubMed] [Google Scholar]
- Wang Y, Botvinick EL, Zhao Y, Berns MW, Usami S, Tsien RY, Chien S. Visualizing the mechanical activation of Src. Nature. 2005;434:1040–1045. doi: 10.1038/nature03469. [DOI] [PubMed] [Google Scholar]
- Watanabe S, Hoffman DA, Migliore M, Johnston D. Dendritic K+ channels contribute to spike-timing dependent long-term potentiation in hippocampal pyramidal neurons. Proc Natl Acad Sci USA. 2002;99:8366–8371. doi: 10.1073/pnas.122210599. [DOI] [PMC free article] [PubMed] [Google Scholar]
- Zaccolo M, De Giorgi F, Cho CY, Feng L, Knapp T, Negulescu PA, Taylor SS, Tsien RY, Pozzan T. A genetically encoded, flour-escent indicator for cyclic AMP in living cells. Nat Cell Biol. 2000;2:25–29. doi: 10.1038/71345. [DOI] [PubMed] [Google Scholar]
- Zaccolo M, Pozzan T. Discrete microdomains with high concentration of cAMP in stimulated rat neonatal cardiac myocytes. Science. 2002;295:1711–1715. doi: 10.1126/science.1069982. [DOI] [PubMed] [Google Scholar]
Associated Data
This section collects any data citations, data availability statements, or supplementary materials included in this article.