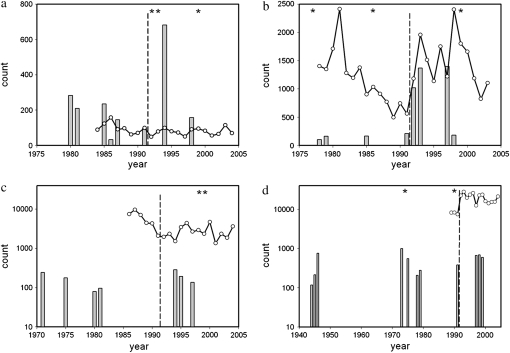
Figure 2.—
Annual trends in anadromous run sizes (open circles, solid lines) and Nb estimates (shaded bars) for four Newfoundland rivers, (a) Northeast Brook, (b) Middle Brook, (c) Conne River, and (d) Gander River, in relation to the marine fishery closure of 1992 (dashed vertical line). Note the logarithmic scale for count in Conne River and Gander River. Annual Nb estimates were obtained with SALMONNb (Waples et al. 2007). Asterisks refer to estimates of infinity.

