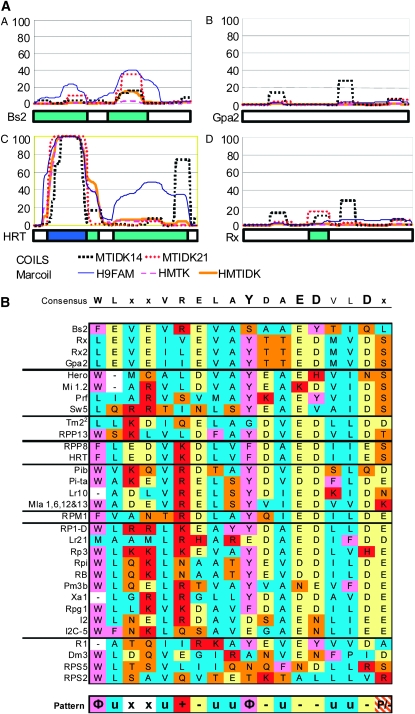
Figure 2.—
Comparison of N-terminal features of non-TIR R genes. (A) Coiled-coil prediction. Marcoil and COILS coiled-coil prediction outputs for different matrices or window sizes, as indicated, are represented graphically above the first 165 amino acids of selected protein sequences from Figure 1. The y-axis represents the percentage probability of forming a coiled-coil for each algorithm. The box below each graph represents the strength of the prediction, with dark blue for strongly predicted and light blue for weakly predicted coiled-coils. Side-by-side comparison predicts that HRT will form a coiled-coil, while Bs2, Rx, and Gpa2 will not. MTIDK stands for the coiled-coil proteins used in the prediction matrix: myosins, tropomyosins, intermediate filaments, desmosomal proteins, and kinesins. MTIDK14 (black dashed line) and MTIDK21 (red dashed line) indicate the size in amino acids of the sliding window used by the algorithm. 9FAM includes all nine families known to form coiled-coils and the MTK matrix is a smaller matrix including only myosins, tropomyosins, and kinesins. (B) An alignment of the N-terminal, non-TIR motif region described by Bai et al. (2002) and Rairdan et al. (2008) organized according to groups defined by the tree in Figure 1A. Amino acids are colored according to their properties. A consensus is shown above the alignment with letter size representing conservedness. A general pattern identified on the bsis of amino acid properties is shown below the alignment (Φ, aromatic; u, aliphatic; +, basic; -, acidic; P, polar; and x, nonconserved).

