Abstract
In mammals, the rate of somatic growth is rapid in early postnatal life but then slows with age, approaching zero as the animal approaches adult body size. To investigate the underlying changes in cell-cycle kinetics, [methyl-3H]thymidine and 5’-bromo-2’deoxyuridine were used to double-label proliferating cells in 1-, 2-, and 3-week-old mice for four weeks. Proliferation of renal tubular epithelial cells and hepatocytes decreased with age. The average cell-cycle time did not increase in liver and increased only 1.7 fold in kidney. The fraction of cells in S-phase that will divide again declined approximately 10 fold with age. Concurrently, average cell area increased approximately 2 fold. The findings suggest that somatic growth deceleration primarily results not from an increase in cell-cycle time but from a decrease in growth fraction (fraction of cells that continue to proliferate). During the deceleration phase, cells appear to reach a proliferative limit and undergo their final cell divisions, staggered over time. Concomitantly, cells enlarge to a greater volume, perhaps because they are relieved of the size constraint imposed by cell division. In conclusion, a decline in growth fraction with age causes somatic growth deceleration and thus sets a fundamental limit on adult body size.
Keywords: cell proliferation, cell cycle, cell size, kidney, liver
In a growing organism, cell proliferation at a constant rate would be expected to produce unlimited, exponential somatic growth (1). In reality, body mass in mammals does not even increase at a linear rate (1). Instead, the growth rate decreases with age; growth is rapid in early postnatal life and then slows, approaching zero, as the animal approaches its adult body size (2, 3). In small mammals, somatic growth deceleration occurs over weeks (2) whereas in large mammals it occurs over years (3), leading to the enormous variation in body size among different mammalian species. Growth deceleration is caused in large part by a decrease in the rate of cell proliferation. This decline does not appear to result simply from a decrease in growth hormone or insulin-like growth factor-I levels; in late human adolescence, for example, when the somatic growth rate is approaching zero, circulating growth hormone and insulin-like growth factor-I levels are greater than they are in early childhood when the growth rate is more rapid (4, 5). For the growth plate, in particular, there is evidence that the decline in growth rate is due to a local, rather than a systemic, mechanism (6).
We asked whether the decline in cell proliferation that occurs with age is due to an increase in the cell-cycle time or to a decrease in the growth fraction. The cell-cycle time is the average period of time required for a cell to pass through the entire cell cycle (7). The growth fraction represents the number of cells that remain in the cell cycle divided by the total number of cells. Thus, a decrease in growth fraction indicates that more cells have entered G0 or otherwise exited the cell cycle. To answer this question, we used an approach involving an initial injection of [methyl-3H]thymidine (3H-thymidine) and subsequent injections of 5’-bromo-2’deoxyuridine (BrdU), each of which labels newly synthesized DNA (7). A cell becomes labeled by both 3H-thymidine and BrdU only if it is in S-phase at the time of both injections. Therefore, double labeling occurs in a cell if the interval between the 3H-thymidine and BrdU injection is equal to the cell-cycle time. We used this method to assess changes in cell-cycle kinetics in the mouse as somatic growth decelerates postnatally. We chose to study liver and kidney as examples of organs in which proliferation slows with age. In other tissues, such as intestinal epithelium, epidermis, and hematopoietic tissue, continued proliferation is needed in adulthood because of the rapid turnover of terminally differentiated cells. Kidney was chosen as an example of a tissue in which the decline in proliferation is largely irreversible while liver was chosen as an example of a tissue in which the decline can be reversed e.g. after partial hepatectomy.
Materials and Methods
Animals
C57BL/6 male mice (Charles River Laboratories, Wilmington, MA) were fed standard chow and water ad libitum and weaned at 29 days of age. Animal care was in accordance with the Guide for the Care and Use of Laboratory Animals (8). The protocol was approved by the Animal Care and Use Committee, NICHD, NIH.
Study design
1-, 2-, and 3-week-old mice received a single intraperitoneal injection of 3H-thymidine (4 µCi per gram of body mass, GE Healthcare, Piscataway, NJ) on day 0. Mice of each age were divided into groups (5–7 mice per group, generally within a single litter) that received 1–7 intraperitoneal injections of BrdU (0.1 mg per gram of body mass, Sigma-Aldrich, St. Louis, MO) at various time points (Table 1). Multiple BrdU injections were used to increase the number of double-labeled cells and thus detect low levels of double labeling more accurately. Mice were killed by CO2 asphyxiation 24 hours after their final BrdU injection, and kidneys and liver were removed. The time of 3H-thymidine injection was designated t = 0.
Table 1.
Injection schedule.
| Day(s) | 0 | 1 | 2 | 3 | 4 | 5 | 6–7 | 8 | 9–14 | 15 | 16–21 | 22 | 23–28 | 29 |
|---|---|---|---|---|---|---|---|---|---|---|---|---|---|---|
| Group A | H | B | X | |||||||||||
| Group B | H | B | X | |||||||||||
| Group C | H | B | B | X | ||||||||||
| Group D | H | B | B | X | ||||||||||
| Group E | H | B | B | X | ||||||||||
| Group F | H | B | B | X | ||||||||||
| Group G | H | B | B | X |
All mice received 1 injection of 3H-thymidine (H) on day 0. Each age (1-, 2-, or 3-weeks) was then divided into 7 groups (A–G, n = 5–7) for a total of 21 different groups. Each group received 1–7 injections of BrdU (B) during various periods between day 1 and day 29. Mice were killed 24 hours after their final injection. H = 3H-thymidine injection, B = BrdU injection (given daily), X = killed.
Tissue preparation
Tissues were fixed in 10% phosphate-buffered formalin for 24 hours and transferred to 70% ethanol for storage. Tissues were embedded in paraffin, and 4 µm sections were mounted on Superfrost Plus slides.
BrdU immunohistochemistry and 3H-thymidine autoradiography
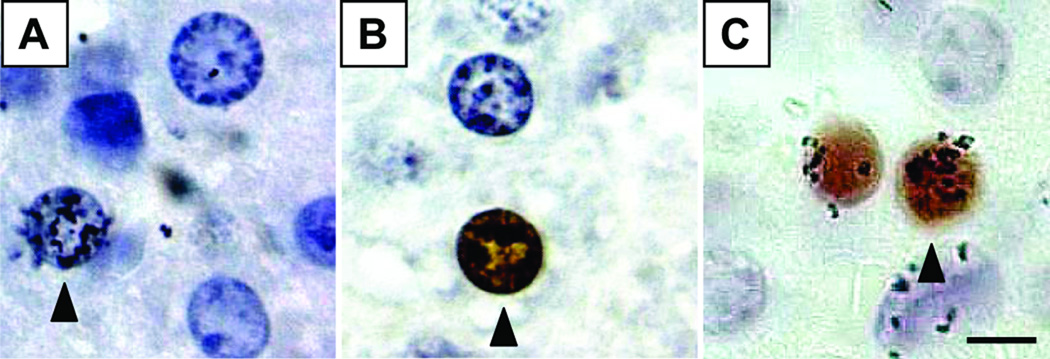
BrdU labeling was detected by immunohistochemistry using a commercial kit (BrdU In-Situ Detection Kit, BD Biosciences, San Jose, CA) that stained positive nuclei brown (Fig. 1A). 3H-thymidine labeling was visualized by autoradiography, which deposited silver grains over 3H-thymidine-labeled nuclei (Fig. 1B). Double-labeled cells contained silver grains over brown nuclei (Fig. 1C). To optimize labeling, we modified the manufacturer’s protocol: slides were incubated in BD Retrievagen A for 15 minutes at 89°C and allowed to cool slowly toward room temperature for 25 minutes, and incubation with anti-BrdU was carried out overnight at 4°C in a humidified chamber. After the last ethanol dehydration step, slides were coated with emulsion (Kodak Autoradiography Emulsion, Type NTB, Eastman Kodak Co., Rochester, NY), exposed for 13 days at 4°C, processed in Kodak 19 Developer and Kodak Fixer, and stained with Mayer’s Hematoxylin (Sigma-Aldrich).
Figure 1. Identification of labeled nuclei.
Mice received injections of 3H-thymidine and BrdU at different time points. Incorporation of label occurs if a cell is in S-phase at the time of that injection or shortly thereafter. Autoradiography was used to visualize cells that incorporated 3H-thymidine, which are identified by the presence of grains over the nucleus (A), and immunohistochemistry was used to detect cells that had incorporated BrdU, seen as brown-stained nuclei (B). Double-labeled nuclei show both grains and brown staining (C). 1000× magnification, bar = 5µm.
Criteria for identifying labeled cells
Tissues were viewed by transmission light microscopy using a 100× objective lens. In kidney, we assessed only tubular epithelial nuclei in the cortex. In liver, we assessed hepatocytes. A cell with 10 or more grains overlying the nucleus was considered 3H-thymidine-labeled. A nucleus with both brown staining and at least 15 grains was scored as double-labeled. The higher criterion of 15 grains was used to avoid counting nuclei that had gone through two cell cycles between the 3H-thymidine injection and the BrdU injection, which would have caused a 2-fold dilution in the 3H-thymidine label. For each animal, 20 fields were examined for 3H-thymidine- and BrdU-labeled nuclei, and 40 fields for double-labeled nuclei. The total number of hepatocytes or tubular epithelial nuclei was determined from two electronic images of representative fields.
Single-labeling indices: 3H-thymidine labeling index and BrdU labeling index
Both the 3H-thymidine labeling index (HLI) and the BrdU labeling index (BLI) are proportional to the fraction of cells in S-phase and therefore reflect the proliferation rate. To determine HLI, we counted 3H-thymidine-labeled nuclei and total nuclei in 1-, 2-, and 3-week-old mice killed at t = 2 days after the 3H-thymidine injection.
To determine BLI, we counted BrdU-labeled nuclei and total nuclei in mice that had received the 3H-thymidine injection at 1 week of age. The group that then received BrdU one day later was used to calculate the BLI for age 8 days. The group that received BrdU at t = 3 and 4 days (after 3H-thymidine injection) was used to calculate the BLI for age 10–11 days, and so forth, using the formula:
Double-labeling index
To calculate the double-labeling index (DLI) for day n, we divided the double-labeled nuclei at t = n by the number of 3H-thymidine-labeled nuclei from mice killed at t = 2 days, the earliest time point:
Thus defined, the DLI reflects the fraction of cells in S-phase at t = 0 that will proceed through the cell cycle and return to S-phase at a subsequent time point, t = n. Therefore, a DLI of 0.01 at t = 5 days would indicate that 1% of the cells that labeled with 3H-thymidine at t = 0 passed through the cell cycle and returned to S-phase five days later.
We adjusted the DLI for the liver using a correction factor to account for organ growth. The denominator of the DLI includes the number of 3H-thymidine-labeled nuclei at t = 2 days. Conceptually, we would like to follow these nuclei until t = n to determine how many of them then label again with BrdU. As the organs grow, the labeled nuclei that we counted at t = 2 days are dispersed by proliferating unlabeled cells into a larger volume at t = n. We corrected for this increased volume, using the relative organ masses at t = 2 days and t = n:
The kidney correction factor should account for growth of the cortical tubule cells with age. Therefore the kidney correction factor included not only the overall masses of the kidneys at the two ages, but also the relative sizes of the cortex to the whole kidney and the relative sizes of the tubular cells to the whole cortex, based on measured areas within tissue sections of the kidney using ImageJ image processing software (NIMH, Bethesda, MD). The exponent of 3/2 was used to convert areal values to volumetric values.
Mean cell-cycle time and area under DLI curve
The time interval between the 3H-thymidine and BrdU injections provides the length of the cell cycle for observed double-labeled cells. We determined the mean cell-cycle time at each age (1, 2, and 3 weeks) as follows:
where j = days since the 3H-thymidine injection, and ∑ represents the sum from j = 2 to j = 29 days.
We also looked at the area under the DLI curve, which reflects the fraction of cells in S-phase at t = 0 that will divide at least one more time between t = 1 day and t = 29 days.
where ∑ represents the sum from j = 2 to j = 29 days.
Area per cell
To determine changes in cell size, the total number of renal tubular epithelial nuclei or hepatocyte nuclei was determined in two regions per sample. The area of the region was divided by the number of nuclei to obtain the area (both intracellular and extracellular) occupied by each cell.
Statistics
Values were logarithmically transformed where appropriate to improve normality. ANOVA was used to assess effect of age on HLI, BLI, and the area under DLI curve. Differences between pairs of age groups or time points were evaluated by Bonferroni’s t-test. For mean cell-cycle time, significant differences between age groups were assessed by permutation analysis. Linear regression analysis was used to determine whether the mean area occupied per cell changed significantly with age.
Results
Single-labeling indices
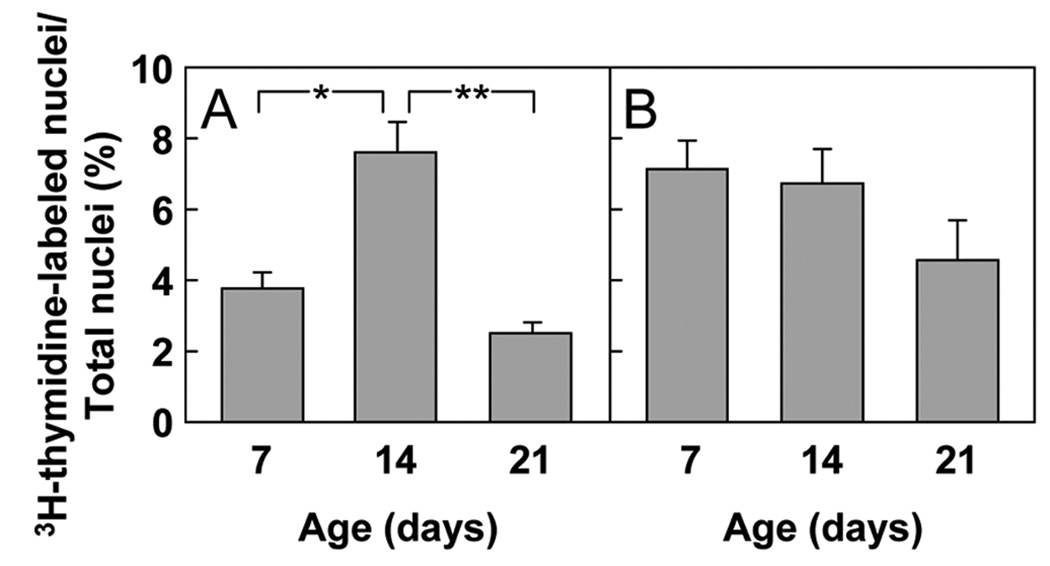
The HLI was measured in mice 7, 14, and 21 days of age (Fig. 2). In kidney, the percentage of 3H-thymidine-labeled cells depended on age (P < 0.001 ANOVA), increasing between 7 days and 14 days of age (P = 0.002) and then decreasing by 21 days of age (P < 0.001; Fig. 2A). These data suggest that the proliferation rate of renal tubular epithelial cells rose in the second week of life and declined afterwards. In liver, the decline in the HLI with age did not reach statistical significance (P = 0.08; Fig. 2B).
Figure 2. 3H-thymidine labeling index (HLI) (mean ± SEM).
Mice received an injection of 3H-thymidine at age 7, 14, or 21 days to label cells in S-phase. Tubular epithelial cells in the renal cortex (A) and hepatocytes (B) were evaluated for 3H-thymidine labeling. The HLI was calculated by dividing the number of 3H-thymidine-labeled nuclei counted by the total number of nuclei. (* P = 0.002; ** P < 0.001)
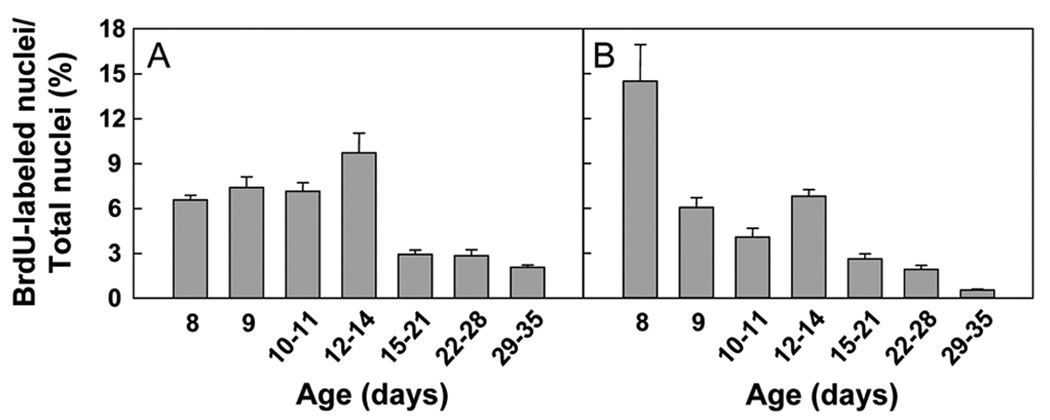
The BLI for the kidney varied significantly with age (P < 0.001 ANOVA), decreasing after 14 days of age (Fig. 3A). In liver, the BLI decreased with age (P < 0.001; Fig. 3B). Thus, in both kidney and liver, proliferation appears to decline by 3 weeks of age.
Figure 3. BrdU labeling index (BLI) (mean ± SEM).
Mice received one or more injections of BrdU at age 8, 9, 10–11, 12–14, 15–21, 22–28, or 29–35 days to label cells in S-phase. BrdU labeling was evaluated in tubular epithelial cells in the renal cortex (A, P < 0.001 ANOVA) and in hepatocytes (B, P < 0.001 ANOVA). The BLI was calculated by dividing the number of BrdU-labeled nuclei by the total number of nuclei. For tubular epithelial cells, a significant decrease was present only after 14 days (P < 0.05 for all pairwise comparisons between each of the first 4 time points and each of the last 3 time points).
Double-labeling index
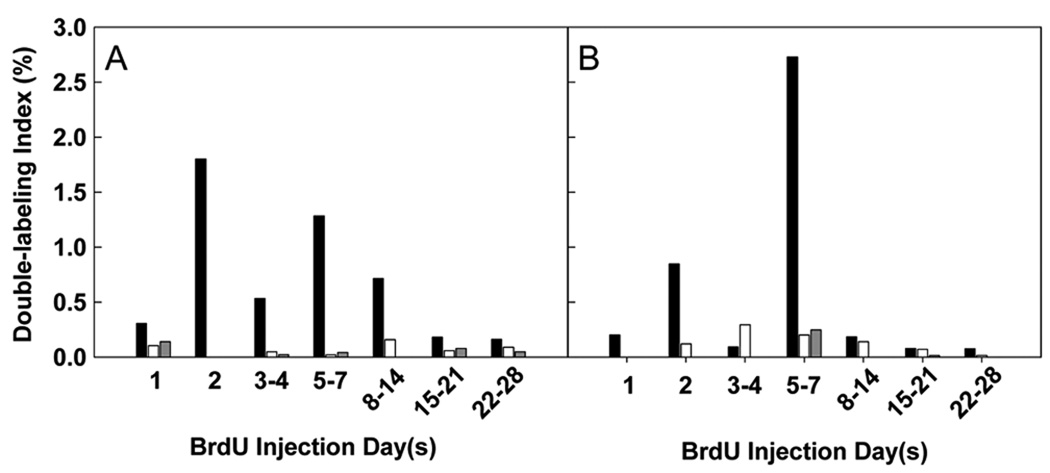
The DLI, as mathematically defined, reflects the fraction of nuclei in S-phase at t = 0 that will go through one cell cycle and return to S-phase at a subsequent time point. For example, for the 1-week-old mice, a DLI of 1.8% at t = 2 days indicates that 1.8% of the cells that labeled with 3H-thymidine at t = 0 passed through a complete cell cycle and labeled with BrdU at t = 2 days.
In kidneys of 1-week-old mice, some double labeling was observed with inter-injection intervals as short as 1 day and as long as 22–28 days (Fig. 4A). However, the greatest DLIs were observed at 2 to 7 days, indicating that the cell-cycle time for renal tubular epithelial cells was typically 2–7 days in duration. A similar range of cell-cycle times was observed in 2- and 3-week-old animals but with much lower DLIs (Fig. 4A), indicating that very few of the cells that divide at 2 or 3 weeks of age will go on to divide again during the next 4 weeks. Thus the data suggest that, in animals 2 weeks of age and older, cells are rapidly dropping out of the proliferative pool.
Figure 4. Double-labeling index (DLI).
Mice received an initial injection of 3H-thymidine followed by one or more injections of BrdU at various time points ranging from 1 to 28 days later. Tubular epithelial cells in the renal cortex (A) and hepatocytes (B) were evaluated for double labeling. [black bars] = 1-week-old mice, [white bars] = 2-week-old mice, and [gray bars] = 3-week-old mice. The DLI was calculated by dividing the average number of double-labeled cells by the number of BrdU injections and by the number of 3H-thymidine-labeled cells in mice killed on day 2. This value was adjusted mathematically to account for organ growth between the 3H-thymidine and BrdU injections. The presence of both labels in a cell indicated that the cell was in S-phase during the initial injection and had returned to S-phase at the time of the subsequent injection; thus, the time between the injections is equal to the cell-cycle time.
The liver showed a similar pattern. In 1-week-old mice, hepatocytes showed an apparent cell-cycle time varying from 1 to 28 days with the greatest DLIs observed at 2 to 7 days. In 2- and 3-week-old mice, the range of cell-cycle times appeared similar to the 1-week-old mice but with far lower DLIs (Fig. 4B).
Mean cell-cycle time
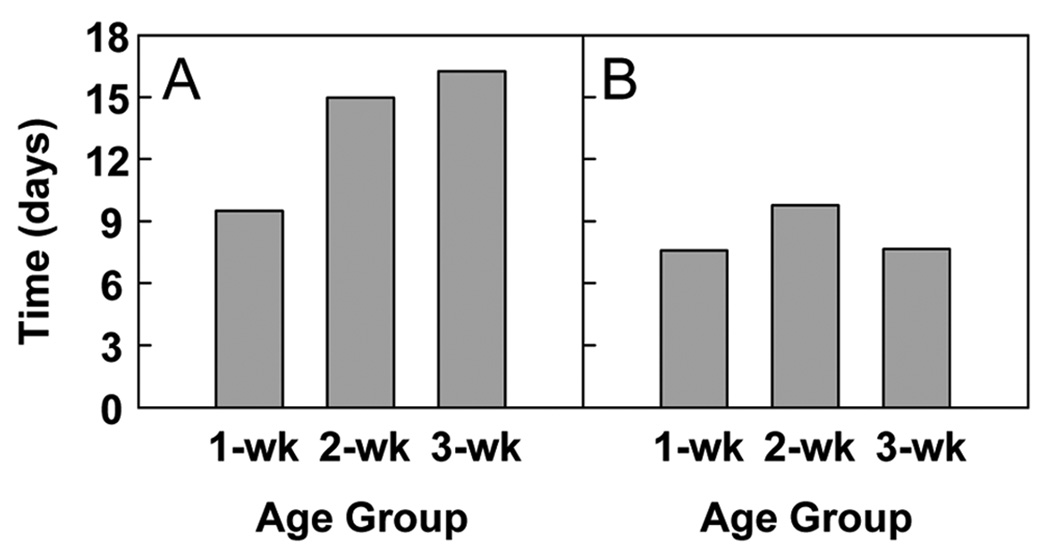
In kidney, the mean cell-cycle time increased with age moderately from 9 to 16 days (P < 0.001; Fig. 5A). In liver, the cell-cycle time did not change significantly with age (Fig. 5B).
Figure 5. Mean cell-cycle time.
The mean cell-cycle time at each age was calculated from the DLI data for tubular epithelial cells in the renal cortex (A, P < 0.001) and for hepatocytes (B, P = NS).
Area under DLI curve
We also calculated the area under the DLI curve, which is proportional to the fraction of cells in S-phase at t = 0 that go on to divide at least one more time between t = 1 day and t = 29 days.
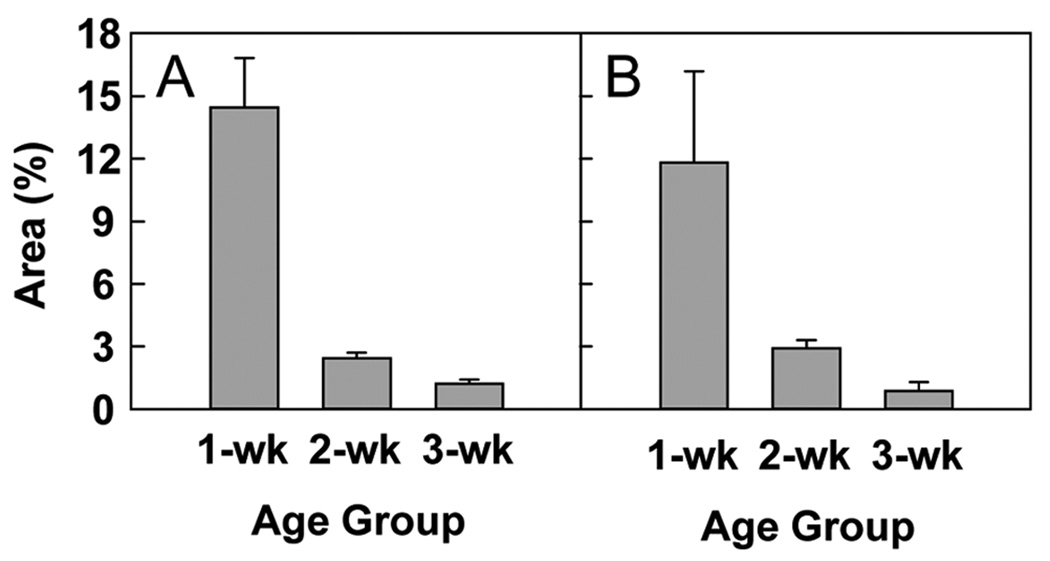
In 1-week-old kidney, the area under the DLI curve was 14%. By 2 weeks of age, this area dropped to 2% and continued to decrease to 1% at 3 weeks (P < 0.001; Fig. 6A). In liver, the area under the DLI curve was 12% at 1 week of age, and then declined to 3% in 2-week-old animals and 1% in 3-week-old animals (P = 0.001; Fig. 6B).
Figure 6. Area under double-labeling index curve (mean ± SEM).
This measurement was calculated for each age from the DLI data for tubular epithelial cells in the renal cortex (A, P < 0.001) and for hepatocytes (B, P = 0.001). The area under the DLI curve is proportional to the percentage of cells dividing at t = 0 that will divide again in the next four weeks.
Cell size
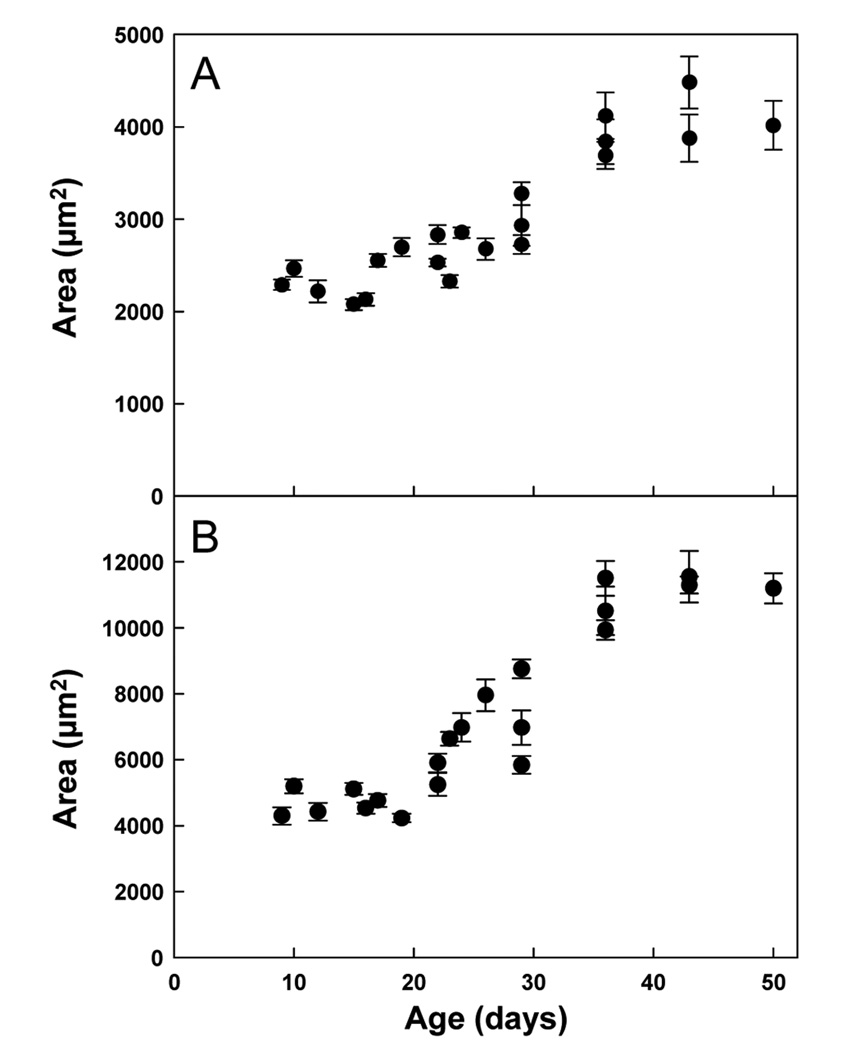
In kidney, the mean cross-sectional area occupied by a cortical tubular epithelial cell increased 1.8-fold from 1 to 7 weeks of age (P < 0.001; Fig. 7A). In liver, the area occupied by a hepatocyte increased 2.6-fold over the same period (P < 0.001; Fig. 7B).
Figure 7. Cross-sectional area per cell (mean ± SEM).
The area of a region was divided by the number of nuclei to obtain the area occupied by each cell. This value includes both the average intracellular and extracellular area per cell. Linear regression analysis was used to determine whether the mean area occupied per cell changed significantly with age. A significant increase was observed for both renal tubular epithelial cells (A, P < 0.001) and hepatocytes (B, P < 0.001).
Discussion
In the mouse, proliferation of renal tubular epithelial cells decreased after 2 weeks of age as assessed by both in vivo 3H-thymidine labeling and BrdU labeling. Proliferation of hepatocytes also decreased with age, beginning at, or before, 2 weeks of age. In the same cell populations, cell-cycle time was measured by labeling with 3H-thymidine and then, after a variable length of time, with BrdU and counting double-labeled cells. At 1 week of age, cell-cycle time varied considerably in both organs, ranging from 1 to 28 days, with the most frequently observed cell-cycle times between 2 and 7 days. As the mice aged from 1 week to 3 weeks, the average kidney cell-cycle time increased modestly by 1.7 fold, while the liver cell-cycle time did not change significantly. We then used the area under DLI curve to assess the fraction of cells in S-phase at time zero that will divide at least one more time in the following four weeks. We found that this value dropped off markedly, approximately 10 fold, from 1 to 3 weeks of age, indicating that the growth fraction is rapidly declining during the time of somatic growth deceleration and that, after 1 week of age, most cells that undergo cell division are doing so for the final time. Taken together, the findings suggest that somatic growth deceleration occurs primarily not because of an increase in cell-cycle time but rather because of a decrease in the growth fraction.
One of the most striking findings in the current study is that, beginning at 2 weeks of age, cells that labeled with 3H-thymidine rarely labeled with BrdU in the next 4 weeks. For example, only 1% of the cells that labeled with 3H-thymidine at 3 weeks of age subsequently went on to label with BrdU. If one assumes that the S-phase lasts for approximately 8 hours (9–11) then the BrdU, which was given once every 24 hours, would be expected to catch approximately 1/3 of the cells as they entered their next S-phase. Thus, of the cells that underwent cell division at 3 weeks of age, only approximately 3% went on to divide again, implying that the vast majority, approximately 97%, were undergoing their last cell division. The data therefore suggest that cell proliferation is shutting down in the first weeks of postnatal life in the mouse and that the remaining increase in cell number results in large part from cells undergoing their final cell division. Many somatic cells, including hepatocytes and renal tubular epithelial cells appear to have a limit (not necessarily cell-autonomous) to the number of times they can divide, thus limiting somatic growth. Our data suggest that various individual cells within a tissue reach this limit at variable times, such that some cells undergo their last cell division at 2 weeks of age, while others undergo their last cell division at 6 weeks of age. Thus, the variation in when cells reach this proliferative capacity may serve to stagger the timing of the final division for each cell and result in a gradual decline in somatic growth.
One possible confounding effect entailed in our approach is that 3H-thymidine is incorporated into genomic DNA and thus might affect subsequent proliferation (12). However, this effect is unlikely to explain the observed low double-labeling indices because the low values were observed only in 2- and 3-week-old mice, but not 1-week-old mice.
We also observed considerable fluctuation in the labeling indices between different time points. This variability may be due in part to the fact that each time point represents a different litter of mice. For example, the low DLI in the 3–4 day time point of the 1-week-old mice in both kidney and liver probably occurred because that litter was not growing as rapidly as others, judging by their weight gain. In retrospect, it would have been better to obtain mice for each time point from a variety of litters.
Postnatal cell cycle parameters have been measured previously in the liver of rats. These studies have yielded conflicting reports of cell-cycle time and growth fraction. Post et al. reported that the cell-cycle time increased from 14 hours to 22 hours (values far lower than ours) and that the growth fraction decreased from 0.3 to 0.1 as the rats aged from 1 to 3 weeks (13). That study used a single labeling agent, 3H-thymidine, administered at time zero, and then after various intervals, examined cells undergoing mitosis to determine the fraction that contained label. The reported cell-cycle time was based on a wave of labeled cells in prophase at 14–22 hours, but this wave was not followed by a wave of labeled cells in metaphase or anaphase. Schultze et al., using a methodology similar to Post et al., reported cell-cycle times similar to those found in the current study, with the cell-cycle time ranging from 2 to 12 days and a mean cell-cycle time of 6–7 days. However, that study reported a growth fraction close to 1 in 3-week-old rats (14). Our study used a double-labeling approach to identify cells that have proceeded to a second S-phase, rather than trying to identify cells that have proceeded to a second mitosis based on microscopic morphology. Differences between the current study and that of Schultze et al. might reflect the difference in species studied, since rats might be expected to continue growth longer than mice. However, the discrepancies between studies may also reflect the fact that measurement of cell-cycle kinetic parameters is generally indirect, requiring mathematical analyses that depend upon simplifying assumptions. Consequently, additional studies using a variety of approaches to address these questions would be of value.
In our study, we analyzed not only cell division but also cell enlargement. Mean cross-sectional area per cell (which includes both intracellular and extracellular space) increased with age, indicating that somatic growth is related to an increase in individual cell volume as well as an increase in cell number. The increase in cell size occurred primarily after 3 weeks of age, as proliferation was slowing. Before that age, cell size may be limited by cell division since each division physically halves the cell volume. With increasing age, individual cells cease division, and thus might continue to increase in volume until reaching a greater size limit (15). Our finding that early somatic growth is caused primarily by hyperplasia while later growth also involves substantial hypertrophy is consistent with the findings of Enesco and Leblond (16) Winick and Noble (17) in the rat but not those of Sands et al. (18).
In this study, we focused on the changes in cell proliferation and cell size that occur with age. However, the rate of organ growth is also determined by the rate of cell death. A previous study by Coles et al. (19) suggests that, during early postnatal life, apoptosis in the rat kidney is declining rapidly with age. Therefore, at least in the rat kidney, the normal deceleration in overall growth appears to be caused by decreasing proliferation and opposed by augmented cellular hypertrophy and declining apoptosis.
It would be important to determine whether the conclusions of this experimental work in mice apply to human growth. For example, it is not known whether growth deceleration in children is due to prolongation of the cell-cycle time or to decreased growth fraction. Similarly, it is not known how much of childhood growth is ascribable to hyperplasia and how much to hypertrophy.
In conclusion, the data suggest that somatic growth deceleration in the mouse during postnatal life is not primarily the result of an increase in cell-cycle time, but rather of a decrease in the growth fraction. In both kidney and liver, beginning at 2 weeks of age, cells appear to drop out of the proliferative pool rapidly. The findings also suggest that growth during the deceleration phase results from two interrelated processes. First, cells reach their proliferative limit and undergo their final cell divisions, which are staggered over time. Second, individual cells enlarge to a greater volume, perhaps because they are relieved of the size constraint imposed by cell division.
Acknowledgments
Financial Support: This research was supported by the Intramural Research Program of the National Institute of Child Health and Human Development, NIH.
Abbreviations
- BLI
BrdU labeling index
- BrdU
5’-bromo-2’deoxyuridine
- DLI
double-labeling index
- 3H-thymidine
[methyl-3H]thymidine
- HLI
3H-thymidine labeling index
References
- 1.Goedbloed JF. The embryonic and postnatal growth of rat and mouse. I. The embryonic and early postnatal growth of the whole embryo. A model with exponential growth and sudden changes in growth rate. Acta Anat (Basel) 1972;82:305–306. [PubMed] [Google Scholar]
- 2.Hughes PC, Tanner JM. A longitudinal study of the growth of the black-hooded rat: methods of measurement and rates of growth for skull, limbs, pelvis, nose-rump and tail lengths. J Anat. 1970;106:349–370. [PMC free article] [PubMed] [Google Scholar]
- 3.Tanner JM, Davies PS. Clinical longitudinal standards for height and height velocity for North American children. J Pediatr. 1985;107:317–329. doi: 10.1016/s0022-3476(85)80501-1. [DOI] [PubMed] [Google Scholar]
- 4.Rose SR, Municchi G, Barnes KM, Kamp GA, Uriarte MM, Ross JL, Cassorla F, Cutler GB., Jr Spontaneous growth hormone secretion increases during puberty in normal girls and boys. J Clin Endocrinol Metab. 1991;73:428–435. doi: 10.1210/jcem-73-2-428. [DOI] [PubMed] [Google Scholar]
- 5.Juul A, Holm K, Kastrup KW, Pedersen SA, Michaelsen KF, Scheike T, Rasmussen S, Muller J, Skakkebaek NE. Free insulin-like growth factor I serum levels in 1430 healthy children and adults, and its diagnostic value in patients suspected of growth hormone deficiency. J Clin Endocrinol Metab. 1997;82:2497–2502. doi: 10.1210/jcem.82.8.4137. [DOI] [PubMed] [Google Scholar]
- 6.Nilsson O, Baron J. Fundamental limits on longitudinal bone growth: growth plate senescence and epiphyseal fusion. Trends Endocrinol Metab. 2004;15:370–374. doi: 10.1016/j.tem.2004.08.004. [DOI] [PubMed] [Google Scholar]
- 7.Hume WJ. DNA-synthesizing cells in oral epithelium have a range of cell cycle durations: evidence from double-labelling studies using tritiated thymidine and bromodeoxyuridine. Cell Tissue Kinet. 1989;22:377–382. doi: 10.1111/j.1365-2184.1989.tb00222.x. [DOI] [PubMed] [Google Scholar]
- 8.National Research Council. Guide for the Care and Use of Laboratory Animals. Washington, DC: National Academy Press; 2003. [Google Scholar]
- 9.Chwalinski S, Potten CS, Evans G. Double labelling with bromodeoxyuridine and [3H]-thymidine of proliferative cells in small intestinal epithelium in steady state and after irradiation. Cell Tissue Kinet. 1988;21:317–329. doi: 10.1111/j.1365-2184.1988.tb00790.x. [DOI] [PubMed] [Google Scholar]
- 10.Hayes NL, Nowakowski RS. Dynamics of cell proliferation in the adult dentate gyrus of two inbred strains of mice. Brain Res Dev Brain Res. 2002;134:77–85. doi: 10.1016/s0165-3806(01)00324-8. [DOI] [PubMed] [Google Scholar]
- 11.Nowakowski RS, Lewin SB, Miller MW. Bromodeoxyuridine immunohistochemical determination of the lengths of the cell cycle and the DNA-synthetic phase for an anatomically defined population. J Neurocytol. 1989;18:311–318. doi: 10.1007/BF01190834. [DOI] [PubMed] [Google Scholar]
- 12.Painter RB, Drew RM, Hughes WL. Inhibition of HeLa growth by intranuclear tritium. Science. 1958;127:1244–1245. doi: 10.1126/science.127.3308.1244. [DOI] [PubMed] [Google Scholar]
- 13.Post J, Hoffman J. Changes in the replication times and patterns of the liver cell during the life of the rat. Exp Cell Res. 1964;36:111–123. doi: 10.1016/0014-4827(64)90165-x. [DOI] [PubMed] [Google Scholar]
- 14.Schultze B, Kellerer AM, Grossmann C, Maurer W. Growth fraction and cycle duration of hepatocytes in the three-week-old rat. Cell Tissue Kinet. 1978;11:241–249. doi: 10.1111/j.1365-2184.1978.tb00892.x. [DOI] [PubMed] [Google Scholar]
- 15.Ross DW. Cell volume growth after cell cycle block with chemotherapeutic agents. Cell Tissue Kinet. 1976;9:379–387. doi: 10.1111/j.1365-2184.1976.tb01286.x. [DOI] [PubMed] [Google Scholar]
- 16.Enesco M, Leblond CP. Increase in Cell Number As A Factor in Growth of Organs and Tissues of Young Male Rat. J Embryol Exp Morphol. 1962;10:530–563. [Google Scholar]
- 17.Winick M, Noble A. Quantitative changes in DNA, RNA, and protein during prenatal and postnatal growth in the rat. Dev Biol. 1965;12:451–466. doi: 10.1016/0012-1606(65)90009-6. [DOI] [PubMed] [Google Scholar]
- 18.Sands J, Dobbing J, Gratrix CA. Cell number and cell size: organ growth and development and the control of catch-up growth in rats. Lancet. 1979;2:503–505. doi: 10.1016/s0140-6736(79)91556-3. [DOI] [PubMed] [Google Scholar]
- 19.Coles HS, Burne JF, Raff MC. Large-scale normal cell death in the developing rat kidney and its reduction by epidermal growth factor. Development. 1993;118:777–784. doi: 10.1242/dev.118.3.777. [DOI] [PubMed] [Google Scholar]


