Abstract
Introduction
Drugs applied intratympanically in humans are believed to enter the cochlea primarily through the round window membrane (RWM). Local drug treatments of the ear are commonly evaluated in rodent models. The otic capsule is much thinner at the cochlear apex in rodents than in humans. We therefore investigated whether drugs applied to the middle ear could enter perilymph through the otic capsule as well as through the RWM.
Methods
The distribution of gentamicin and the marker trimethylphenylammonium (TMPA) along the guinea pig cochlea was assessed with sequential apical perilymph sampling following two delivery paradigms that included i) completely filling the tympanic bulla with solution, and ii) applying the solution to the RWM only. In addition, TMPA entry into perilymph of the third turn was measured with ion-selective electrodes while the bulla was filled with TMPA solution.
Results
In application protocols that allowed drug to contact the otic capsule (by completely filling the bulla) markedly higher drug concentrations were found in the apical, low-frequency regions of the cochlea compared with drug applications to the RWM only.
Conclusions
Gentamicin and TMPA can enter perilymph of guinea pigs through the RWM and simultaneously through the bony otic capsule. Drug distribution along the cochlea following intratympanic applications will therefore be dramatically different in rodents and humans. Results obtained from intratympanic drug treatments of animals, in which the bulla is filled with solution and contacts the bony capsule of the cochlea, do not provide a good model for the human situation.
Introduction
In a number of prior studies we have quantified the entry of markers and drugs from the middle ear into cochlear perilymph through the round window membrane (RWM).1–5 In each of these studies, the drug or marker was irrigated across the RWM with absorbent wicks used to minimize fluid accumulation in the bulla. This allowed a constant concentration to be maintained on the RWM that aided the quantitative interpretation of results. In all of these studies, it was found that the application protocol produced a substantial drug gradient along the cochlea, with highest levels at the base and with low levels at the apex. A second, unrecognized consequence of this protocol was that the applied drug solutions did not accumulate in the bulla and did not bathe the bony otic capsule.
Other investigators have applied drugs to the cochlea by partially or completely filling the auditory bulla with solution.6–10 This approach aims to mimic the intratympanic drug application method commonly used in humans.11 Using this protocol in animals, drug not only contacts the RWM but also contacts the mucosa covering the bony otic capsule. In the present study, we have examined the distribution of drug in the guinea pig cochlea following drug application by filling the bulla with a drug-containing solution. While the human otic capsule is known for the thickness and hardness of the bone, the cochleae of many experimental animals (guinea pig, chinchilla, gerbil, mouse and rat) protrude into the auditory bulla and in many cases have thin bony walls. The guinea pig cochlea, particularly in young individuals, is translucent, with the pigmentation of stria vascularis being visible with an operating microscope. If drugs can pass through the otic capsule and into perilymph this could have major influence on experimental design and data interpretation of preclinical inner ear drug delivery experiments in animals that involve applying drugs to the bulla and interpretation of their results for the human situation.
Methods
Experiments were performed on 24 NIH-strain pigmented guinea-pigs of either sex and weighing 250–500 g. All measurements were made as acute procedures on animals surgically anesthetized with Inactin (sodium thiobutabarbital, initial dose: 100 mg/kg IP). Animals were artificially ventilated through a tracheal cannula, with tidal volume adjusted to maintain 4–5% end-tidal CO2. Oxygen and heart rate were monitored with a pulse oximeter (Surgivet V3304, Waukesha, WI). Rectal temperature was maintained at 38°C with a DC-powered, thermistor-controlled heating pad. The left jugular vein was cannulated for the administration of supplemental anesthetic doses. During measurements, pancuronium bromide was given to reduce myogenic recording artifacts. Protocols used for this study were approved by the Animal Studies Committee of Washington University (Approval number 20060031).
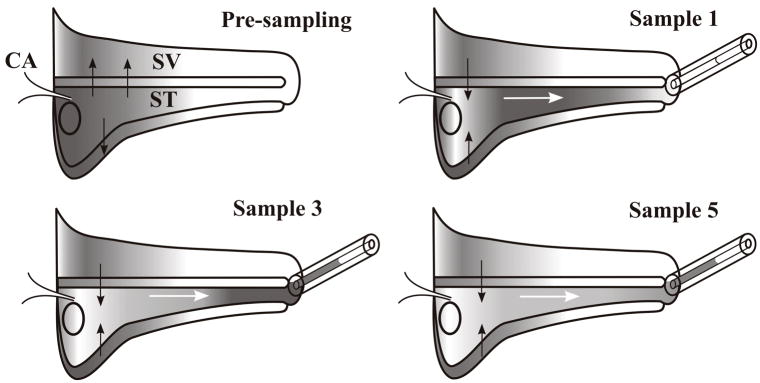
In most experiments, the auditory bulla was initially exposed by a post-auricular, lateral approach and opened. The bulla was completely filled with 150–200 μl of solution containing 20 mM or 40 mM trimethylphenylammonium chloride (TMPA: Ionic formula weight 136.2) in a background of artificial perilymph with NaCl reduced to maintain normal osmolarity, or with solution containing 40 mg/ml gentamicin (Refobacin, Merck Pharma GmbH, Darmstadt, Germany; Ionic formula weight 466 4). After two hours, the bulla was opened by a ventral approach. The mucosa on the cochlear apex was removed and the surface of the bone was washed with artificial perilymph solution. A thin layer of cyanoacrylate glue was applied to the apex, after which a two-part silicone (WPI Kwik-Cast) was used to build a small “cup” at the apex. At 140–160 min after the initial application, the apex was perforated with a fine pick and ten, 1 μl fluid samples were collected sequentially into calibrated capillary tubes, as illustrated in Figure 1. When the apex was perforated, perilymph was displaced by cerebrospinal fluid (CSF) entering the basal turn of scala tympani through the cochlear aqueduct. The first sample contained perilymph originating from the apical cochlear regions while the third to fifth samples contained perilymph predominantly from the lower turns of scala tympani. Later samples contained CSF that had washed through the scala, accumulating drug from previously-loaded regions as shown in the figure. In TMPA experiments, samples were diluted with 25 μl of artificial perilymph. Samples and standards of similar volume were transferred to a block containing micro-wells and the TMPA content was measured with TMPA-selective microelectrodes as described elsewhere.3 In gentamicin experiments, samples were diluted in 120 μl of Abbott Labs IVD 9519 dilution buffer and gentamicin was quantified with a fluorescence-polarization-immunoassay (TDX SLX Analyzer, Abbot, Abbott Park, Illinois, U.S.A.).4
Figure 1.
Schematic diagram of the uncoiled cochlea showing the sequential sampling of perilymph with a capillary tube from an apical cochleostomy. The pre-sampling condition shows the typical drug distribution following application to the basal turn. Solid arrows indicate the drug movements to regions of lower concentration, including scala vestibuli and other compartments of the cochlea, such as the spiral ligament and the modiolar spaces, represented by the compartment below scala tympani. When the apex is perforated, perilymph is displaced by cerebrospinal fluid entering through the cochlear aqueduct, causing volume flow, as indicated by white arrows. The first sample (Sample 1) consists of perilymph originating in the apical turns. Later samples (Samples 3–5) consist of perilymph originating from basal regions. Subsequent samples consist of CSF that has passed through the scala, accumulating drug from regions that were previously loaded, as shown by solid arrows. Abbreviations are ST: scala tympani; SV: scala vestibuli; CA: cochlear aqueduct.
All TMPA solutions were made in an artificial perilymph containing (in mM) NaCl (127.5), KCl (3.5), NaHCO3 (25), CaCl2 (1.3), MgCl2 (1.2), NaH2PO4 (0.75), Glucose (11). Either 20 or 40 mM of TMPA was added and NaCl was reduced by an equal molar amount to maintain solution osmolarity near 292 mOsm/l. In some of the studies utilizing TMPA as a marker, 10 mg/ml of benzyl alcohol was included in the solution. Benzyl alcohol at this concentration is present in many commonly used clinical intratympanic medications and has been shown to increase the permeability of the RWM to TMPA.12 Benzyl alcohol was added in protocols, as indicated, where TMPA levels of perilymph samples would have been otherwise too low to characterize the entry rate reliably.
In four experiments, the entry of TMPA into apical and basal regions of the cochlea was compared by building a silicone “dam” to divide the bulla roughly at its midpoint at about the position of the second turn. This allowed TMPA solution to be applied selectively to either the apical or basal (including the round window) portions of the cochlea. After a two hour application period, perilymph was sampled from the apex as described above.
In two experiments, a double-barreled TMPA-selective microelectrode was sealed into the third turn of scala vestibuli with cyanoacrylate and silicone adhesives. The bulla was filled with an isotonic 40 mM TMPA solution (in sodium-reduced artificial perilymph) and the time course of TMPA entry into perilymph was measured.
In nine experiments, the time course of TMPA changes in the RW niche after the bulla was filled with solution was measured with ion-selective electrodes. The decline in TMPA concentration in the middle ear was measured either with or without benzyl alcohol in the solution. TMPA applications were repeated in the experiments, but measurements of TMPA loss from “normal” solution (without benzyl alcohol) were never performed after the preparation had been exposed to solution with benzyl alcohol.
Some results were interpreted with the aid of computer simulations of the experiments using procedures detailed in a number of prior publications 1,2,3,5. A version of the Visual Basic program that simulates solute movements in the cochlear fluids can be downloaded http://oto.wustl.edu/cochlea/. A modified version of the simulator, incorporating algorithms for fluid flows in the cochlea and of fluid collections representing sequential sampling of fluids from the cochlear apex, was used to simulate the experiments.
Results
1) TMPA Marker Experiments
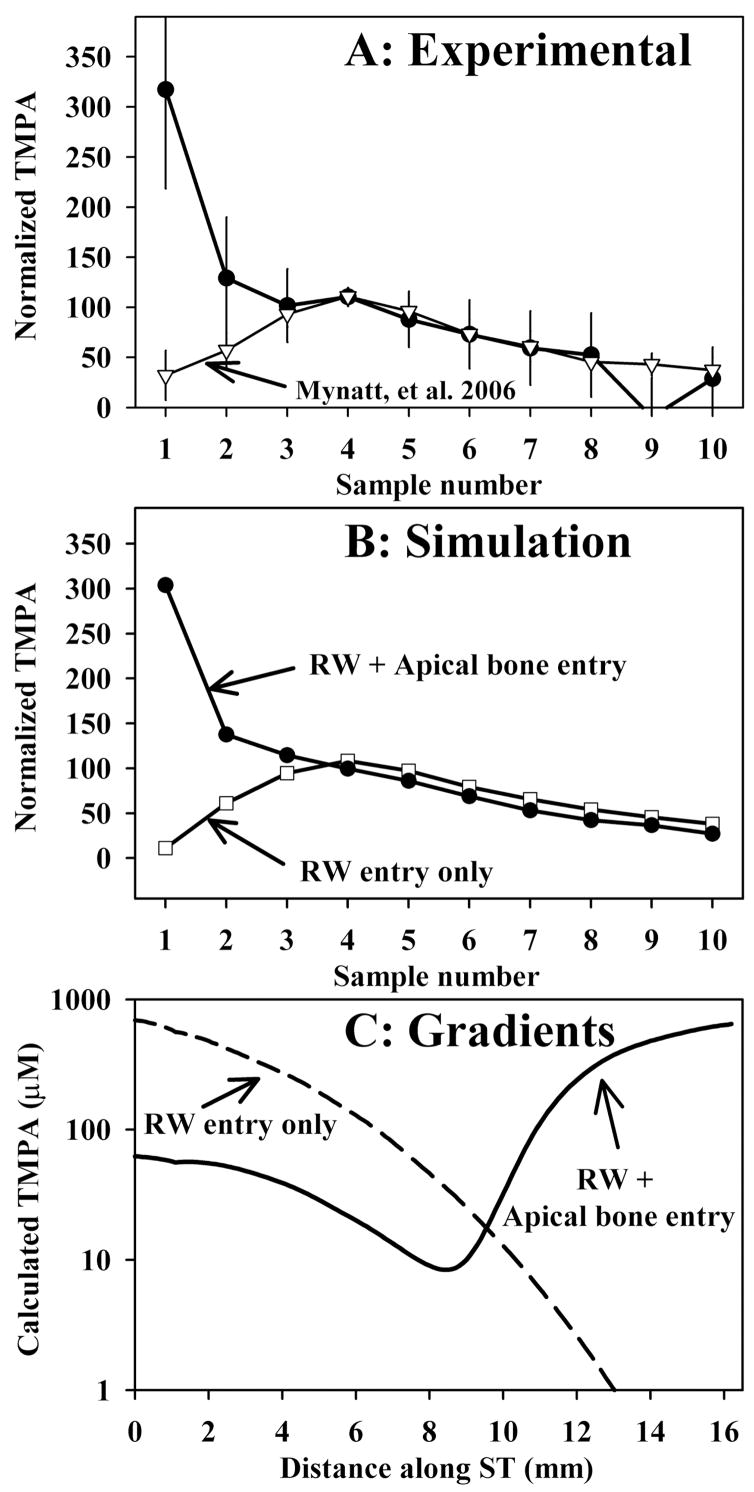
The results of experiments in which TMPA was applied to the ear by completely filling the auditory bulla with solution containing 20 or 40 mM TMPA and 10 mg/ml benzyl alcohol, followed by perilymph sampling from the apex after a two hour period, are shown in Figure 2. The amplitude of the curves was normalized by calculating each sample as a percentage of the average of samples 3, 4 and 5, which represent perilymph from the basal turn. In these experiments, the first sample, representing perilymph from the apical turns of ST was higher than all other samples, indicating relatively high TMPA content of perilymph from the apex under this protocol. In Figure 2A, the data are compared with those published by Mynatt et al.,3 in which perilymph was sampled after 2 hours irrigation of the RWM with TMPA-containing solution. The difference between the two curves, specifically that the first two samples contain higher TMPA levels when the bulla is filled with solution, is striking. The high concentration seen in the initial samples cannot be accounted for by drug entering perilymph solely through the RWM. Figure 2B shows simulations of the averaged experimental data performed in a similar manner to that described by Mynatt et al.3 TMPA application, distribution and apical perilymph sampling procedures are all incorporated into the simulation, using experimental timing and sample volume parameters averaged for the group. The two sample curves were calculated with identical simulation parameters, except that in the case of the solid curve a communication between the middle ear and perilymph (representing entry through the bone) was added for locations greater than 10 mm from the base. The characteristics of TMPA entry into perilymph through the bone that best fit the data was an entry half time of 375 min. Figure 2C shows the calculated TMPA gradients along scala tympani prior to sampling for each condition. In order to account for the sample data, it was necessary for the perilymph concentration in apical regions to be substantially higher than that of the basal turn. The fact that the TMPA gradient is reversed (higher at the apex than at the base) cannot be accounted for if TMPA only enters the basal turn through the RWM. To match the experimental data, lower concentrations were necessary in the basal part of scala tympani with the bulla-filling protocol (Figure 2C), the reasons for which will be considered below.
Figure 2.
Perilymph sampling results compared when TMPA was applied by completely filling the bulla with solution (Panel A: solid symbols, n=3, bars indicate SD) and with TMPA applied by irrigating solution across the RWM (Panel A; open symbols, n=8, from Mynatt et al.3) When TMPA was applied by filling the bulla with solution the initial samples taken from the apex were high, indicating relatively higher concentrations in the apical perilymph. In these experiments, the TMPA solution contained 10 mg/ml benzyl alcohol to increase RWM permeability. Sample concentrations from each experiment were normalized, setting the average of samples 3, 4 and 5 to 100.
Panel B: Computer simulations of the sampling experiments from Panel A. Open symbols show simulations in which TMPA enters only through the RWM, with parameters adjusted to fit the data from experiments in which TMPA was applied by irrigation across the RWM. The curve with closed symbols in Panel B was calculated with identical parameters but includes an additional communication between the middle ear and perilymph (representing entry through the bone) for apical perilymph locations. Panel C: TMPA concentration gradients along scala tympani prior to sampling derived from the computer simulation of experiments. The two curves show the calculated distribution of TMPA along the cochlea that accounts for the sample concentrations observed under each protocol.
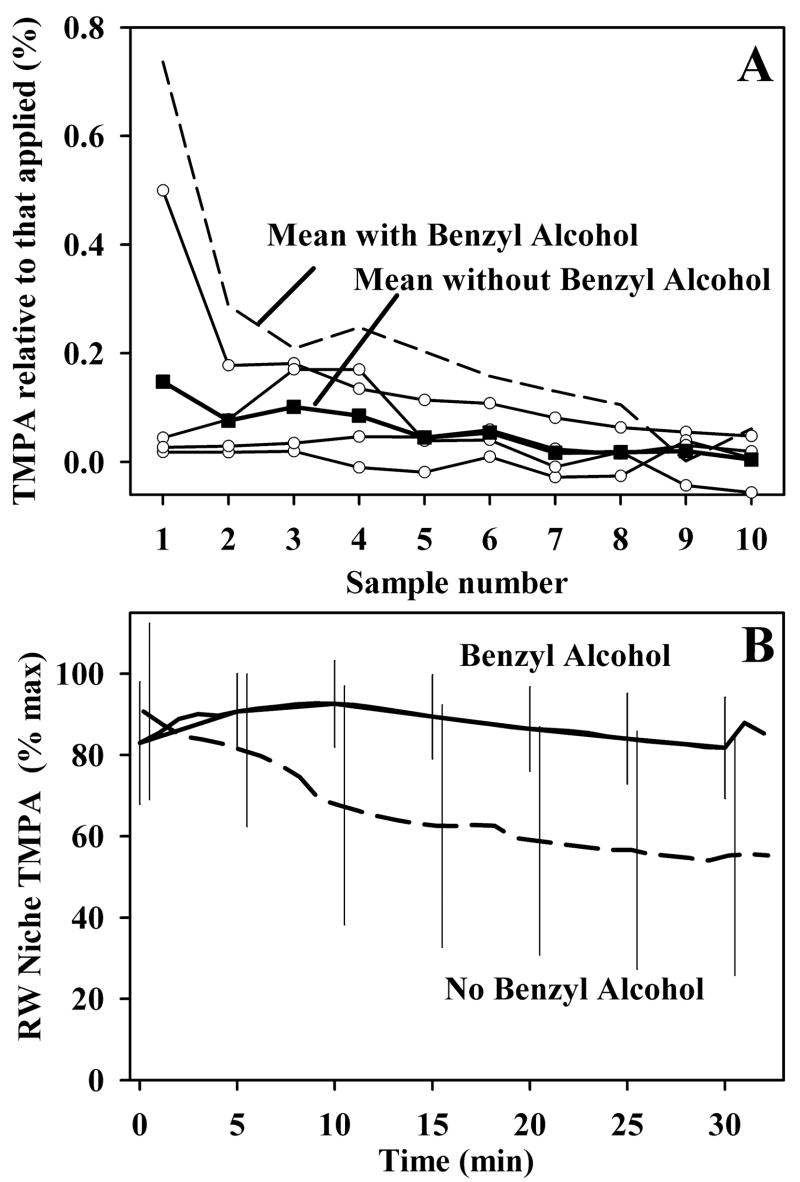
In the experiments shown in Figure 2A, the TMPA solution used to fill the bulla contained 10 mg/ml benzyl alcohol. This concentration is present, as a preservative, in many clinically utilized intratympanic compounds. Prior studies have shown that this concentration permeabilizes the RWM12. When similar experiments were performed by filling the bulla with 20 or 40 mM TMPA without benzyl alcohol, sample concentrations were lower and in some experiments could not be measured reliably. Figure 3 shows the sample data for experiments without benzyl alcohol, in this case with concentrations normalized with respect to the applied concentration. The samples contained substantially lower TMPA content when benzyl alcohol was absent from the medium. This results partly from the permeabilizing effect benzyl alcohol has on the RWM.3 However, measurements of middle ear concentrations of TMPA with and without benzyl alcohol in the medium also demonstrate another contributing factor, as shown in Figure 3B. When benzyl alcohol was absent from the medium, TMPA concentration in the middle ear declined quite rapidly, falling to a median of 61.5% of the peak value when averaged over the 25 to 30 minute period (n=18). In contrast, with benzyl alcohol in the medium, TMPA decline in the middle ear occurred significantly more slowly, falling to a median value of 84.5 % of the peak value in the 25 to 30 minute period (n=8) (Mann Whitney Rank Sum Test, p=0.022). Benzyl alcohol thus maintains the gradient driving TMPA to enter the cochlea by slowing the rate that TMPA is cleared from the middle ear. The absolute concentration data for these experiments and for the Mynatt et al. (2006) study are summarized in Table 1. When irrigated across the RWM for two hours,3 basal turn TMPA (average of samples 3, 4 and 5) reached 1.2% of the applied concentration. In contrast, when applied by filling the bulla with solution, TMPA in the basal turn was significantly lower (ANOVAR, Dunn’s procedure, p<0.05), averaging 0.08% of the applied concentration. This lower amount was largely due to the decline of TMPA concentration in the middle ear during the two hour application period. With benzyl alcohol in the medium the basal turn concentration averaged 0.22% of the applied concentration, which was higher than that without benzyl alcohol in the medium. This intermediate value was not significantly different from either the no-benzyl alcohol or the RW irrigated TMPA levels (ANOVAR, Dunn’s procedure).
Figure 3.
Panel A: Influence of benzyl alcohol on sample measurements. Curves with open symbols show samples taken in experiments without benzyl alcohol in the medium. The mean of the four curves is shown as solid symbols (solid symbols show the mean). Concentrations are shown normalized with respect to the applied concentration. TMPA levels were sometimes too low to reliably characterize the curve. The mean curve obtained when benzyl alcohol was included in the medium (dashed line, from Figure 2A) is shown for comparison. Lower levels of TMPA were found in the samples when benzyl alcohol was absent from the medium.
Panel B Influence of benzyl alcohol on the rate of TMPA clearance from the middle ear. TMPA was measured in the round window niche with TMPA-selective electrodes. The curves show mean TMPA concentrations measured in the niche without benzyl alcohol in the medium (dashed curve, n=18) or with 10 mg/ml benzyl alcohol present in the medium (solid curve, n=8). Bars indicate standard deviation. The rate of TMPA clearance from the middle ear was significantly slower when benzyl alcohol was included in the medium.
Table 1.
Basal turn sample TMPA concentrations under different application protocols
| 20 mM TMPA applied | 40 mM TMPA applied | % applied TMPA | |
|---|---|---|---|
| Round window niche irrigation. Mynatt et al., 2006 | 240.9 μM
SD 244, n=8 |
- | 1.20 %
SD 1.22, n=8 |
| Bulla filled. No benzyl alcohol in the medium | 0 μM (undetectable) n=1 | 41.6 μM
SD 21.7, n=3 |
0.08 %
SD 0.07, n=4 |
| Bulla filled. Benzyl alcohol in the medium | 35.0 μM
n=1 |
96.8 μM
SD 58.9, n=2 |
0.22 %
SD 0.11, n=3 |
Basal turn concentrations were calculated as the average of samples 3, 4 and 5 taken from the apex.
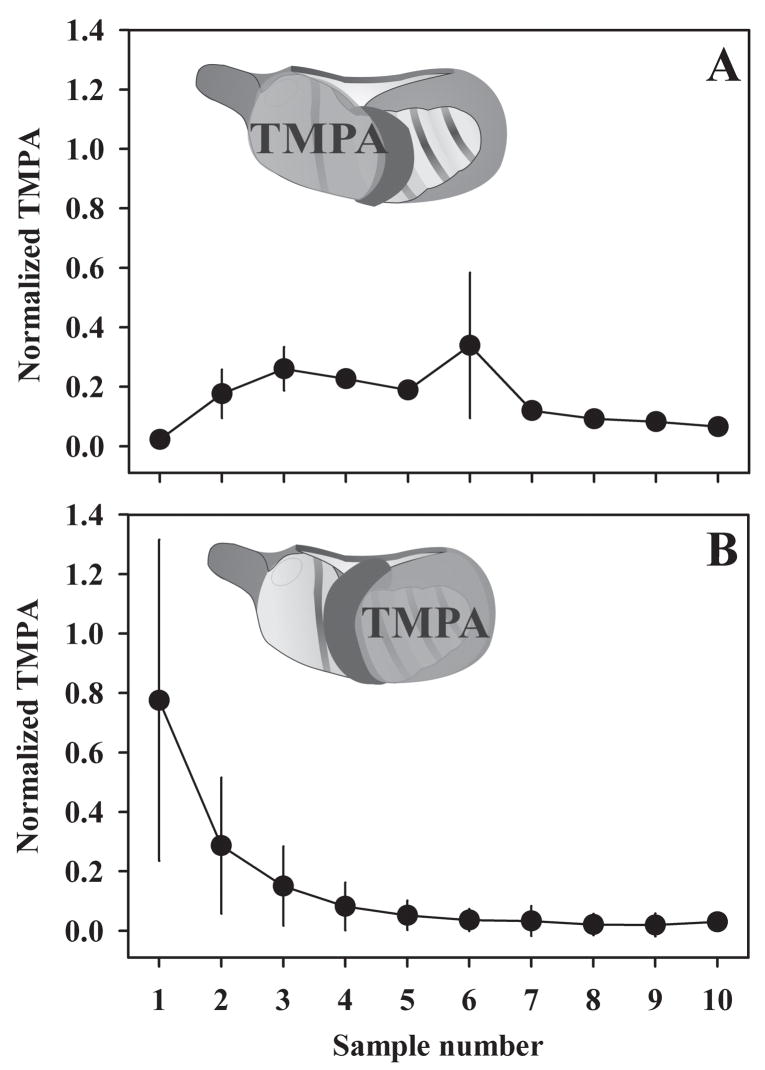
Entry of TMPA through the bony otic capsule was further confirmed by applying TMPA to specific portions of the middle ear, as shown in Figure 4. A silicone “dam” was built in each experiment to prevent fluid spreading throughout the entire bulla. When TMPA was applied to the basal turn only (Figure 4A), the initial sample concentrations (samples 1 and 2) were low, consistent with low TMPA levels in the apical turns. When TMPA was applied to the apical turns only (Figure 4B), the initial sample concentrations were high, consistent with high TMPA levels in the apical turns, and samples originating from the basal turn (samples 3, 4 and 5) were lower.
Figure 4.
Isolation entry components by applying TMPA solution separately to the apical and basal regions of the cochlea. A silicone “dam” (shown black in the inset schematic) was built to prevent fluid from spreading throughout the entire bulla. In experiments where applied fluid bathed the basal turns only (Panel A, n=2), initial sample concentrations (samples 1 and 2) were low, consistent with low TMPA levels in the apical turns. In experiments where applied fluid bathed the apical turns only (Panel B, n=2), initial sample concentrations were high, consistent with high TMPA levels in the apical turns. Concentrations were normalized as a percentage of the applied concentration. Bars indicate standard deviation.
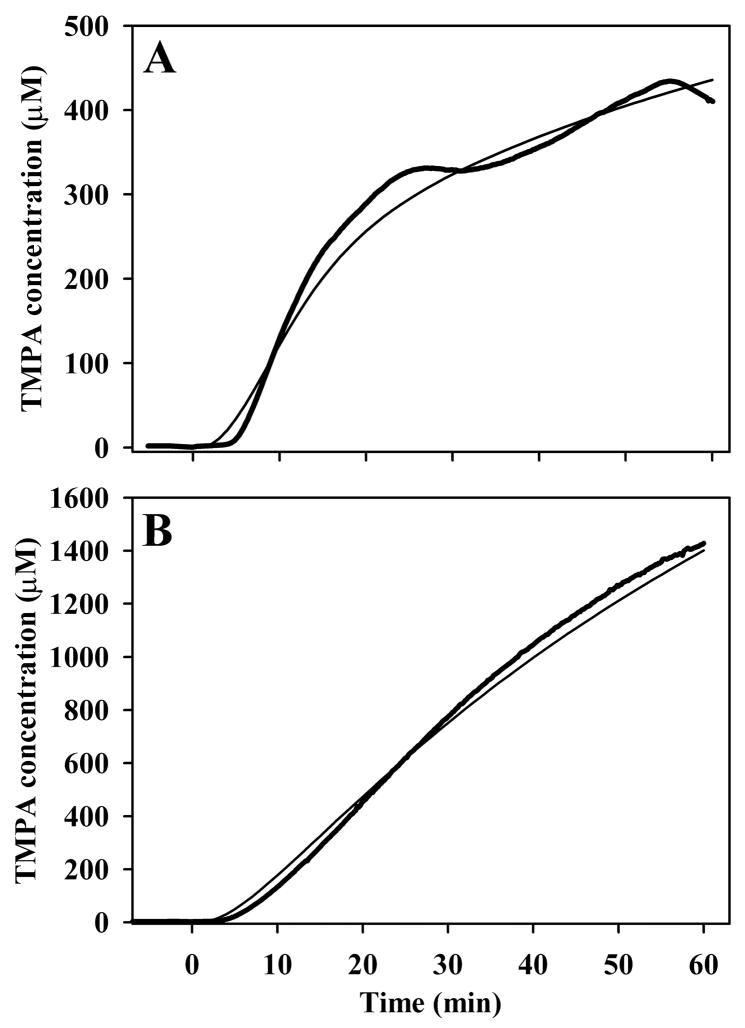
Direct measurements of TMPA in the third turn of the cochlea during TMPA application to the bulla are shown in Figure 5. Heavy lines show TMPA concentration measured with TMPA-selective electrodes in third turn of scala vestibuli in two separate experiments when the bulla was filled with 40 mM TMPA solution. TMPA concentration started increasing within 5 minutes of the applications, which is far too quickly to be accounted for by entry through the RWM. To diffuse to the third turn along ST following entry through the RWM would require at least 90 min1. The thin curves show the time courses calculated by simulations of the experiment based on a communication between perilymph and the middle ear (representing entry through the bone) with half-times of 1100 min (Figure 5A) and 360 min (Figure 5B) respectively. In the simulations, TMPA entry into the scala for a distance 0.8 mm on each side of the recording location was blocked, to represent the area of silicone sealing compound around the electrode and to account for the small delay before TMPA reached the electrode.
Figure 5.
Heavy curves in panels A and B show TMPA concentration measured with TMPA-selective electrodes in third turn of scala vestibuli in two separate experiments when the bulla was filled with 40 mM TMPA solution. In each case, TMPA concentration started increasing within 5 minutes of the application, which is far faster than expected if entry occurred only through the round window membrane. The fine curves show simulations of the experiments based on a communication between perilymph and the middle ear (representing entry through the bone) with half-times of 1100 mins (Panel A) and 360 minutes (Panel B) respectively.
2) Gentamicin Experiments
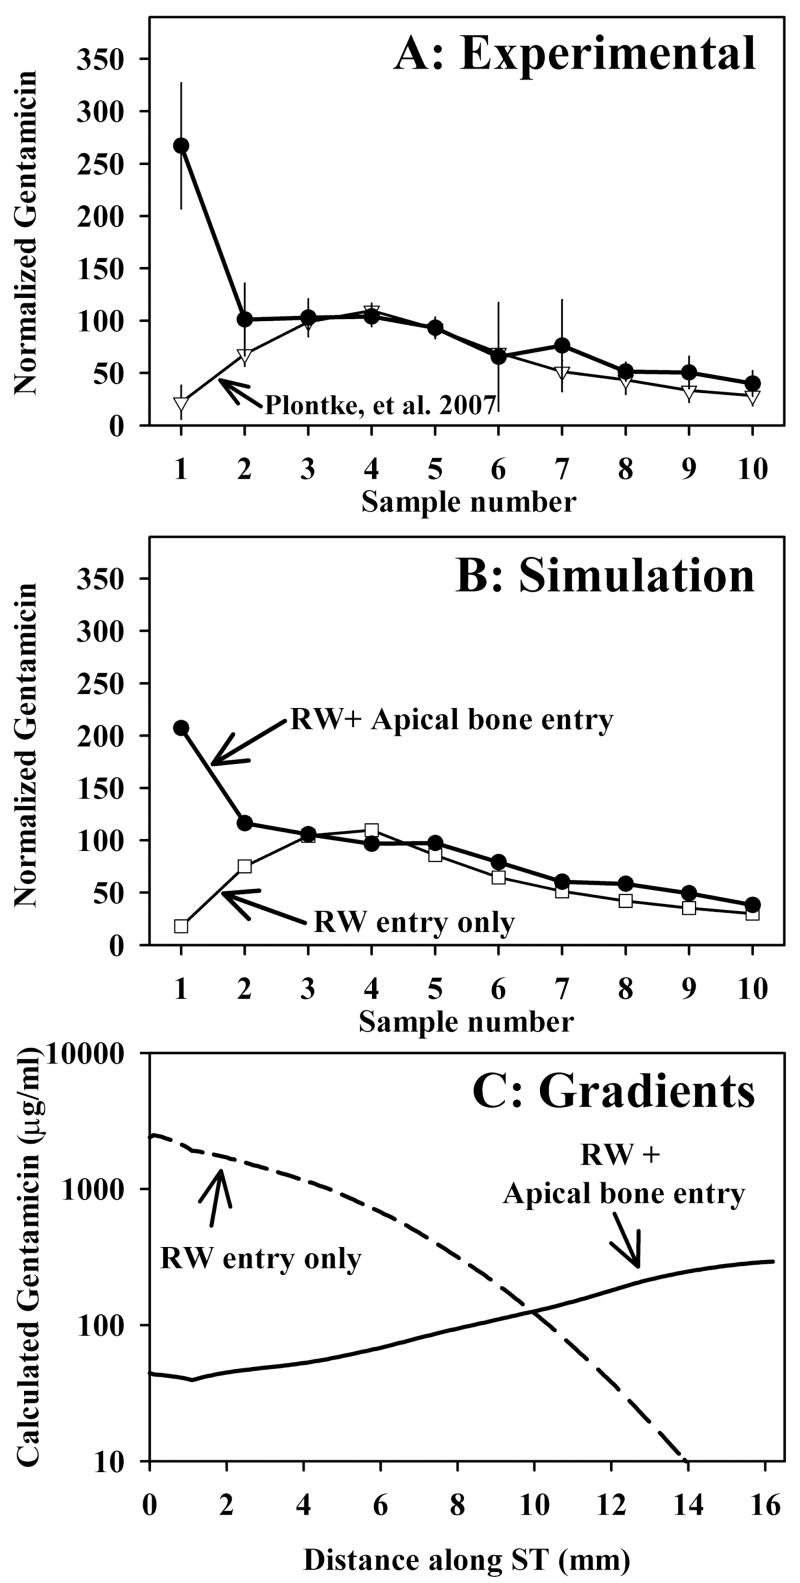
The results of experiments in which gentamicin was applied to the ear by completely filling the auditory bulla with solution containing 40 mg/ml of the drug, followed by perilymph sampling from the apex after a two hour period, are shown in Figure 6A. The results are remarkably similar to those obtained with TMPA (Figure 2A), indicating that when gentamicin is applied to the entire bulla, the concentration of drug in apical perilymph is higher than when drug is applied by irrigation to the RWM. This confirms that physiologically-relevant drugs can enter cochlear perilymph through the apical portion of the otic capsule when the bulla is filled with solution containing drug. Simulations of the experiment are shown as normalized samples in Figure 6B and as absolute concentration gradients in Figure 6C. The difference in calculated gradients for gentamicin and TMPA (comparing with Figure 2C) is primarily accounted for by substantially different rates of clearance of the these substances from perilymph. The simulations of TMPA experiments used a perilymph clearance half time of 74 min3 while simulations of gentamicin used no clearance.4 The rate of gentamicin entry into perilymph through the bone that best fit the gentamicin data was an entry half time of 2000 minutes. The absolute and normalized levels of gentamicin found with RW niche irrigation and single bulla-filling protocols are given in Table 2. In similarity with the TMPA experiments, substantially lower basal turn concentrations of gentamicin were found when the bulla was filled with solution. Basal turn concentration averaged 2.5% when gentamicin was irrigated across the RWM for an average of 2.7 hours4 while it averaged only 0.17% when the bulla was filled with the same solution for two hours.
Figure 6.
Perilymph sampling results compared when gentamicin was applied by completely filling the bulla with solution (Panel A: solid symbols, n=4, bars indicate SD) and when gentamicin was applied by irrigating solution across the RWM (Panel A; open symbols, n=9, from Plontke et al. 2007 4). When gentamicin was applied by filling the bulla with solution, the initial samples taken from the apex were high, indicating relatively higher concentrations in the apical perilymph. Sample concentrations from each experiment were normalized, setting the average of samples 3, 4 and 5 to 100.
Panel B: Computer simulations of the sampling experiments from Panel A. Open symbols show simulations in which gentamicin enters only through the RWM, with parameters adjusted to fit the data from experiments in which gentamicin was applied by irrigation across the RWM. The curve with closed symbols in Panel B was calculated with identical parameters but includes an additional communication between the middle ear and perilymph (representing entry through the bone) for apical perilymph locations. Panel C: Gentamicin concentration gradients along scala tympani prior to sampling derived from the computer simulation of experiments. The two curves show the calculated distribution of gentamicin along the cochlea that accounts for the sample concentrations observed under each protocol.
Table 2.
Basal turn sample gentamicin concentrations under different application protocols
| 40 mg/ml Gent applied | % applied Gentamicin | |
|---|---|---|
| Round window niche irrigation. Plontke et al., 2007 | 988.7 μg/ml
SD 1206, n=9 |
2.5 %
SD 3.01, n=9 |
| Bulla filled. | 69.6 μg/ml
SD 30.8, n=4 |
0.17 %
SD 0.08, n=4 |
Basal turn concentrations were calculated as the average of samples 3, 4 and 5 taken from the apex.
Discussion
Sequentially-obtained samples of perilymph from the guinea pig cochlear apex allow basal to apical gradients of drugs along ST to be quantified3. The present study shows that when TMPA or gentamicin was applied by filling the bulla, compared with irrigating it across the RWM, gradients along scala tympani were completely different. The high concentrations seen in apical samples when the substance was applied by filling the bulla are consistent with the substance entering perilymph through the bony otic capsule. This was confirmed by applying solution to the apical portion of the cochlea followed by sampling (Figure 4B) or by direct recordings of perilymph concentration during the application (Figure 5).
In guinea pigs, the bone of the cochlear apex is substantially thinner than that in the basal turn13. If permeability is related to bone thickness, then the higher drug concentrations predicted in apical perilymph could be related to the thinner bone and the greater surface area to perilymph volume ratio at the apex. Although the permeability of the bone to drugs and other substances had been assumed to be low, a lacuno-canalicular system has been described in the otic capsules of both the human and mouse.14 With the aid of 3D reconstructions of this system, it was shown that the canalicular system in the bone communicates directly with perilymph. Such an open, fluid-filled system would facilitate the entry of drugs bathing the otic capsule into perilymph. The absence of a limiting membrane between the perilymph and the bone of the cochlea has also been reported in gerbils and rats.15,16 In order to account for measured apical levels, only a low rate of communication between perilymph and fluid in the middle ear was necessary. The half time of communication for TMPA varied from 360 to 1000 min (350 min from simulations of the averaged sample data) and for gentamicin was estimated to be 2000 min based on simulations of the averaged gentamicin sample data. Since both gentamicin and TMPA are cations in solution, the slower entry rate (larger half-time) for gentamicin entry is probably accounted for by the greater molecular size for gentamicin (466) compared to TMPA (136.2). Entry rate thus depends on molecular size and likely other factors such as charge and lipophilicity.
Drug delivery to the rodent cochlea by filling the bulla is procedurally analogous to intratympanic drug delivery in humans, perhaps the most common currently utilized method of clinical drug delivery to the inner ear. However, because the bone surrounding the cochlea of humans is far thicker, it is likely that the distribution of drugs along the length of the cochlea will be quite different in rodents compared to humans, assuming that the permeability of bone to drugs decreases as the bone becomes thicker. Following intratympanic applications in humans we would expect high drug levels in the basal turn and very low levels in apical regions, in marked contrast to what we have shown in guinea pigs. However, as the permeability of the human otic capsule to drugs has not yet been quantified, some entry through the bone in humans cannot be totally excluded. It is also possible that drug permeability through the bone may be altered in some pathologies of the otic capsule, such as where bone density is decreased as in otosclerosis17 or where microfissures of the otic capsule exist.18 Nevertheless, it is reasonable to assume that the high drug levels seen in apical cochlear regions of guinea pigs following intratympanic applications are not likely to occur to the same degree in the human cochlea. In the human, drug entry will be dominated by entry through the RWM, in which case highest drug levels will be generated in the basal turn with lower levels at the apex. The assumption that drugs applied intratympanically may have access to all turns of the cochlea may be valid for some rodents6–10 but is not likely to be true for the human. This needs to be considered when extrapolation results from preclinical animal studies to the human situation for planning clinical studies with intratympanic drug delivery to the inner ear.
Our studies also show that another factor influencing the amount of substance entering perilymph is the middle ear concentration of applied substance. Middle ear concentration is highly influenced by how quickly the substance is cleared to other compartments, such as to the blood. TMPA was cleared quite rapidly from the middle ear after a “one shot” application to the bulla (Figure 3B). Middle ear clearance was significantly slower when the solution contained 10 mg/ml benzyl alcohol. Benzyl alcohol at this concentration is used as a preservative in several clinically utilized steroids12. Benzyl alcohol has also been shown to increase round window permeability by a factor of two to three12. Thus, comparison of clinical efficacy of various drug protocols needs to take into account the presence or absence of benzyl alcohol, which could lead to increased intracochlear levels by facilitating the dual actions of decreasing middle ear clearance and increasing round window permeability. Other factors could also have contributed to the higher perilymph concentrations achieved with irrigation compared to bulla-filling protocols, such as the fluid stirring in the RW niche caused by the irrigation protocol. Comparisons of various clinical application protocols can perhaps be most accurately compared by calculating the area under the curve and maximal achieved concentration, as was recently done for disparate clinical gentamicin protocols.19 In the human, the clearance of drug volume from the middle ear when the patient swallows must also be considered. In order to overcome the influences of middle ear clearance of volume and drug, a sustained irrigation protocol of some type would be preferred.
Acknowledgments
This work was supported by grants from the American Otological Society (AAM), by research grant RO1 DC01368 from NIDCD, National Institutes of Health (ANS) and by grant 0313844 from the Federal Ministry of Research and Education of Germany (SKP). The technical assistance and graphics expertise of Ruth Gill is appreciated.
References
- 1.Salt AN, Ma Y. Quantification of solute entry into cochlear perilymph through the round window membrane. Hear Res. 2001;154:88–97. doi: 10.1016/s0378-5955(01)00223-4. [DOI] [PubMed] [Google Scholar]
- 2.Salt AN, Kellner C, Hale S. Contamination of perilymph sampled from the basal cochlear turn with cerebrospinal fluid. Hear Res. 2003;182:24–33. doi: 10.1016/s0378-5955(03)00137-0. [DOI] [PubMed] [Google Scholar]
- 3.Mynatt R, Hale SA, Gill RM, Plontke SKR, Salt AN. Demonstration of a longitudinal concentration gradient along scala tympani by sequential sampling of perilymph from the cochlear apex. J Assoc Res Otolaryngol. 2006;7:182–193. doi: 10.1007/s10162-006-0034-y. [DOI] [PMC free article] [PubMed] [Google Scholar]
- 4.Plontke SK, Mynatt R, Gill RM, Salt AN. Concentration gradient along scala tympani following the local application of gentamicin to the round window membrane. Laryngoscope. 2007;117:1191–1198. doi: 10.1097/MLG.0b013e318058a06b. [DOI] [PMC free article] [PubMed] [Google Scholar]
- 5.Plontke SK, Biegner T, Kammerer B, Delabar U, Salt AN. Dexamethasone concentration gradients along scala tympani after application to the round window membrane. Otology & Neurotology. 2008;29:401–406. doi: 10.1097/MAO.0b013e318161aaae. [DOI] [PMC free article] [PubMed] [Google Scholar]
- 6.Noushi F, Richardson RT, Hardman J, Clark G, O’Leary S. Delivery of neurotrophin-3 to the cochlea using alginate beads. Otol Neurotol. 2005;26:528–533. doi: 10.1097/01.mao.0000169780.84588.a5. [DOI] [PubMed] [Google Scholar]
- 7.Wagner N, Cayé-Thomasen P, Laurell G, Bagger-Sjöbäck D, Thomsen J. Cochlear hair cell loss in single-dose versus continuous round window administration of gentamicin. Acta Otolaryngol. 2005;125:340–345. doi: 10.1080/00016480510026881. [DOI] [PubMed] [Google Scholar]
- 8.Hargunani CA, Kempton JB, DeGagne JM, Trune DR. Intratympanic injection of dexamethasone: time course of inner ear distribution and conversion to its active form. Otol Neurotol. 2006;27:564–569. doi: 10.1097/01.mao.0000194814.07674.4f. [DOI] [PubMed] [Google Scholar]
- 9.Roehm P, Hoffer M, Balaban CD. Gentamicin uptake in the chinchilla inner ear. Hear Res. 2007;230:43–52. doi: 10.1016/j.heares.2007.04.005. [DOI] [PubMed] [Google Scholar]
- 10.Barkdull GC, Hondarrague Y, Meyer T, Harris JP, Keithley EM. AM-111 reduces hearing loss in a guinea pig model of acute labyrinthitis. Laryngoscope. 2007;117:2174–2182. doi: 10.1097/MLG.0b013e3181461f92. [DOI] [PubMed] [Google Scholar]
- 11.Lustig LR. The history of intratympanic drug therapy in otology. Otolaryngol Clin North Am. 2004;37:1001–1017. doi: 10.1016/j.otc.2004.04.001. [DOI] [PubMed] [Google Scholar]
- 12.Mikulec AA, Hartsock JJ, Salt AN. Permeability of the Round Window Membrane is Influenced by the Composition of Applied Drug Solutions and by Common Surgical Procedures. Otology & Neurotology. doi: 10.1097/MAO.0b013e31818658ea. in press. [DOI] [PMC free article] [PubMed] [Google Scholar]
- 13.Kimura RS, Schuknecht HF. Membranous hydrops in the inner ear of the guinea pig after obliteration of the endolymphatic sac. Pract Oto Rhino Laryngol. 1965;27:343–354. [Google Scholar]
- 14.Zehnder AF, Kristiansen AG, Adams JC, Kujawa SG, Merchant SN, McKenna MJ. Osteoprotegrin knockout mice demonstrate abnormal remodeling of the otic capsule and progressive hearing loss. Laryngoscope. 2006;116:201–206. doi: 10.1097/01.mlg.0000191466.09210.9a. [DOI] [PMC free article] [PubMed] [Google Scholar]
- 15.Chole RA, Tinling SP. Bone lining cells of the mammalian cochlea. Hear Res. 1994;75:233–243. doi: 10.1016/0378-5955(94)90074-4. [DOI] [PubMed] [Google Scholar]
- 16.Tinling SP, Chole RA. Apical cochlear nerve exposed to perilymph in the gerbil and rat. Hear Res. 1994;73:203–208. doi: 10.1016/0378-5955(94)90236-4. [DOI] [PubMed] [Google Scholar]
- 17.Grayeli AB, Yrieix CS, Imauchi Y, Cyna-Gorse F, Ferrary E, Sterkers O. Temporal bone density measurements using CT in otosclerosis. Acta Otolaryngol. 2004;124:1136–1140. doi: 10.1080/00016480410018188. [DOI] [PubMed] [Google Scholar]
- 18.Frisch T, Bretlau P, Sorensen MS. Intravital microlesions in the human otic capsule. Detection, classification and pathogenetic significance revisited. ORL J Otorhinolaryngol Relat Spec. 2008;70:195–201. doi: 10.1159/000124294. [DOI] [PubMed] [Google Scholar]
- 19.Salt AN, Gill RM, Plontke SK. Dependence of Hearing Sensitivity Changes on the Dose of Intratympanically-Applied Gentamicin: A Metaanalysis Using Mathematical Simulations of Clinical Protocols. Laryngoscope. 2008 doi: 10.1097/MLG.0b013e31817d01cd. in press. [DOI] [PMC free article] [PubMed] [Google Scholar]


