

Abstract
We report serial-to-parallel interfaces for rapidly and efficiently transferring samples from a single microfluidic channel to multiple parallel channels. Three designs and operation modes were evaluated to determine the most efficient transfer process. All designs employed two routing channels to direct the sample into the parallel channels and to prevent sample from leaking into adjacent channels. For two of the three designs, a tee valve and gated valve were added to the interface prior to routing the samples to assist with sample injections into the parallel channels. Injection times as short as 20 ms and injection frequencies up to 10 Hz were achieved with relative standard deviations less than 0.5% for the injected area. With an injection time of 50 ms and injection frequency of 10 Hz, up to 50% of the sample is efficiently transferred. Among the three designs, the interface with the gated valve provided the highest performance and reproducibility.
Multidimensional separations using conventional1 and microfluidic2 platforms are of considerable interest because they offer increased peak capacity and information content. With microfluidic separations, the two most common formats for combining separation techniques are serial and planar coupling. Serial coupling is the simpler approach because it takes advantage of the precise and rapid fluid handling that microfluidics offers. Micellar electrokinetic chromatography (MEKC) and capillary electrophoresis (CE),3,4 open channel electro-chromatography and CE,5 isoelectric focusing and CE,6,7 isotachophoresis and CE,8 and capillary gel electrophoresis and MEKC9 have been successfully integrated on microfluidic devices, and to date, these serially coupled techniques have produced the highest peak capacities. However, serial coupling suffers from the second dimension (2D) separation having to be operated approximately 10 times faster than the first dimension (1D) separation in order to properly sample the 1D effluent. Often, this limitation results in the 1D separation being run below its optimum velocity, resulting in poorer overall performance. For systems where the 1D separation operates continuously, a second drawback is that only a small fraction (1-10%) of the sample is typically transferred from the 1D to the 2D separation,4,5 leading to a loss of information and sensitivity.
An alternative approach uses a planar format that mimics traditional two-dimensional electrophoretic separations.10 In the planar format, the 1D separation propagates along one axis of the separation space, and the 2D separation is run orthogonal to the 1D separation, usually in an array of parallel channels. Advantages of the planar format include independent time frames for the two separation techniques, i.e., the separations do not have to be correlated as with the serially coupled separations, and preservation of nearly all the information generated during the 1D separation. Several planar systems have been designed and tested,11-15 but so far, the performance of these systems has lagged behind serially coupled microfluidic systems.
By developing a serial-to-parallel interface, we combine the fluid handling capabilities of microfluidic devices as seen in the serially coupled separations with the array format for the 2D separation on the planar devices. The serial-to-parallel interface directs the sample from a single channel to one of several parallel channels by controlling potentials applied to two routing channels. As depicted in Figure 1, we designed and tested a serial-to-parallel interface (basic interface), an interface with a tee valve (tee interface), and an interface with a gated valve (gated interface). As discussed below, the tee valve16 and gated valve17 were added to the basic interface to enhance injection performance. With these devices, injection frequencies up to 10 Hz and injection times from 20 to 300 ms were evaluated. The results show that both the injection amount (peak area) and injection length (peak width) are linearly proportional to the injection time. These interfaces may have application not only in multidimensional separations, but also for continuous monitoring scenarios, e.g., cell secretions over time,18,19 where high throughput analysis is sought. In both cases, the serial-to-parallel interface allows rapid transfer of sample from a single sample channel to multiple parallel analysis channels.
Experimental Section
Materials
We purchased ammonium hydroxide (30%), hydrogen peroxide (30%), 4-(2-hydroxyethyl)-1-piperazineethanesulfonic acid (HEPES), methanol, sodium tetraborate, and rhodamine B from Sigma-Aldrich Co.; sodium hydroxide from Thermo Fisher Scientific, Inc.; Microposit MF 319 developer from Rohm and Haas Electronic Materials; Chromium Etchant 1020 and Buffered Oxide Etchant from Transene Co., Inc.; and B270 glass substrates and cover plates from Telic Co.
Microfluidic Device Fabrication
Figure 1 shows schematics of the three serial-to-parallel interfaces, which were fabricated as previously reported.20 The device substrates were B270 white crown glass covered with a thin chromium film (120 nm), an anti-reflective coating, and a positive tone photoresist. The channel designs were transferred onto the glass substrate with a UV exposure of 200 mJ/cm2 (Optical Associates, Inc.) through a photomask (HTA Photomask). The photoresist was developed, and the exposed patterns were etched into the chromium film. Microchannels were etched into the glass substrate using a stirred buffered oxide etchant. Depending on the etching time, the microchannels were 10-15 μm deep and 30-50 μm wide at the top, as measured with a stylus profiler (Dektak 6M, Veeco Instruments Inc.). Access holes were sandblasted at the ends of the channels (AECR Eraser, Paasche Airbrush Co.). The drilled substrates were bonded to cover plates by hydrolyzing both in a solution of NH4OH, H2O2, and H2O (2:1:2), rinsing with water, bringing them into contact with each other, and annealing at 550 °C for 10 h. Short segments of glass tubing (6 mm o.d. × 4 mm i.d. × 6 mm tall) were epoxied to the drilled side of the bonded substrates for fluid reservoirs.
Figure 1.
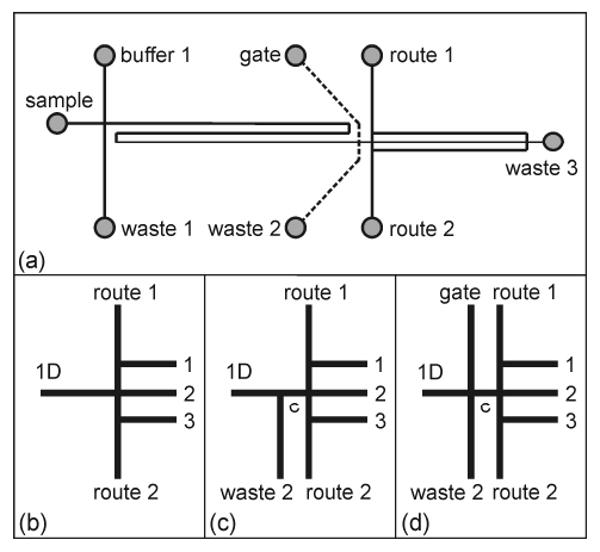
(a) Schematic of the microfluidic devices with serial-to-parallel interfaces. Enlarged view of the (b) basic interface, (c) interface with a tee valve (tee interface), and (d) interface with a gated valve (gated interface). In (a), the dashed lines show where the waste 2 and gate channels are for the tee and gated interface designs. In (b-d), the parallel channels are labeled 1, 2, and 3, and in (c-d), the connect channel is labeled c.
After thermal annealing, the channels were cleaned with a 1 M sodium hydroxide solution using vacuum applied at each reservoir for 5 min and rinsed with water to remove the sodium hydroxide. These cleaning procedures were repeated after each experiment. After cleaning, the channels were filled with buffer (1 mM sodium tetraborate and 20 mM HEPES, pH 6.2). Channel conductivities were measured by applying 10 V (6487 Keithley Instruments, Inc.) between each pair of reservoirs and measuring the current with a picoammeter (6485, Keithley Instruments, Inc.). The channel lengths were measured with linear scales (2-LMH and Microcode II, Boeckeler Instruments, Inc.) mounted on the stage of an inverted microscope (TE2000-U, Nikon, Inc.). The channel lengths, resistances, applied potentials, and electric field strengths for a typical device with a gated interface are shown in Table 1. After channel characterization, the buffer in the sample reservoir was replaced with a 10 μM solution of rhodamine B for fluorescence imaging.
Table 1.
Channel lengths (L), resistances (R), applied potentials (V), and electric field strengths1 (E) for the sample loading and injection modes.2
| Sample Loading | Injection | |||||
|---|---|---|---|---|---|---|
| Channel | L (mm) | R (M Ω) | V (kV) | E (V/cm) | V (kV) | E (V/cm) |
| sample | 6.8 | 46 | 1.0 | 148 | 1.0 | 148 |
| buffer 1 | 12.9 | 86 | 0.90 | 10 | 0.90 | 10 |
| waste 1 | 17.1 | 88 | 0.90 | 10 | 0.90 | 10 |
| 1D | 73.1 | 297 | – | 168 | – | 169 |
| gate | 12.4 | 83 | 0.70 | 540 | 0.52 | 80 |
| waste 2 | 12.2 | 83 | 0.30 | 479 | 0.48 | 22 |
| route 1 | 8.8 | 53 | 0.95 | 416 | 0.95 | 417 |
| route 2 | 9.0 | 54 | 0.95 | 416 | 0.95 | 417 |
| parallel 1 | 11.1 | 66 | – | 353 | – | 352 |
| parallel 2 | 11.0 | 66 | – | 357 | – | 356 |
| parallel 3 | 11.1 | 66 | – | 352 | – | 352 |
| waste 3 | 11.5 | 67 | 0.0 | 1062 | 0.0 | 1060 |
| connect | 0.1 | – | 230 | – | 227 | |
The electric field strengths are positive when following the arrow directions in Figure 5.
The applied potentials and calculated electric field strengths are for injections into parallel channel 2.
Interface Characterization
As shown in Figure 1, the basic interface has two route channels to direct sample into the parallel channels, the tee interface adds the waste 2 channel to inject sample into the parallel channels, and the gated interface adds the waste 2 and gate channels to inject sample into the parallel channels. Temporal profiles of the potentials applied to each reservoir are shown in Figure 2 for a 1 Hz injection frequency and 100 ms injection time. To continuously deliver sample to the interface, the potentials at the sample, buffer 1, waste 1, and waste 3 reservoirs were 1, 0.9, 0.9, and 0 kV, respectively. For the basic interface, potentials were applied only to the route 1 and 2 reservoirs, but potentials were also applied to the waste 2 reservoir for the tee interface and to the waste 2 and gate reservoirs for the gated interface. As seen in Figure 2, the potentials at the gate and waste 2 reservoirs were switched at the same time as the potentials at the route 1 and 2 reservoirs. In addition, note that the potentials shown in Figure 2 are nominal values and varied slightly depending on the actual channel resistances of each microchip.
Figure 2.
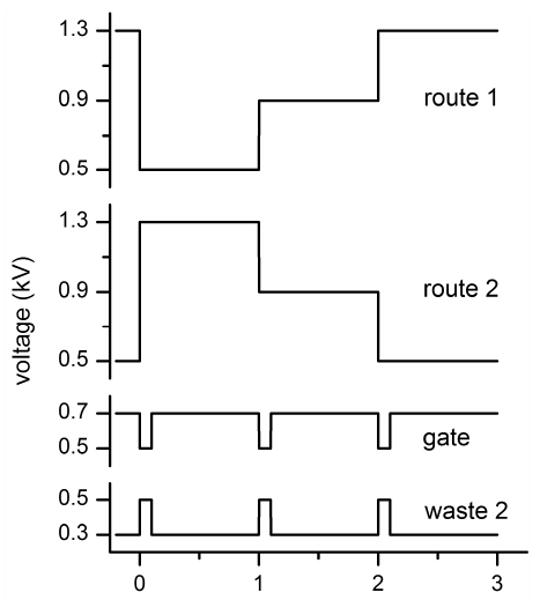
Variation of the applied potentials with time for operation of the serial-to-parallel interfaces. The injection frequency is 1 Hz, and the injection times are 1 s for the basic interface and 100 ms for the tee and gated interfaces. Route 1 and route 2 potentials are needed for the basic interface; route 1, route 2, and waste 2 potentials for the tee interface; and route 1, route 2, waste 2, and gate potentials for the gated interface.
The potentials were applied to the microfluidic device using a power supply with four independent high voltage outputs. The power supply consisted of a single 10 kV voltage source (10A12-P4-M-C, UltraVolt, Inc.) and four pairs of optical resistors (OC100, Voltage Multipliers, Inc.). The optical resistors were used as voltage dividers to regulate the potentials applied to the reservoirs. The 10 kV voltage source and optical resistors were controlled through LabView software and an analog output board (PCI-6713, National Instruments Corp.).
To monitor the injections, we used an inverted optical microscope (TE-2000U, Nikon, Inc.) equipped with 4× and 10× objectives and an HQ TRITC filter cube (Chroma Technology Corp.). A metal halide lamp (X-Cite 120, EXFO, Inc.) was used for exciting fluorescence, the fluorescence signal was recorded with a CCD camera (Cascade 512B, Photometrics), and images were captured and processed using MetaMorph software (Molecular Devices). Measurements at a single point were made 300 μm downstream from the interface in the parallel channels, using the same microscope. The fluorescence signal was spatially filtered with a 600 μm pinhole, detected with a photomultiplier tube (H5783-01, Hamamatsu Corp.), amplified by a low-noise current preamplifier (SR570, Stanford Research Systems, Inc.), and recorded using a multifunction data acquisition board (PCI-6032E, National Instruments Corp.) and software written with LabView. The sampling frequency was 1000 Hz.
Injection frequencies of 1, 2, 5, and 10 Hz and injection times of 20, 50, 100, 200, and 300 ms were evaluated. All data were analyzed using the peak fitting module in OriginPro 7.5 software (OriginLab Corp.). The peak widths were measured using the full width at half maximum of the peak profile, and the peak areas were obtained by integration.
Results and Discussion
The basic concept behind these interfaces is to connect a single channel (1D) to an array of parallel channels with two routing channels to direct the sample through the interface. To evaluate this concept, we designed the basic interface, tee interface, and gated interface (Figure 1). The gate and waste 2 channels in the tee and gated interfaces were added to facilitate injections into all three parallel channels as discussed below. The parallel channels are referred to as channels 1, 2, and 3 as shown in Figure 1b-d. In all three designs, the route channels operate similarly. When the potentials at the route 1 and 2 reservoirs are low and high, respectively, the sample is directed into channel 1. When the potentials at the route 1 and 2 reservoirs are the same, the sample is directed into channel 2, and when the potentials at the route 1 and 2 reservoirs are high and low, respectively, the sample is directed into channel 3. While operating the interface, the potential drop between the interface and waste 3 reservoir was kept constant to maintain uniform electric field strengths and flows in parallel channels 1, 2, and 3 (see Table 1). The parallel channels rejoin near the waste 3 reservoir, which was held at ground for all experiments.
Figure 3 shows the operation of the basic interface, which injected sample into channels 1 and 3 and used channel 2 as a common or waste channel. In this mode of operation, the sample continuously flows into channel 2 and is switched to channel 1 (Figure 3c) and channel 3 (Figure 3e) by adjusting the potentials at the route 1 and 2 reservoirs. After each injection, sample flow is returned to channel 2, and the injected plug travels down channel 1 (Figure 3d) or channel 3 (Figure 3f). Unfortunately, the basic interface is limited to this mode of operation where the channel sequence is 2, 1, 2, 3, 2, 1, 2,…, with the sample returning to channel 2 after each injection. If the potentials at the route 1 and 2 reservoirs are configured to send sample down parallel channels with the sequence 1, 2, 3, 1, 2, 3,…, the sample leaks into channel 2 when passing from channel 3 to 1. To overcome this limitation, we designed the tee and gated interfaces.
Figure 3.
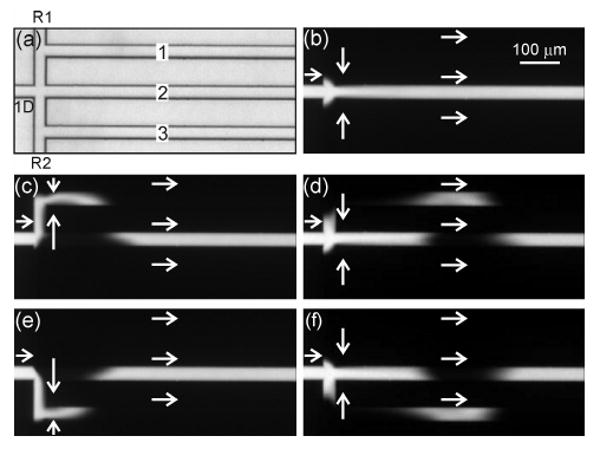
(a) Transmitted light image of the serial-to-parallel interface (basic design). Fluorescence images of (b) sample loading and injections into (c-d) channel 1 and (e-f) channel 3. In (a), the channels are labeled first dimension (1D), route 1 (R1), route 2 (R2), and parallel (1, 2, and 3). The injection time was 100 ms, and the arrows depict the flow directions.
Operation of the tee interface is shown in Figure 4. In this design, the waste 2 channel is added to provide a means to inject sample into the interface. During sample loading, the sample is fed from the 1D channel into the waste 2 channel (Figure 4b). To inject sample, the potential at the waste 2 reservoir is raised to allow sample to pass into the parallel channels, and the potentials at the route 1 and 2 reservoirs are set to direct the sample down channel 1, 2, or 3 (Figure 2). Figure 4c-d shows the sample routed into channel 1, Figure 4e-f into channel 2, and Figure 4g-h into channel 3. Taking the relative field strengths in the connect and waste 2 channels, we estimate that 75% of the sample was transferred from the 1D channel to the parallel channels and 25% continued into the waste 2 channel during the injection. The fraction of sample injected can easily be varied by raising or lowering the potential applied to the waste 2 reservoir. Although the tee interface permits all three parallel channels to receive discrete injections, operation requires careful balancing of the potentials applied to the route 1, route 2, and waste 2 reservoirs in order to inject equal amounts of sample into each of the parallel channels. To make the sample injection independent of the route 1 and 2 potentials, the gated interface was designed.
Figure 4.
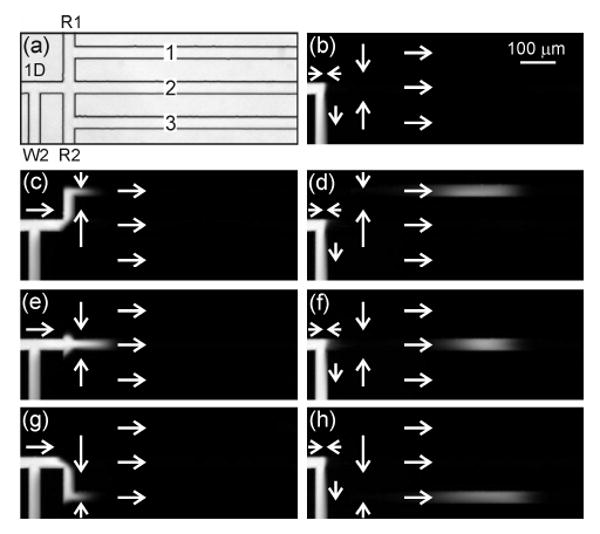
(a) Transmitted light image of the serial-to-parallel interface with a tee valve (tee interface). Fluorescence images of (b) sample loading and injections into (c-d) channel 1, (e-f) channel 2, and (g-h) channel 3. In (a), the channels are labeled first dimension (1D), route 1 (R1), route 2 (R2), waste 2 (W2), and parallel (1, 2, and 3). The injection time was 100 ms, and the arrows depict the flow directions.
Figure 5 shows the operation of the gated interface. In addition to the waste 2 channel used in the tee interface, the gated interface has the gate channel added to effect a gated injection17 prior to sample routing. During sample loading (Figure 5b), the sample flow is fed into the waste 2 channel with buffer flow from the gate channel, which prevents sample leaking into the interface. To dispense sample into the parallel channels, the potentials at the gate and waste 2 reservoirs are lowered and raised, respectively (Figure 2). The potentials at the route 1 and 2 reservoirs are set to direct sample into channel 1 (Figure 5c-d), channel 2 (Figure 5e-f), and channel 3 (Figure 5g-h). Videos of the gated interface dispensing 100 ms injections at 1 Hz and 50 ms injections at 10 Hz are available as Supporting Information. As seen in Table 1, tuning the potentials applied to the reservoirs minimizes the differences in field strengths in the 1D, connect, and parallel channels when switching between the sample loading and injection modes. This reduces the degree to which previously injected sample plugs are disturbed when subsequent injections are made into the same or adjacent channels. Interface performance was similar to the tee interface; however, uniform dispensing of the sample into channels 1, 2, and 3 was not dependent on the relative potentials applied to the route 1, route 2, and waste 2 reservoirs.
Figure 5.
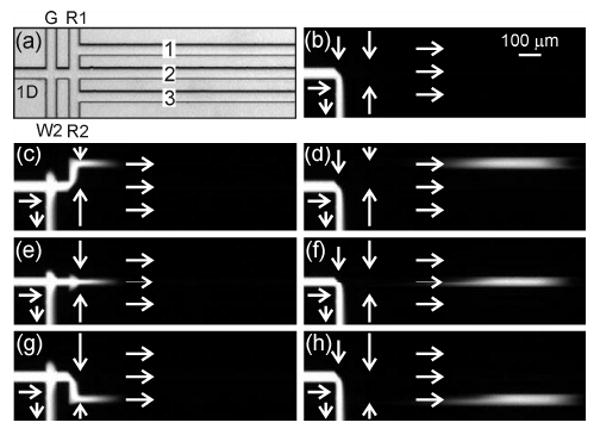
(a) Transmitted light image of the serial-to-parallel interface with a gated valve (gated interface). Fluorescence images of (b) sample loading and injections into (c-d) channel 1, (e-f) channel 2, and (g-h) channel 3. In (a), the channels are labeled first dimension (1D), route 1 (R1), route 2 (R2), waste 2 (W2), gate (G), and parallel (1, 2, and 3). The injection time was 100 ms, and the arrows depict the flow directions.
With all three interfaces, we were able to achieve injection frequencies of 1, 2, 5, and 10 Hz. Figure 6 shows fifteen injections (five into each parallel channel) with an injection frequency of 10 Hz and an injection time of 20 ms, demonstrating that the gated interface can deliver high quality injections at 10 Hz into all three parallel channels. The real-time switching capability of the gated interface can be seen in the video of the 50 ms, 10 Hz injections (see Supporting Information), and faster frequencies are possible with higher applied potentials or shorter connecting channels in the interfaces. This video also demonstrates the ability to pass 50% of the sample from a single channel to the parallel channels, compared to 3% and 9% in prior work.4,5 Assuming a sampling frequency of 1 injection per standard deviation (σ) for the peaks eluting from the 1D separation,21 operating the interface at 10 Hz would allow the 1D peaks to be as narrow as 0.4 s wide while maintaining appropriate sampling. Because the interface is controlled electrically, changes in the mobile phase composition, especially under gradient conditions, can influence the amount sampled from the 1D channel into the parallel channels. The conductivity and electroosmotic mobility in the 1D and waste 2 channels may change with mobile phase composition; however, the amount injected can be calibrated prior to the analysis or with internal standards at different points along the 1D separation.
Figure 6.
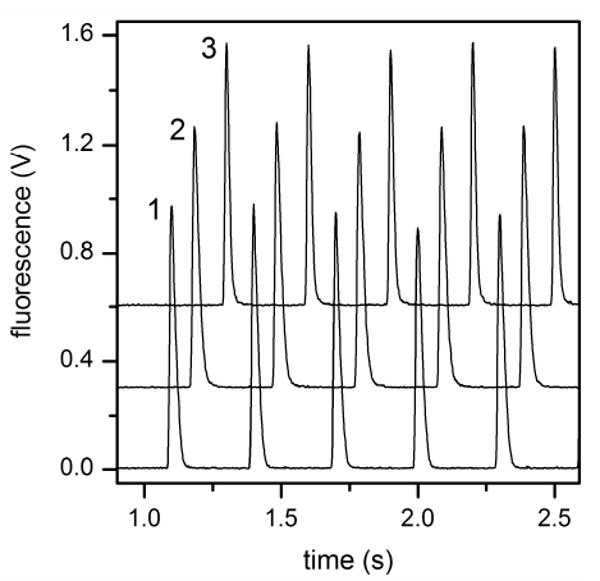
Fifteen 20 ms, 10 Hz injections into the three parallel channels of the gated interface. The profiles for channels 2 and 3 are offset for clarity.
To further evaluate interface performance, we have investigated injections into the parallel channels with injection times of 20, 50, 100, 200, and 300 ms. The peak widths and peak areas were determined, and Figure 7 shows the variation of the peak widths and areas with injection time for the gated interface. Each data point is an average of 10 consecutive injections into channel 1, 2, or 3, totaling 30 injections for each injection time. Combining the data from all three channels, R2 = 0.999 for the variation of the peak width and area with time, and the relative standard deviations (RSDs) were 2.0% and 0.5% for the peak width (injection plug length) and peak area (injection volume), respectively. The quality of the combined data for the tee interface was similar with R2 = 0.998 and RSD = 1.9% for the peak width and R2 = 0.999 and RSD = 0.4% for the peak area. We can also compare the expected peak widths (the injection times) with the measured peak widths in Figure 7 by multiplying the injection time by the ratio of the field strengths in the connect channel and parallel channels (0.64 from the field strengths listed in Table 1). Consequently, the peak widths increased an average of 18% from the expected peak width (the injection time) to what was measured in the three parallel channels.
Figure 7.
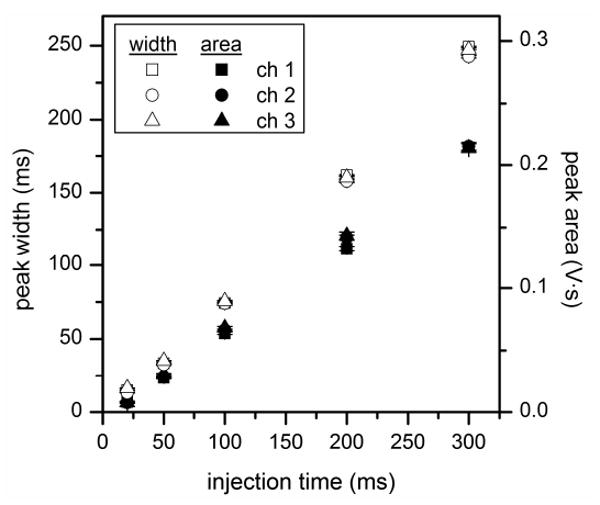
Variation of the peak width (open symbols) and peak area (solid symbols) with injection time for the gated interface. Peak widths are full widths at half maximum (FWHM), and error bars are ± σ for n = 10.
In conclusion, we have demonstrated the operation of three interfaces which use routing channels to direct the sample into the parallel channels. Overall, operation of the gated interface was most convenient because the gated valve operated independently from the routing function and all three parallel channels could receive sample injections. For example, to allow proper sampling of the 1D MEKC separation in the MEKC/CE system,4 the 1D separation field strength was only 200 V/cm, well below the optimum. Operating these same separations with the tee or gated interface would allow the 1D MEKC separation to be conducted three times faster at 600 V/cm, improving overall separation performance. With the gated interface, we have used up to four parallel channels and believe eight to ten parallel channels could be incorporated with minimal design change, permitting 1D separations to be operated eight to ten times faster or 2D separations to have eight to ten times longer analysis times. One approach to designing an interface with more parallel channels would be to minimize the distance between parallel channels, which is currently 100 μm, and to connect the parallel channels to the interface in a radial pattern, rather than perpendicularly as in Figure 1. The number of channels emanating from the interface is limited by the ability of the route channels to effectively deliver the sample into one of the parallel channels without sample leaking into an adjacent parallel channel. Overall, the gated interface adds some complexity to device operation, but the enhanced performance outweighs implementing additional control.
Supplementary Material
Acknowledgments
This work was supported in part by Indiana University and by the National Center for Glycomics and Glycoproteomics (NIH P41 RR018942). We thank Electronic Instrument Services in our Department for the design and construction of the high voltage power supply.
Footnotes
Supporting Information Available. Videos of the gated interface dispensing 100 ms injections at 1 Hz (gated_interface_100ms_1Hz.avi) and 50 ms injections at 10 Hz (gated_interface_50ms_10Hz.avi). This material is available free of charge via the Internet at http://pubs.acs.org.
References
- 1.Cohen SA, Schure MR, editors. Multidimensional Liquid Chromatography. John Wiley & Sons; 2008. [Google Scholar]
- 2.Freire SLS, Wheeler AR. Lab Chip. 2006;6:1415–1423. doi: 10.1039/b609871a. [DOI] [PubMed] [Google Scholar]
- 3.Rocklin RD, Ramsey RS, Ramsey JM. Anal Chem. 2000;72:5244–5249. doi: 10.1021/ac000578r. [DOI] [PubMed] [Google Scholar]
- 4.Ramsey JD, Jacobson SC, Culbertson CT, Ramsey JM. Anal Chem. 2003;75:3758–3764. doi: 10.1021/ac0264574. [DOI] [PubMed] [Google Scholar]
- 5.Gottschlich N, Jacobson SC, Culbertson CT, Ramsey JM. Anal Chem. 2001;73:2669–2674. doi: 10.1021/ac001019n. [DOI] [PubMed] [Google Scholar]
- 6.Herr AE, Molho JI, Drouvalakis KA, Mikkelsen JC, Utz PJ, Santiago JG, Kenny TW. Anal Chem. 2003;75:1180–1187. doi: 10.1021/ac026239a. [DOI] [PubMed] [Google Scholar]
- 7.Wang YC, Choi MN, Han JY. Anal Chem. 2004;76:4426–4431. doi: 10.1021/ac0497499. [DOI] [PubMed] [Google Scholar]
- 8.Kaniansky D, Masar M, Dankova M, Bodor R, Rakocyova R. J Chromatogr A. 2004;1051:33–42. doi: 10.1016/j.chroma.2004.08.065. [DOI] [PubMed] [Google Scholar]
- 9.Shadpour H, Soper SA. Anal Chem. 2006;78:3519–3527. doi: 10.1021/ac0600398. [DOI] [PubMed] [Google Scholar]
- 10.O'Farrell PH. J Biol Chem. 1975;250:4007–4021. [PMC free article] [PubMed] [Google Scholar]
- 11.Tsai SW, Loughran M, Karube I. J Micromech Microeng. 2004;14:1693–1699. [Google Scholar]
- 12.Buch JS, Rosenberger F, Highsmith WE, Kimball C, DeVoe DL, Lee CS. Lab Chip. 2005;5:392–400. doi: 10.1039/b416682e. [DOI] [PubMed] [Google Scholar]
- 13.Li Y, Buch JS, Rosenberger F, DeVoe DL, Lee CS. Anal Chem. 2004;76:742–748. doi: 10.1021/ac034765b. [DOI] [PubMed] [Google Scholar]
- 14.Chen XX, Wu HK, Mao CD, Whitesides GM. Anal Chem. 2002;74:1772–1778. doi: 10.1021/ac0109422. [DOI] [PubMed] [Google Scholar]
- 15.Emrich CA, Medintz IL, Chu WK, Mathies RA. Anal Chem. 2007;79:7360–7366. doi: 10.1021/ac0711485. [DOI] [PubMed] [Google Scholar]
- 16.Harrison DJ, Manz A, Fan ZH, Ludi H, Widmer HM. Anal Chem. 1992;64:1926–1932. [Google Scholar]
- 17.Jacobson SC, Hergenröder R, Moore AW, Jr, Ramsey JM. Anal Chem. 1994;66:4127–4132. [Google Scholar]
- 18.Dishinger JF, Kennedy RT. Anal Chem. 2007;79:947–954. doi: 10.1021/ac061425s. [DOI] [PubMed] [Google Scholar]
- 19.Shackman JG, Dahlgren GM, Peters JL, Kennedy RT. Lab Chip. 2005;5:56–63. doi: 10.1039/b404974h. [DOI] [PubMed] [Google Scholar]
- 20.Zhuang Z, Starkey JA, Mechref Y, Novotny MV, Jacobson SC. Anal Chem. 2007;79:7170–7175. doi: 10.1021/ac071261v. [DOI] [PubMed] [Google Scholar]
- 21.Murphy RE, Schure MR, Foley JP. Anal Chem. 1998;70:1585–1594. [Google Scholar]
Associated Data
This section collects any data citations, data availability statements, or supplementary materials included in this article.