

Abstract
Objectives
We investigated iron's role in atherosclerosis and plaque instability with a novel approach to in vivo atherosclerotic plaque characterization using noninvasive, noncontrast magnetic resonance-based T2* measurement. We validated this approach using ex vivo plaque analyses to establish that T2* reflects intraplaque iron composition.
Background
Iron catalyzes free radical production, a key step for lipid peroxidation and atherosclerosis development. The parameter T2* measures tissue magnetic susceptibility, historically has been used to quantify hepatic and myocardial iron. To date, T2* measurement has not been previously developed for in vivo plaque characterization in patients with atherosclerosis.
Methods
Thirty-nine patients referred for carotid endarterectomy were prospectively enrolled to undergo preoperative carotid MRI and postoperative analysis of the explanted plaque. Clinical history of any symptoms attributable to each carotid lesion was recorded.
Results
MRI could not be completed in 4 subjects due to claustrophobia, and three patients scanned prior to the use of a neck stabilizer had motion artifact precluding quantification. In the remaining subjects, symptomatic compared to asymptomatic patients had significantly lower plaque T2* values (20.0±1.8 vs. 34.4±2.7 ms, respectively, p<0.001). Analytical methods demonstrated similar total iron (138.6±36.5 vs. 165.8±48.3 mg/kg, p=NS) but less low-molecular weight Fe(III) (7.3±3.8 vs. 17.7±4.0 nmol/mg, p<0.05) in the explanted plaques of symptomatic versus asymptomatic patients, respectively, consistent with a shift in iron from Fe(III) to higher amounts of T2*-shortening forms of iron. Mass spectroscopy also showed significantly lower calcium (37.5±10.8 vs. 123.6±19.3 g/kg, p<0.01) and higher copper (3.2±0.5 vs. 1.7±0.1 mg/kg, p<0.01) in plaques from symptomatic patients.
Conclusions
In vivo measurement of intraplaque T2* using MRI is feasible and reproducible, and distinguishes symptom-producing from non-symptom producing plaques in patients with carotid artery atherosclerosis. Symptom-producing plaques demonstrated characteristic changes in iron forms by ex vivo analysis, supporting the dynamic presence of iron in the microenvironment of atherosclerotic plaque.
Keywords: iron, atherosclerosis, magnetic resonance imaging, electron paramagnetic resonance, mass spectroscopy, stroke
Atherosclerosis is a major cause of cardiovascular disease including acute coronary syndromes and ischemic strokes. With increasing recognition that the plaque microenvironment determines clinical sequelae rather than degree of vessel stenosis alone, better strategies to characterize plaque are needed to improve prevention and treatment.(1, 2) Since Sullivan first proposed that relative iron depletion was protective against cardiovascular disease(3), the quest to demonstrate iron's role in atherosclerosis has focused on its ability to catalyze the peroxidation of low-density lipoprotein (LDL). Microhemorrhage into atherosclerotic plaque with macrophage-mediated phagocytosis and degradation of aged red blood cells leads to accumulation of redox-active iron.(4, 5) Via Fenton chemistry, iron catalyzes the generation of oxidized-LDL (Figure 1).(6, 7) Oxidized-LDL, but not native-LDL, binds the macrophage scavenger-receptor leading to unregulated uptake, foam cell formation, and accelerated atherogenesis.(8-10)
Figure 1.
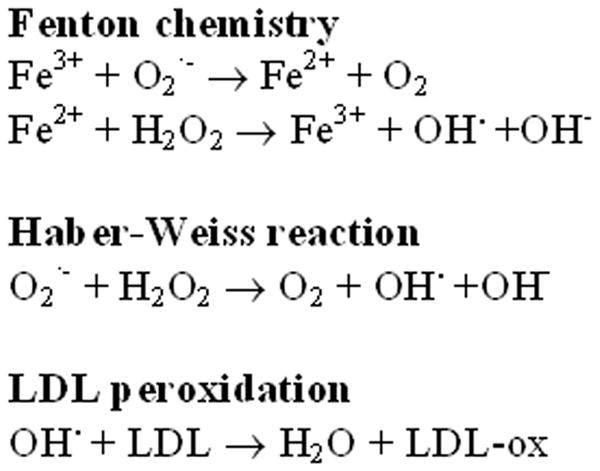
Redox Reactions and LDL Peroxidation Catalyzed by Iron. The Haber-Weiss reaction and Fenton chemistry use iron in generating free radicals that oxidize low-density lipoprotein (LDL). Microhemorrhage into atherosclerotic plaque with macrophage-mediated phagocytosis and degradation of aged red blood cells leads to accumulation of redox-active iron. Oxidized-LDL binds the macrophage scavenger-receptor leading to unregulated uptake, foam cell formation, and accelerated atherogenesis.
Despite these established pathophysiologic mechanisms, studies relating iron and atherosclerosis have provided conflicting results. Iron has consistently been found in higher concentrations in atherosclerotic plaque compared to normal arterial tissue.(11, 12) In animal models, iron overload accelerates atherogenesis.(13) Epidemiologic studies, however, have yielded equivocal results when comparing serologic markers of total body iron stores with the incidence of atherosclerotic disease.(14-17)
Notably, little work has involved direct in vivo examination of plaque iron, particularly with an appreciation of the different species of iron in biologic tissues. Free or low molecular weight iron exists as Fe(II) and Fe(III) cations. Iron may be incorporated into hemoglobin or bound to the storage proteins ferritin and hemosiderin, both of which cause measurable changes in local magnetic field homogeneity. This can be appreciated qualitatively using magnetic resonance T2*-weighted imaging(18), or quantified using the relaxation parameter T2*. T2* quantification allows accurate estimation of tissue iron content.(19) Multiple in vivo and ex vivo techniques exist to measure these various forms of iron (Table 1). Inductively-coupled plasma mass spectroscopy (ICP-MS) is used to measure total iron content. Electron paramagnetic resonance (EPR) is sensitive to several forms of iron, iron storage, and iron transport proteins; the g ≈ 4 peak is specific for Fe(III) with rhombic coordination symmetry. EPR does not detect the reduced state of iron, Fe(II). T2*-weighted MRI has been proven to be particularly sensitive to iron clusters as occurs in ferritin- or hemosiderin-bound iron(20), but to date quantitative estimation of T2* has not been utilized to understand iron's role in the microenvironment of human atherosclerotic plaque.(19, 21)
Table 1.
Iron Quantification Techniques
| Method | Type of Iron Detected |
|---|---|
| Inductively-Coupled Plasma Mass Spectroscopy (ICP-MS) | Total iron |
| Electron Paramagnetic Resonance (EPR) | Low-molecular weight Fe(III) |
| T2* Magnetic Resonance Imaging | Iron aggregates |
Recognizing that MRI is already established as a means for high-resolution in vivo imaging of carotid artery atherosclerotic plaque(22), we hypothesized that T2*-weighted MRI could uniquely evaluate the relationship between atherosclerosis and iron. Specifically, we sought in this work to (1) validate the feasibility of in vivo T2*-based MRI carotid plaque characterization and (2) to use both in vivo and ex vivo analyses to identify changes in iron content that distinguish symptomatic from asymptomatic patients with carotid atherosclerosis.
Methods
Patient Population
Thirty-nine patients referred for carotid endarterectomy were prospectively enrolled. Patients with ferromagnetic metal, active implants such as pacemakers, aneurysm clips, known claustrophobia, and those who were unable to provide informed consent were excluded from enrollment. No patients had hemochromatosis or significant transfusion history. Patients gave written informed consent to participate in this Institutional Review Board-approved human subjects investigation. Clinical assessment at baseline using both patient interview and chart review documented presence or absence of symptoms (symptomatic and asymptomatic patients, respectively) attributable to the carotid artery disease such as transient ischemic attack (TIA) or cerebrovascular accident (CVA) in the distribution of the diseased artery and absence of other source of embolism.
Preoperative In Vivo Carotid MR Protocol
Carotid magnetic resonance examinations were performed using a 1.5 Tesla scanner (Magnetom Avanto, Siemens Medical Solutions, Inc., Malvern, PA) and four-channel surface radiofrequency coils placed over the neck (Machnet BV, Eelde, The Netherlands). After localization, single shot axial steady-state free precession images were acquired using thin overlapping sections. These sections were transferred to a three-dimensional viewer for localization of a plane demonstrating maximum carotid plaque; this slice location was then used for T2* measurement. T2*, a relaxation parameter that has been shown to be directly related to iron content in other tissues(23), was measured in the predetermined slice using an ECG-triggered, segmented, multiple-echo, gradient-echo acquisition with echo times (TE) of 2.7, 7.6, 12.5, 17.4, and 22.5 ms. Chemical shift selective fat suppression and double inversion recovery blood suppression were both used to improve delineation of the vessel wall. Matrix size and field of view provided in-plane spatial resolution of 0.5 × 0.5 mm and slice thickness was 3 mm for these acquisitions. Using the images from all 5 TEs, a region of interest was drawn encompassing the plaque and a mono-exponential decay curve was fit to compute T2*.
A subset of patients also underwent T1-weighted (T1W), T2-weighted (T2W), and proton density-weighted (PDW) imaging at the same locations as T2* imaging. Typical scan parameters for these additional acquisitions were as follows. For T1W, TR 986 ms, TE 9 ms; T2W – TR 1978 ms, TE 79 ms; and PDW – TR 2030 ms, TE 9 ms. All were acquired with 3mm slice thickness and 0.5 × 0.5 mm in-plane resolution. As previously done, each of these images was rated qualitatively as hypointense, isointense, or hyperintense based on signal intensity relative to skeletal muscle in the same image. T1W, T2W, PDW, and T2* image analysis were all performed blinded to patient history.
Carotid T2* measurement reproducibility was confirmed by having the same T2* magnetic resonance images processed by two independent observers and by having a subset of patients undergo repeated T2* MRI acquisitions at adjacent slice locations.
Ex Vivo Plaque Analysis
With explantation of the plaque at carotid endarterectomy, each patient's carotid plaque was divided into two halves. One half underwent fixation and sectioning for histopathology including staining with hematoxylin and eosin (H&E) and Prussian blue. Slides were also stained for glycophorin A and factor VIII. Histopathology slides were inspected by a single cardiovascular pathologist (P.B.) who assigned plaque stage (I to VI), Prussian blue score (0 to 4+), glycophorin A score (0 to 4+), and factor VIII score (0 to 4+) by aggregate review of all slides for each patient blinded to symptom status(24). The other half was fresh-frozen for subsequent analysis using electron paramagnetic resonance (EPR) to measure paramagnetic iron species in the plaque followed by inductively-coupled plasma mass spectroscopy (ICP-MS) to measure total iron content.
EPR spectra were recorded using a finger Dewar at 77 K with a Bruker ER 300 spectrometer (Bruker BioSciences, Billerica, Massachussetts) operating at X-band with 100-KHz modulation frequency and a TM110 cavity as described previously.(25) Tissue samples (200 - 550 mg) were cut into small pieces that were loaded into the Dewar containing liquid nitrogen and placed within the EPR spectrometer cavity. EPR instrument parameters used were: gain 5 × 10⁴, modulation amplitude 5 G, time constant 82 ms, scan time 131 seconds, microwave power 63 mW, and number of scans 10. A rhombic iron signal was seen at g≈4.3, characteristic of low molecular weight iron complexes. Iron levels were quantified by comparing the amplitude of the signal with standard curves generated by using known concentrations of Fe(III)-desferrioxamine (1:1 complex, generated from the addition of known concentrations of acidic FeCl3 standard to desferrioxamine followed by titration to pH 6) under identical conditions.(26-28)
The total iron content of plaque in a portion of each sample upon completion of EPR analysis was measured using inductively-coupled plasma mass spectroscopy (ICP-MS). The samples were dried in an oven at 100 °C overnight. A portion of the sample (0.025 to 0.2 g) was placed inside a quartz vessel with 3 mL of high purity (Fisher ACS Plus) nitric acid and 7 mL of deionized water for digestion, and placed in a closed TFM vessel in an Ethos TC microwave digestion system. The temperature was increased from 0 °C to 180 °C in the initial 10 minutes and then held at 180 °C an additional 10 minutes before the vessels were cooled and opened. Samples were diluted to 30 mL with deionized water and then placed into 30 mL low-density polyethylene plastic bottles. Samples were analyzed by either a ThermoFinnigan Element 2 ICP-sector field-MS used in medium resolution (R=4000) or a PerkinElmer Sciex ELAN 6100DRCplus with methane as the reaction gas to minimize spectral overlaps so that Fe could be measured at its major isotope. Ca was measured at m/z 44 on the Element 2 and m/z 40 on the ELAN DRCplus. Cu was measured at m/z 63 and 65 on the Element 2 and m/z 65 on the ELAN DRCplus. Co (100 ppb) was added to each sample and standard and used as an internal standard to correct for instrument drift and changes in sensitivity due to high, variable Ca concentrations. The samples were introduced into the ICP-MS by an Elemental Scientific PFA-ST concentric nebulizer and an Elemental Scientific PFA spray chamber. The sample was pumped at an uptake rate of 0.5 mL/min to the nebulizer.
Statistical Analysis
Continuous data are expressed as mean±SE. The relationships between continuous variables were examined by nonparametric Spearman correlation. A nonparametric exact Wilcoxon Rank Sum test was used to compare symptomatic to asymptomatic patients with respect to each continuous variable. A value of P<0.05 was regarded as statistically significant. Comparison of frequencies of patient characteristics was done using Fisher's exact test.
Results
Of the 39 study subjects, 19 were men (Table 2); all women in this study group were postmenopausal. Eleven subjects had symptoms attributable to their carotid artery disease—six strokes and five transient ischemic attacks occurred in the distribution of the carotid lesions. 28 asymptomatic subjects had high-grade carotid artery stenosis identified by ultrasonography prompted in most cases by auscultatory findings on physical examination. Confirmation of stenosis severity to proceed with endarterectomy was provided in all subjects by either invasive angiography (23 subjects) or contrast-enhanced MR angiography. Symptomatic and asymptomatic patient groups did not significantly differ in age (64.9 ± 2.6 vs. 66.5 ± 1.2 years, p=0.70), frequency of diabetes (6/11 vs. 10/28, p=0.47), or male gender (4/11 vs. 15/28, p=0.48).
Table 2.
Patient Characteristics
| Age, years | 66.0 ± 7.0 |
| Gender, M (%) | 19 (49) |
| Diabetes, n (%) | 16 (42) |
| Current or former smoker, n (%) | 26 (72) |
| Symptomatic due to carotid lesion, n (%) | 11 (28) |
| Serum hemoglobin, mg/dL | 12.6 ± 2.3 |
Four subjects, all asymptomatic, could not undergo MRI due to severe claustrophobia. Early in the study, 3 subjects who had difficulty lying still (one symptomatic) had uninterpretable MRI data due to severe motion artifact. Subsequent use of a deflatable neck cushion which fixed the neck and coils in place during imaging eliminated motion artifact. Average time for carotid T2* data acquisition was one minute per slice. Sample magnetic resonance acquisitions are shown in Figure 2. Plaque T2* measurements were significantly shorter, indicating higher levels of T2*-shortening iron, in plaques from symptomatic versus asymptomatic patients (Figure 3a; mean 20.0 vs. 34.4 ms, respectively, p<0.001). Repeated measurements showed good inter-observer agreement (r = 0.88) of plaque T2* quantification (Figure 3b). T2* measurements compared in 14 pairs of adjacent 3 mm image slices showed good reproducibility: the difference between T2* values in adjacent slices averaged 6.5 ± 4.4 ms. Additional T1W, T2W, and PDW imaging was performed in 11 subjects; their multispectral analyses are summarized in Table 3.
Figure 2.
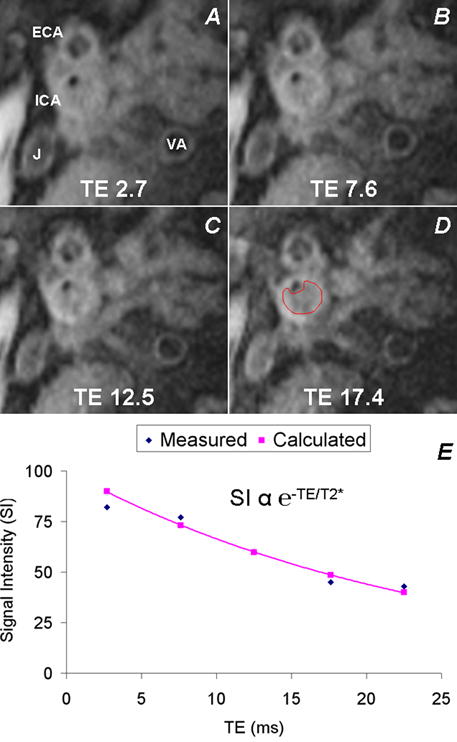
T2*-Weighted Imaging and Intraplaque T2* Measurement. Serial T2*-weighted dark blood images at various echo times (A—TE 2.7 ms, B—TE 7.6 ms, C—TE 12.5 ms, D—TE 17.4 ms) obtained at the location of maximum stenosis allow drawing of a region of interest (D) on all the images encompassing the plaque for measurement of mean T2* within the plaque. VA=vertebral artery, ECA=external carotid artery, J=internal jugular vein. See text for T2* imaging scan parameters. E. T2* is measured in a given plaque by fitting the measured signal intensities at each TE to an exponential decay curve e−TE/T2*.
Figure 3.
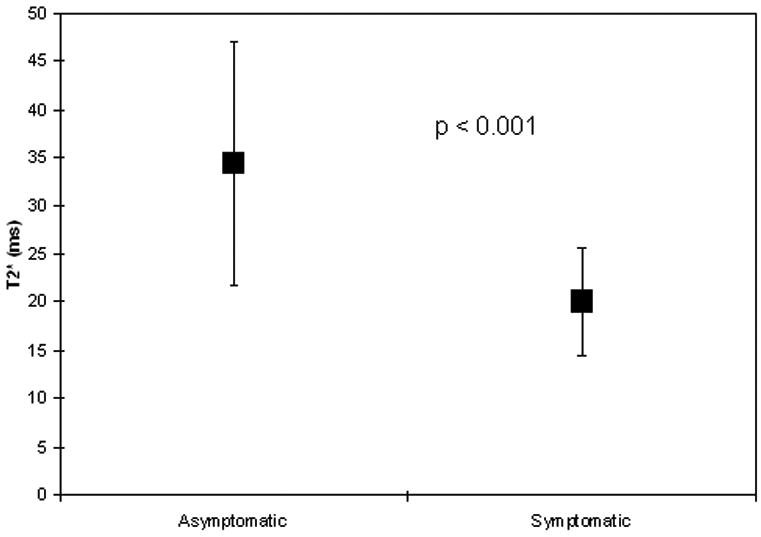
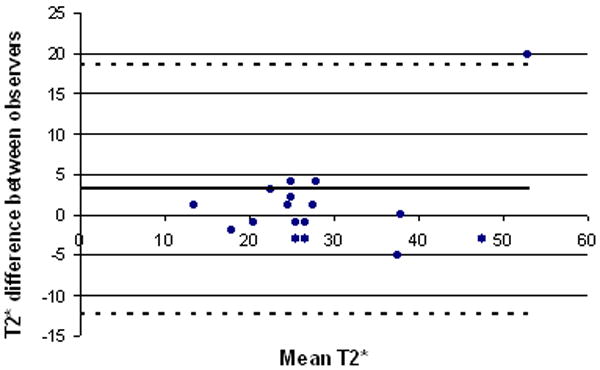
Intraplaque T2* By Symptom Status. (a) Plot of in vivo magnetic resonance-derived T2* values of carotid artery plaque in asymptomatic versus symptomatic patients shows shorter T2* times in symptomatic patients. Mean ± SD is shown. (b) Bland-Altman analysis shows good agreement of carotid T2* measurement between independent observers (r=0.88).
Table 3.
Multispectral Assessment and T2* Quantification of Carotid Plaque
| Subject ID | Symptom Status* | MRI T1W† | MRI T2W† | MRI PDW† | MRI T2*, ms | Intraplaque hemorrhage‡ |
|---|---|---|---|---|---|---|
| 16 | S | 0 | 0 | - | 14 | Y |
| 25 | A | + | + | + | 35 | Y |
| 32 | A | 0 | + | + | 27 | N |
| 33 | A | - | + | - | 24 | Y |
| 42 | A | + | + | + | 28 | N |
| 43 | A | 0 | + | 0 | 25 | N |
| 46 | A | 0 | - | 0 | 38 | N |
| 48 | A | 0 | 0 | + | 34 | N |
| 50 | A | U | + | U | 32 | N |
| 51 | S | - | - | - | 19 | Y |
symptom status (A – asymptomatic, S – symptomatic) determined by clinical history and chart review
hypointense (-), isointense (0), hyperintense (+), or uninterpretable (U) for plaque signal intensity on T1-weighted (T1W), T2-weighted (T2W), and proton-density weighted (PDW) MRI
intraplaque hemorrhage defined by histopathology; Y = present, N = absent
EPR-detectable Fe(III) was present in all but 4 patient's plaques (3 symptomatic, 1 asymptomatic; p=NS) as a strong rhombic Fe(III) signal with with a g value of 4.3, centered at ∼1500 Gauss (Figure 5). This signal has been previously assigned to low molecular weight Fe(III)-complexes.(11) Quantitative results from in vivo T2* measurements, EPR iron content, and total iron, calcium, and copper content by ICP-MS are summarized in Table 4. Both symptomatic patients and asymptomatic patients had similar levels of total iron by ICP-MS (mean 90.5 vs. 72.8 μg/g, respectively). Whereas total iron content by ICP-MS was similar, levels of paramagnetic Fe(III) complexes by EPR were significantly lower in plaques from symptomatic vs. asymptomatic patients (mean 7.3 vs. 17.7 μg Fe(III)/g tissue wet weight, p=0.025). There was significantly less calcium and more copper by ICP-MS in symptom producing vs. non-symptom producing plaques.
Figure 5.
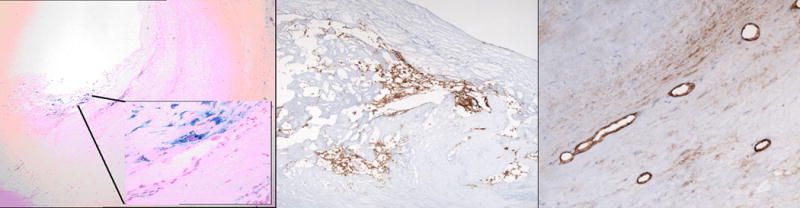
Plaque Histopathology. Left panel: Histopathological section with Prussian Blue staining at low and high (inset) magnifications demonstrate iron deposits in plaque. Middle panel: Staining for glycophorin A shows evidence of red blood cell membrane fragments within plaque. Right panel: Staining for Factor VIII demonstrates neovascularization in the plaque neointima.
Table 4.
Results of In Vivo Plaque T2* Measurement and Ex Vivo Iron Quantification
| Variable | Symptomatic Patients | Asymptomatic Patients | P-value |
|---|---|---|---|
| T2*, ms | 20.0 ± 1.8 | 34.4 ± 2.7 | 0.0006 |
| EPR Fe(III), μg/g | 7.3 ± 3.8 | 17.7 ± 4.0 | 0.025 |
| ICP-MS total iron, μg/g | 138.6 ± 36.5 | 165.8 ± 48.3 | NS |
| ICP-MS copper, μg/g | 3.2 ± 0.5 | 1.7 ± 0.1 | 0.004 |
| ICP-MS calcium, mg/g | 37.5 ± 10.8 | 123.6 ± 16.3 | 0.003 |
Inductively-coupled plasma mass spectroscopy (ICP-MS) results are expressed in terms of dry weight of samples.
Overall, the majority of plaques demonstrated advanced features (Stary class IV-VI). Histopathology demonstrated both red blood cell degradation as well as plaque disruption with intraplaque hemorrhage, both of which may be sources of intraplaque iron (Figure 5). A positive correlation was found between glycophorin A and Prussian blue (p = 0.05) as well as glycophorin A and Factor VIII (p = 0.001).
Discussion
In patients with carotid artery atherosclerosis, in vivo MRI measurement of intraplaque magnetic inhomogeneity using T2* identified variable intraplaque iron content and speciation; this quantitative, reproducible parameter distinguished symptomatic from asymptomatic patients. With ex vivo analyses, total iron was similar in both groups but low molecular weight Fe(III) was lower in symptom-producing plaques; conversion to other forms of iron may produce this shortening of T2* relaxation time (Figure 6). Both ferritin and hemosiderin are known to significantly shorten T2* relaxation time(29); in fact, T2* may be considered a “biomarker” of iron aggregation.(30) Both iron and copper have been implicated in previous studies of metal ions in atherosclerosis development, though iron affects T2* to a much greater extent, as its magnetic moment is larger and its quantity in plaque is nearly two orders of magnitude greater than that of copper.(11, 12, 31) Since similar levels of total iron were present in both groups, our results are consistent with a shift of iron from low molecular weight paramagnetic Fe(III) complexes, and possibly from EPR-invisible diamagnetic Fe(II) complexes, to other species such as hemosiderin and ferritin which are known to markedly shorten the T2* relaxation time.
Figure 6.
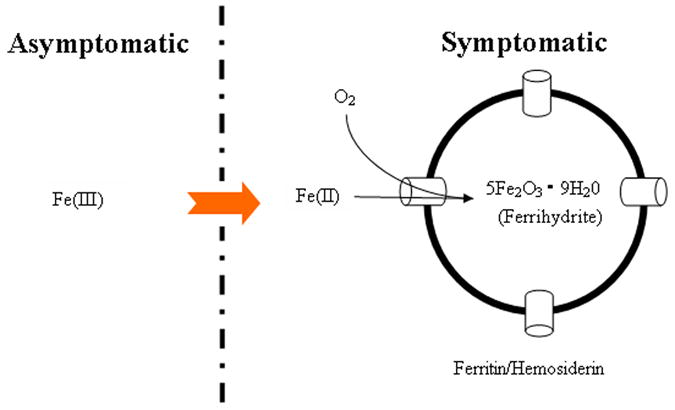
Hypothesized Mechanism Underlying Observed Results. While our work demonstrated similar total iron in symptom-producing vs. non-symptom-producing carotid plaques, the former group had less paramagnetic iron by EPR and greater T2*-shortening iron species. This suggests a shift from paramagnetic Fe(III) to iron aggregates that have greater effect on local magnetic susceptibility, measurable using the tissue-specific MRI relaxation time T2*.
The majority of prior work in humans to address the role of iron in atherosclerosis has lacked direct examination of human atherosclerotic plaques for iron, making it difficult to lend credence to the iron hypothesis or make a direct histological link to plaque composition itself. While systemic factors may contribute to a milieu that favors atherosclerosis, plaque development occurs in discrete locations mandating direct studies of plaque's microenvironment to gain insight into molecular mechanisms. We found that in symptomatic patients, a shift of the type of iron complexes present seemed to occur with shortening of T2*. This could be secondary to an increase in ferritin-bound iron consistent with previous studies documenting increased levels of ferritin in atherosclerotic plaque and a positive correlation between ferritin levels and apoptotic cell death.(32, 33) It is notable that iron in plaques on histopathology occurred both at sites of intraplaque hemorrhage, an established marker of plaque instability(5), as well as in macrophages. The correlation of clinical manifestations with explanted iron quantification supports the notion that iron does play a role in the natural history of atherosclerosis.
Previous studies have implemented conventional T1-weighted, T2-weighted, proton density, and time-of-flight imaging with good ability to classify plaques, particularly those with intraplaque hemorrhage, based on multicontrast analysis.(22) The limited number of patients undergoing multicontrast MRI with T2* quantification precludes direct comparison especially in light of variable plaque classification schemes that are based on subjective assessment of multicontrast magnetic resonance images, even among senior investigators.(34, 35) However, given (i) its greater sensitivity to and specificity for intraplaque iron, (ii) its clinical relevance in distinguishing symptom-producing plaques, and (iii) its quantitative nature that does not require qualitative assessment of relative signal intensity, plaque T2* quantification as developed in this work should be a useful addition to the assessment of patients with carotid artery disease. Current decision-making regarding carotid endarterectomy relies on patient history and percent stenosis, despite a stroke rate of 15-20% in asymptomatic patients with 50-69% stenosis that do not undergo revascularization.(36) The prognostic value of multispectral qualitative plaque MRI and intraplaque T2* measurement would be best evaluated in a prospective study, as we have ongoing at our institution. This approach may help identify asymptomatic patients with “vulnerable plaque” that would benefit from interventions to reduce the stroke rate in this population.
Continued technical improvements in MRI may further enhance the utility of this study. T2*-weighted imaging using 3 Tesla systems should theoretically benefit from the greater sensitivity to T2* effects with increased field strength. While susceptometry techniques have also been used to measure tissue iron(37), we chose MRI for this work as it uniquely provides simultaneous high-resolution plaque imaging to insure accurate localization of measurements. Furthermore, the widespread availability of 1.5T MRI scanners allows our novel T2*-based technique for noninvasive plaque characterization to be readily implemented clinically.
Because of the two-dimensional nature of the T2* acquisition, we could only select one slice for plaque T2* measurement. While the region of interest for T2* measurement was drawn such that it encompassed the entirety of the plaque at a slice showing maximum plaque, this region might not necessarily reflect the T2* of the entire plaque. Such a volumetric assessment could be achieved with development of three-dimensional T2* acquisition techniques. Nonetheless, our work did demonstrate predictive value using single-slice in vivo plaque T2* compared to ex vivo EPR and ICPMS measurements of larger plaque sections supporting further work to measure T2* over an entire plaque volume. Our results did indicate reproducibility of T2* plaque measurement in patients undergoing repeated T2* imaging at one setting as well as off-line quantification of T2* images by multiple independent observers. Also, this work was not a slice-specific comparison of MRI plaque morphology to histopathology. Rather, we implemented a novel noninvasive plaque characterization technique validated with ex vivo analysis of the plaque. Further studies registering specific imaging slice locations with explanted sections may help determine the extent and significance of intraplaque T2* heterogeneity.
Much attention has focused on detecting atherosclerosis with calcium screening. We found that carotid plaques in symptomatic patients actually had lower calcium content. This is consistent with prior work using B-mode ultrasound demonstrating lower calcium content in carotid plaques from symptomatic vs. asymptomatic patients.(38) In addition, studies utilizing histopathology and intravascular ultrasound of the coronary arteries have demonstrated that lesions associated with chronic stable angina are more extensively calcified than those associated with acute coronary syndromes.(39-41) In the current study, there was concern that calcium would interfere with the measurement of T2*, since highly calcified tissue produces a very low signal intensity on T2*-weighted gradient echo imaging potentially shortening the T2* relaxation time. Ex vivo analysis demonstrated lower calcium values in patients with shorter T2* times, indicating that the change could not be due to calcified tissue but rather, given the preponderance of evidence in this work, iron.
In conclusion, noninvasive carotid plaque T2* measurement distinguished plaques that produce symptoms from those in asymptomatic patients undergoing carotid endarterectomy. Our results indicate the presence of decreased levels of paramagnetic-Fe(III) complexes and similar total iron levels. With T2*-shortening, these results suggest a shift to aggregate iron complexes that have greater local effects on magnetic susceptibility. Further studies are warranted to identify changes in the amount, species, and chemistry of intra-plaque iron during the course of atherosclerosis development.
Figure 4.
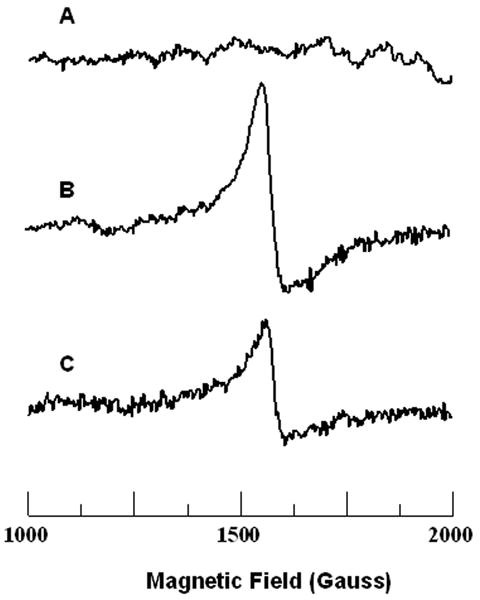
Electron Paramagnetic Resonance (EPR) Spectroscopy Detection of Iron in Carotid Plaques. EPR is a powerful and minimally invasive technique to identify and quantify the presence of paramagnetic ferric iron (Fe (III)) within an explanted carotid specimen. EPR spectra were recorded on frozen tissue at 77 K. For further experimental details and spectrometer settings, see Methods. Representative EPR spectra from control carotid artery (A), asymptomatic patient's carotid plaque (B), and symptomatic patient's carotid plaque (C) are shown. Atherosclerotic plaque samples demonstrate the high-spin rhombic iron species peak at a magnetic field of ∼ 1500 Gauss, corresponding to a g value of 4.3. While no rhombic iron signal was seen in control carotid tissue, a prominent signal was present in asymptomatic patients' carotid plaques; in symptomatic patients' plaques the level of this signal was significantly decreased.
Acknowledgments
Grant support: NHLBI HL080474-01, HL38324, and HL63744
Footnotes
Conflict of interest: none
References
- 1.Naghavi M, Libby P, Falk E, Casscells SW, Litovsky S, Rumberger J, Badimon JJ, Stefanadis C, Moreno P, Pasterkamp G, et al. From vulnerable plaque to vulnerable patient: a call for new definitions and risk assessment strategies: Part I. Circulation. 2003;108:1664–1672. doi: 10.1161/01.CIR.0000087480.94275.97. [DOI] [PubMed] [Google Scholar]
- 2.Naghavi M, Libby P, Falk E, Casscells SW, Litovsky S, Rumberger J, Badimon JJ, Stefanadis C, Moreno P, Pasterkamp G, et al. From vulnerable plaque to vulnerable patient: a call for new definitions and risk assessment strategies: Part II. Circulation. 2003;108:1772–1778. doi: 10.1161/01.CIR.0000087481.55887.C9. [DOI] [PubMed] [Google Scholar]
- 3.Sullivan JL. Iron and the sex difference in heart disease risk. Lancet. 1981;1:1293–1294. doi: 10.1016/s0140-6736(81)92463-6. [DOI] [PubMed] [Google Scholar]
- 4.Yuan XM, Li Wei, Olsson Anders G, Brunk Ulf T. Iron in human atheroma and LDL oxidation by macrophages following erythrophagocytosis. Atherosclerosis. 1996;124:61–73. doi: 10.1016/0021-9150(96)05817-0. [DOI] [PubMed] [Google Scholar]
- 5.Kolodgie FD, Gold HK, Burke AP, Fowler DR, Kruth HS, Weber DK, Farb A, Guerrero LJ, Hayase M, Kutys R, et al. Intraplaque hemorrhage and progression of coronary atheroma. N Engl J Med. 2003;349:2316–2325. doi: 10.1056/NEJMoa035655. [DOI] [PubMed] [Google Scholar]
- 6.Camejo G, Halberg C, Manschik-Lundin A, Hurt-Camejo E, Rosengren B, Olsson H, Hansson GI, Forsberg GB, Ylhen B. Hemin binding and oxidation of lipoproteins in serum: mechanisms and effect on the interaction of LDL with human macrophages. J Lipid Res. 1998;39:755–766. [PubMed] [Google Scholar]
- 7.Mladenka P, Simunek T, Hubl M, Hrdina R. The role of reactive oxygen and nitrogen species in cellular iron metabolism. Free Radic Res. 2006;40:263–272. doi: 10.1080/10715760500511484. [DOI] [PubMed] [Google Scholar]
- 8.Haberland ME, Fong D, Cheng L. Malondialdehyde-altered protein occurs in atheroma of Watanabe heritable hyperlipidemic rabbits. Science. 1988;241:215–218. doi: 10.1126/science.2455346. [DOI] [PubMed] [Google Scholar]
- 9.Steinberg D, Parthasarathy S, et al. Beyond cholesterol. Modifications of low-density lipoprotein that increase its atherogenicity. N Engl J Med. 1989;320:915–924. doi: 10.1056/NEJM198904063201407. [DOI] [PubMed] [Google Scholar]
- 10.Steinberg D. Low density lipoprotein oxidation and its pathobiological significance. J Biol Chem. 1997;272:20963–20966. doi: 10.1074/jbc.272.34.20963. [DOI] [PubMed] [Google Scholar]
- 11.Stadler N, Lindner R, Davies M. Direct detection and quantification of transition metal ions in human atherosclerotic plaques: evidence for the presence of elevated levels of iron and copper. Arterioscler Thromb Vasc Biol. 2004;24:949–954. doi: 10.1161/01.ATV.0000124892.90999.cb. [DOI] [PubMed] [Google Scholar]
- 12.Swain J, Gutteridge John MC. Prooxidant iron and copper, with ferroxidase and xanthine oxidase activities in human atherosclerotic material. FEBS Letters. 1995;368:513–515. doi: 10.1016/0014-5793(95)00726-p. [DOI] [PubMed] [Google Scholar]
- 13.Araujo J, Romano E, Brito B, Parthe V, Romano M, Bracho M, Montano R, Cardier J. Iron overload augments the development of atherosclerotic lesions in rabbits. Arteriosclerosis, Thrombosis, and Vascular Biology. 1995;15:1172–1180. doi: 10.1161/01.atv.15.8.1172. [DOI] [PubMed] [Google Scholar]
- 14.van der A D, Grobbee D, Roest M, Marx J, Voorbij H, van der Schouw Y. Serum Ferritin Is a Risk Factor for Stroke in Postmenopausal Women. Stroke. 2005:1–5. doi: 10.1161/01.STR.0000173172.82880.72. [DOI] [PubMed] [Google Scholar]
- 15.van der A DL, Marx JJM, Grobbee DE, Kamphuis MH, Georgiou NA, van Kats-Renaud JH, Breuer W, Cabantchik ZI, Roest M, Voorbij HAM, et al. Non-Transferrin-Bound Iron and Risk of Coronary Heart Disease in Postmenopausal Women. Circulation. 2006;113:1942–1949. doi: 10.1161/CIRCULATIONAHA.105.545350. [DOI] [PubMed] [Google Scholar]
- 16.Kiechl S, Willeit Johann, Egger Georg, Poewe Werner. Body iron stores and the risk of carotid atherosclerosis. Circulation. 1997;96:3300–3307. doi: 10.1161/01.cir.96.10.3300. [DOI] [PubMed] [Google Scholar]
- 17.Corti MC, Gaziano Michael, Hennekens Charles H. Iron Status and Risk of Cardiovascular Disease. Annals of Epidemiology. 1997;7:62–68. doi: 10.1016/s1047-2797(96)00112-3. [DOI] [PubMed] [Google Scholar]
- 18.Brooks RA, Vymazal J, Goldfarb RB, Bulte JW, Aisen P. Relaxometry and magnetometry of ferritin. Magn Reson Med. 1998;40:227–235. doi: 10.1002/mrm.1910400208. [DOI] [PubMed] [Google Scholar]
- 19.Wood JC, Enriquez C, Ghugre N, Tyzka JM, Carson S, Nelson MD, Coates TD. MRI R2 and R2* mapping accurately estimates hepatic iron concentration in transfusion-dependent thalassemia and sickle-cell disease patients. Blood. 2005 doi: 10.1182/blood-2004-10-3982. 2004-2010-3982. [DOI] [PMC free article] [PubMed] [Google Scholar]
- 20.Mani V, Briley-Saebo KC, Hyafil F, Fayad ZA. Feasibility of in vivo identification of endogenous ferritin with positive contrast MRI in rabbit carotid crush injury using GRASP. Magn Reson Med. 2006;56:1096–1106. doi: 10.1002/mrm.21060. [DOI] [PubMed] [Google Scholar]
- 21.Thulborn K, Sorensen A, Kowall N, McKee A, Lai A, McKinstry R, Moore J, Rosen B, Brady T. The role of ferritin and hemosiderin in the MR appearance of cerebral hemorrhage: a histopathologic biochemical study in rats. Am J Roentgenol. 1990;154:1053–1059. doi: 10.2214/ajr.154.5.2108542. [DOI] [PubMed] [Google Scholar]
- 22.Cai JM, Hatsukami TS, Ferguson MS, Small R, Polissar NL, Yuan C. Classification of Human Carotid Atherosclerotic Lesions With In Vivo Multicontrast Magnetic Resonance Imaging. Circulation. 2002;106:1368–1373. doi: 10.1161/01.cir.0000028591.44554.f9. [DOI] [PubMed] [Google Scholar]
- 23.Anderson LJ, Holden S, Davis B, Prescott E, Charrier CC, Bunce NH, Firmin DN, Wonke B, Porter J, Walker JM, et al. Cardiovascular T2-star (T2*) magnetic resonance for the early diagnosis of myocardial iron overload. European Heart Journal. 2001;22:2171–2179. doi: 10.1053/euhj.2001.2822. [DOI] [PubMed] [Google Scholar]
- 24.Stary HC, Chandler AB, Dinsmore RE, Fuster V, Glagov S, Insull W, Jr, Rosenfeld ME, Schwartz CJ, Wagner WD, Wissler RW. A definition of advanced types of atherosclerotic lesions and a histological classification of atherosclerosis : a report from the committee on vascular lesions of the council on arteriosclerosis, American Heart Association. Arterioscler Thromb Vasc Biol. 1995;15:1512–1531. doi: 10.1161/01.atv.15.9.1512. [DOI] [PubMed] [Google Scholar]
- 25.Zweier JL, Wang P, Kuppusamy P. Direct measurement of nitric oxide generation in the ischemic heart using electron paramagnetic resonance spectroscopy. J Biol Chem. 1995;270:304–307. doi: 10.1074/jbc.270.1.304. [DOI] [PubMed] [Google Scholar]
- 26.Aisen P, Leibman A, Zweier J. Stoichiometric and site characteristics of the binding of iron to human transferrin. J Biol Chem. 1978;253:1930–1937. [PubMed] [Google Scholar]
- 27.Ambrosio G, Zweier JL, Jacobus WE, Weisfeldt ML, Flaherty JT. Improvement of postischemic myocardial function and metabolism induced by administration of deferoxamine at the time of reflow: the role of iron in the pathogenesis of reperfusion injury. Circulation. 1987;76:906–915. doi: 10.1161/01.cir.76.4.906. [DOI] [PubMed] [Google Scholar]
- 28.Kuppusamy P, Zweier JL. Identification and quantitation of free radicals and paramagnetic centers from complex multi-component EPR spectra. Applied Radiation and Isotopes. 1993;44:367–372. [Google Scholar]
- 29.Haque TL, Miki Y, Kanagaki M, Takahashi T, Yamamoto A, Konishi J, Nozaki K, Hashimoto N. MR contrast of ferritin and hemosiderin in the brain: comparison among gradient-echo, conventional spin-echo and fast spin-echo sequences. Eur J Radiol. 2003;48:230–236. doi: 10.1016/s0720-048x(03)00054-8. [DOI] [PubMed] [Google Scholar]
- 30.Tanimoto A, Oshio K, Suematsu M, Pouliquen D, Stark DD. Relaxation effects of clustered particles. J Magn Reson Imaging. 2001;14:72–77. doi: 10.1002/jmri.1153. [DOI] [PubMed] [Google Scholar]
- 31.Kritharides L, Jessup Wendy, Dean Roger T. Macrophages Require Both Iron and Copper to Oxidize Low-Density Lipoprotein in Hanks' Balanced Salt Solution. Archives of Biochemistry and Biophysics. 1995;323:127–136. doi: 10.1006/abbi.1995.0018. [DOI] [PubMed] [Google Scholar]
- 32.Yuan XM. Apoptotic macrophage-derived foam cells of human atheromas are rich in iron and ferritin, suggesting iron-catalysed reactions to be involved in apoptosis. Free Radic Res. 1999;30:221–231. doi: 10.1080/10715769900300241. [DOI] [PubMed] [Google Scholar]
- 33.Li W, Hellsten A, Xu LH, Zhuang DM, Jansson K, Brunk UT, Yuan XM. Foam cell death induced by 7beta-hydroxycholesterol is mediated by labile iron-driven oxidative injury: mechanisms underlying induction of ferritin in human atheroma. Free Radic Biol Med. 2005;39:864–875. doi: 10.1016/j.freeradbiomed.2005.05.006. [DOI] [PubMed] [Google Scholar]
- 34.Yuan C, Mitsumori LM, Beach KW, Maravilla KR. Carotid atherosclerotic plaque: noninvasive MR characterization and identification of vulnerable lesions. Radiology. 2001;221:285–299. doi: 10.1148/radiol.2212001612. [DOI] [PubMed] [Google Scholar]
- 35.Fayad Z, Fuster V. Characterization of atherosclerotic plaques by magnetic resonance imaging. Annals of the New York Academy of Sciences. 2000;902:173–186. doi: 10.1111/j.1749-6632.2000.tb06312.x. [DOI] [PubMed] [Google Scholar]
- 36.Barnett HJM, Taylor DW, Eliasziw M, Fox AJ, Ferguson GG, Haynes RB, Rankin RN, Clagett GP, Hachinski VC, Sackett DL, et al. Benefit of carotid endarterectomy in patients with symptomatic moderate or severe stenosis. N Engl J Med. 1998;339:1415–1425. doi: 10.1056/NEJM199811123392002. [DOI] [PubMed] [Google Scholar]
- 37.Brittenham GM, Badman DG. Noninvasive measurement of iron: report of an NIDDK workshop. Blood. 2003;101:15–19. doi: 10.1182/blood-2002-06-1723. [DOI] [PubMed] [Google Scholar]
- 38.Lal BK, Hobson RW, 2nd, Hameed M, Pappas PJ, Padberg FT, Jr, Jamil Z, Duran WN. Noninvasive identification of the unstable carotid plaque. Ann Vasc Surg. 2006;20:167–174. doi: 10.1007/s10016-006-9000-8. [DOI] [PubMed] [Google Scholar]
- 39.Ehara S, Kobayashi Y, Yoshiyama M, Shimada K, Shimada Y, Fukuda D, Nakamura Y, Yamashita H, Yamagishi H, Takeuchi K, et al. Spotty calcification typifies the culprit plaque in patients with acute myocardial infarction: an intravascular ultrasound study. Circulation. 2004;110:3424–3429. doi: 10.1161/01.CIR.0000148131.41425.E9. [DOI] [PubMed] [Google Scholar]
- 40.Beckman JA, Ganz J, Creager MA, Ganz P, Kinlay S. Relationship of clinical presentation and calcification of culprit coronary artery stenoses. Arterioscler Thromb Vasc Biol. 2001;21:1618–1622. doi: 10.1161/hq0901.095554. [DOI] [PubMed] [Google Scholar]
- 41.Cheng GC, Loree HM, Kamm RD, Fishbein MC, Lee RT. Distribution of circumferential stress in ruptured and stable atherosclerotic lesions. A structural analysis with histopathological correlation. Circulation. 1993;87:1179–1187. doi: 10.1161/01.cir.87.4.1179. [DOI] [PubMed] [Google Scholar]