Abstract
A data-driven approach for lateralization of brain function based on the spatial coherence difference of functional MRI (fMRI) data in homologous regions-of-interest (ROI) in each hemisphere is proposed. The utility of using coherence laterality (CL) to determine function laterality was assessed first by examining motor laterality using normal subjects’ data acquired both at rest and with a simple unilateral motor task and subsequently by examining mesial temporal lobe memory laterality in normal subjects and patients with temporal lobe epilepsy. The motor task was used to demonstrate that CL within motor ROI correctly lateralized functional stimulation. In patients with unilateral epilepsy studied during a scene-encoding task, CL in a hippocampus-parahippocampus-fusiform (HPF) ROI was concordant with lateralization based on task activation, and the CL index (CLI) significantly differentiated the right side group to the left side group. By contrast, normal controls showed a symmetric HPF CLI distribution. Additionally, similar memory laterality prediction results were still observed using CL in epilepsy patients with unilateral seizures after the memory encoding effect was removed from the data, suggesting the potential for lateralization of pathological brain function based on resting fMRI data. A better lateralization was further achieved via a combination of the proposed approach and the standard activation based approach, demonstrating that assessment of spatial coherence changes provides a complementary approach to quantifying task-correlated activity for lateralizing brain function.
Keywords: fMRI, coherence, laterality, IAT
Introduction
Function lateralization is commonly used to examine hemispheric specialization both in basic brain research and in clinical practice. The current clinical standard for function lateralization is intracarotid amobarbital testing (IAT) (Milner et al., 1962; Wada and Rasmussen, 1960), wherein each hemishphere is selectively anesthetized with a short-acting barbituate, allowing function in the other hemisphere to be assessed. However, the IAT is invasive, carries significant risks (Hamer et al., 2000), and provides only a limited testing period. Due to its noninvasiveness and repeatability, fMRI has been increasingly assessed for clinical lateralization of brain function, including language (Benson et al., 1999; Binder et al., 1996; Carpentier et al., 2001; Desmond et al., 1995), and memory function (Detre et al., 1998; Narayan et al., 2005; Rabin et al., 2004a; Stern et al., 1996). While the IAT is essentially a lesion study, fMRI examines functional lateralization in the intact brain, and hence some discordance between these modalities may be expected (Killgore et al., 1999). For language lateralization, extensive data suggest that IAT and FMRI are concordant approximately 90% of the time (Binder et al., 1995). Lateralization of memory function with fMRI is more challenging since memory activity is more difficult to manipulate (Stark and Squire, 2000) and the resulting activation is much smaller and weaker than for language. Accordingly, more sensitive approaches for assessing memory lateralization in fMRI are needed.
With fMRI, task induced activations are usually assessed using the univariate general linear model (GLM) and function laterality is most commonly determined by comparing activation in homologous ROIs in each hemisphere. A variety of approaches for quantifying activation within ROI have been employed, including voxel counting (Binder et al., 1996; Chlebus et al., 2007; Rabin et al., 2004a), mean or peak t-values (Adcock et al., 2003), weighted averages (Branco et al., 2006), etc (see more details in a review (Seghier, 2008)). A laterality index is then computed based on activation within the homologous ROIs, which will be abbreviated as GLMLI in the following text since it is basically a number calculated from the statistical parametric map of the GLM analysis. Most of those approaches provide no strategy to control for performance effects on modeled brain activity or variations in hemodynamic response function (HRF) (Friston et al., 1994; Hopfinger et al., 2000) due to underlying pathology. A data driven approach may offer a more robust alternative to GLMLI and is explored in the current study.
While GLM models the temporal behavior of brain activity, it does not model the spatial characteristics of fMRI data, except to the extent that spatial smoothing is applied. A potentially valuable spatial feature is the coherence of the brain activity within the functional regions. Since functional brain regions consisting of multiple voxels are most likely activated as a whole, an alternative approach to assess brain functions is to assess the brain activity coherence, and the discrepancy in regional coherence between the two hemispheres could be used to generate an index for functional laterality. Independent of any task, the regional coherence would provide a model-free measure which could be used for assessing brain activity during either the resting state or a task-induced behavioral state. As a complement to GLM based approaches, the CL based approach could be combined with any GLM based method to determine the laterality using both the spatial and temporal information of fMRI data, which could potentially further improve the lateralization performance. As compared to other data-driven approaches such as independent components analysis (ICA) that generate a myriad of associations within the data, the proposed coherence assessment focuses specifically on spatially correlated activity within an ROI, and therefore is more readily interpreted.
We assessed the utility of the coherence laterality (CL) approach to determine function lateralization first by examining motor laterality in normal subjects’ data acquired both at rest and with a simple lateralized motor task and subsequently by examining mesial temporal lobe memory laterality in normal subjects and patients with temporal lobe epilepsy. The results were compared to a standard laterality index based on GLM (Rabin et al., 2004a).
Materials and methods
Subjects
Seventeen young healthy subjects were recruited from the University of Pennsylvania community (average age= 26.1; 9 males, 8 females) for resting and sensorimotor fMRI data acquisition and provided signed informed consent according to a protocol approved by Institutional Review Board (IRB) of the University of Pennsylvania.
MR Image Acquisition
MR imaging experiments were conducted in a 3T Trio whole-body scanner (Siemens Medical Systems, Erlangen, Germany). Visual stimuli were presented on a back-lit projection screen viewed through a mirror mounted on the head coil. High resolution structural images were acquired for spatial normalization of functional data with a 3D MPRAGE sequence, using the following imaging parameters: resolution = 1 mm isotropic, FOV = 192×256 mm2, matrix = 192×256, 160 axial slices, TR/TE/TI = 1620/3.87/950 msec, flip angle = 15°. Gradient-echo echo-planar imaging sequence was used for BOLD fMRI data acquisition with TR=3s, TE=30 ms, FOV = 220×220 mm2 for the resting/sensorimotor fMRI, matrix=64×64, 40 slices, with slice thickness=3 mm. Four dummy scans were performed at the beginning of the acquisition to allow magnetization to reach a steady state. Adjustable pads were used to restrict head motion.
Resting scan and sensorimotor task fMRI
During the resting scan, each participant was asked to lie in the scanner at rest and keep their eyes open. The BOLD fMRI sequence was used to acquire 220 MR images. In the sensorimotor fMRI session, the same group of subjects were asked to perform self-paced fingertapping of the left hand cued by a flashing black and white checker board. A blocked design was used, consisting of 5 task blocks separating by a baseline block. Each block lasted for 1 min. The visual stimulus during the task state was an 8.33 Hz reversing black and white checkerboard.
Scene Encoding fMRI Data
Previously acquired fMRI data sfrom patients with temporal lobe epilepsy and control subjects performing a scene encoding memory task were also analyzed. Patients with refractory nonlesional or lesional temporal lobe epilepsy (TLE) were recruited from the Penn Epilepsy Center at the Hospital of the University of Pennsylvania and the Comprehensive Epilepsy Center at Thomas Jefferson University. Patients with brain tumors, traumatic brain injuries, vascular lesions involving the temporal lobe, extratemporal epilepsy, prior temporal lobectomy, or contraindications to MRI were excluded. Patients with severe mental retardation who were likely to be unable to cooperate with the MRI examination were also excluded. A combination of clinical MRI findings, EEG, IAT, and neuropsychological testing was used to lateralize the side of seizure. 16 epilepsy patients (2 had bilateral temporal lobe epilepsy (TLE), 6 had TLE localized to the right temporal lobe, and 8 had TLE localized to the left temporal lobe). The mean age of participants was 38 (SD=13.3), with a range of 18–67 years of age. Pre-surgical clinical data for seizure lateralization included IAT, EEG, MRI, and neuropsychological testing. Complete IAT procedure data were available for eleven epilepsy patients: 5 were lateralized to the right side, 4 were lateralized to the left side, and 2 were determined to be with bilateral seizure. For this particular cohort, memory lateralization via IAT pointed to the same side of seizure for the patients with unilateral epilepsy. EEG data was available for eleven of the patients: 5 patients had seizure activity lateralized to the right, 4 were lateralized to the left, and 2 were lateralized bilaterally. Structural MRI data was available for nine of the patients: 3 had atrophy or mTL sclerosis lateralized to the right, 5 were lateralized to the left, and 1 was lateralized bilaterally. Neuropsychological testing showed lower scores on verbal memory tests for patients with left side seizure, but no consistent differences between the groups on tests of visual memory. These verbal memory differences did not meet significance.
In addition, 23 control subjects were recruited from the University of Pennsylvania community. Subjects with a history of TLE, psychiatric disorders, or other neurologic illness, or contraindications to MRI were excluded. Neuropsychological testing was not performed with control subjects since adequate normative data exists for comparison with the patient population.
Memory for complex scenes task was administered using a block-design experiment with seven blocks of novel complex visual scenes alternating with seven blocks of a control (scrambled) scene, as detailed in our previous publications (Narayan et al., 2005; Rabin et al., 2004b). 168 fMRI images were acquired from both the patients and controls using the same GRE BOLD sequence as used in the sensorimotor fMRI experiment with the same acquisition parameters except an inplane FOV of 192×192 mm2. High resolution structural images were also acquired for spatially brain normalization using the same sequence with the same parameters as described above. Subjects completed a forced-choice recognition task while in the scanning, but without concurrent image acquisition.
Data preprocessing
All data preprocessing was performed in batch mode with SPM5 software (Wellcome Department of Cognitive Neurology, London, UK, http://www.fil.ion.ucl.ac.uk/spm) based batch scripts (Wang et al., 2008). Functional images of each subject were motion corrected, coregistered with the structural images, and smoothed with an isotropic Gaussian filter (FWHM=6 mm) using SPM5. To improve the temporal signal-to-noise ratio, functional image series were also filtered with a low-pass Butterworth filter (Oppenheim et al., 1996) (cutoff frequency = 1/8 Hz), and a high-pass Butterworth filter (cutoff frequency = 1/128 Hz). The structural image was normalized to the Montreal Neurological Institute/International Consortium for Brain Mapping (MNI/ICBM) 152 standard brain using SPM5, the same normalization parameters were subsequently used to map the temporally filtered fMRI image series into the MNI/ICBM standard space.
Two motor cortex (MC) ROIs were functionally defined from the group random effect analysis results of the sensorimotor fMRI GLM data (see below). The remaining ROI were defined using the Wake Forest Pick atlas utility (Maldjian et al., 2003). For resting and sensorimotor fMRI data, 6 ROIs were defined in the motor cortex (MC), basal ganglia (BG, not including amygdala), hippocampus-parahippocampus-fusiform (HPF), temporal lobe (TL), frontal cortex (FC), and the whole brain. The MC ROIs were used to assess the task effect on the brain activity coherence and the associated CLI. BG and TL were used as control ROIs for examining this effect. Three ROIs were chosen for determining memory laterality using the scene-encoding fMRI data: HPF, hippocampus (HIPP), and BG. HIPP was used to check the sensitivity of the scene encoding fMRI based lateralization to the size of ROI; BG was used to check the performance of LIs within a control brain region which was not engaged in the fMRI task.
Voxel-wise statistical analysis
Voxel-wise statistical analysis was performed on the spatially normalized fMRI data using the univariate GLM approach implemented in SPM5. The design paradigm convolved with the canonical HRF function was used as the reference function in the GLM. The six rigid head motion parameters were included in the model as nuisance covariates. Statistical parametric maps (SPMs) of the task-baseline contrast were collected at each voxel using a standard t-test. Random effect analysis through the one-sample t-test (Holmes and Friston, 1998) was conducted for the sensorimotor fMRI data and the right side MC ROI was defined by thresholding the resulting SPM with P<0.01 (multiple comparison correction using the family-wise-error correction method (Worsley et al., 1996)). To assess the effects of nonactivated voxels on CLI-based functional lateralization, a second MC ROI was generated by placing the center of a sphere with radius of 15 mm in the location of the peak t-value within MC. A third MC ROI was built using the precentral and postcentral gyrus as defined in the Wake Forest Pick atlas utility (Maldjian et al., 2003).
Coherence and CLI calculation for resting, sensorimotor, and scene-encoding fMRI
Kendall’s coefficient of concordance (KCC) (Kendall and Gibbons, 1990) was used to measure the coherence of fMRI signal in the selected bilateral homologous ROIs.
FMRI time series were extracted from the spatially normalized functional image series using the ROIs (left and right, separately) as defined above. Each voxel’s time series were ranked from 1 to N (N=220 for the sensorimotor data, and 168 for the scene-encoding data in this paper) using the midrank method (Gibbons and Chakraborti, 2003). Suppose there are K voxels in the ROI, to get the rank series of the i-th voxel’s time series, the time series were first sorted in a descending order. The repetition times of each value was also counted. The initial rank series were obtained from the ordinal numbers of all items in the sorted series, with the maximum value assigned rank 1, and the minimum rank N. For any item with repetition times greater than 1, its rank was updated as the mean of the initial ranks of all the items with the same value. For example, (20, 12, 12, 11.5, 13) will be converted into a rank series of (1, 3.5, 3.5, 5, 2) using this method. The same ranking process was conducted for each voxel within ROI to form an N×K rank data matrix R, and the KCC was then calculated as
| (1) |
where is the sum of ranks rij of all voxels at the j-th time point; R̄ = ((N + 1)K)/2 is the mean of all Rj’s.
KCC (also called Kendall’s W) ranges from 0 to 1 with 0 meaning completely incoherent and 1 meaning completely coherent.
After getting KCC from the left and right side (LW and RW), the CLI was calculated with the following formula
| (2) |
Here a positive CLI indicates left lateralization and vice versa for a negative CLI.
Temporal stability of CLI
As a spatial-temporal measure, CLI could be subject to temporal signal fluctuations. To assess the effect of signal length on CLI and provide guidance for the minimum time series length required for a robust CLI calculation, the temporal convergence curve of CLI was calculated by sequentially updating the CLI from the first two fMRI timepoints with one more timepoint. The changing rate of this convergence curve was calculated as the first derivative to assess the temporal fluctuation of CLI.
GLMLI calculation for the scene-encoding fMRI
The ratio of the number of voxels with positive T-values within each side ROI was collected and the GLMLI was calculated from the ratios of voxels with positive T-values in the left/right side ROIs (Lr/Rr) (Rabin et al., 2004a):
| (3) |
A positive GLMLI indicates left side dominance and a negative GLMLI indicates right side dominance.
Removing task effects from fMRI data for assessing laterality
As a data driven method, CLI does not necessarily require any task. To check the capability of CLI for laterality determination using null hypothesis data, the scene encoding task effects were removed from the fMRI data by running the same GLM analysis as described in Data Preprocessing section and saving the residual images as the pseudo null-hypothesis data (Fair et al., 2007). GLM was performed a third time on the residual images to assess the quality of task effect removal. GLMCLI and CLI were calculated from the residual images from the left and right HPF ROIs.
A combined GLM-Coherence analysis
Since GLMLI and CLI characterize different properties of fMRI data, it is reasonable to use both of them to derive a novel LI reflecting both spatial coherence and task correlation. We calculated a new LI by multiplying the ratios of voxels with positive T-values with the KCC in the left/right side ROIs to get a combined laterality measure, the XL, for each side ROI (LXL for left side and RXL for right side); the new LI, named XLI hereafter in this paper, was then generated using
| (4) |
The performance of XLI was evaluated using the same unilaterally epileptic patients’ scene-encoding data as described above.
Results
Coherence and CLI of normal brains during the resting state and behavioral state
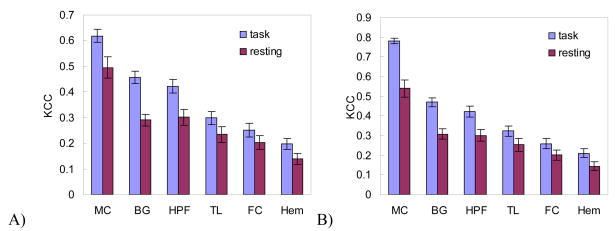
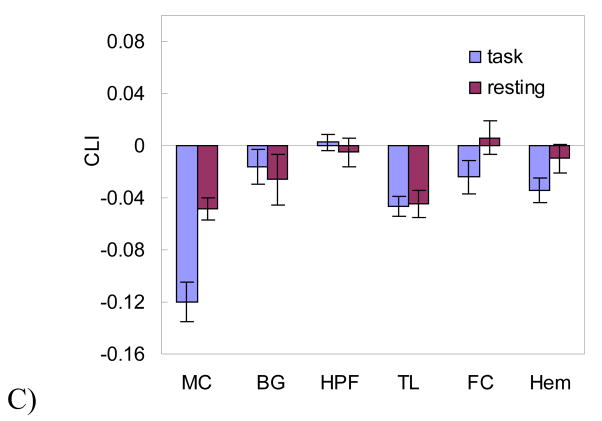
Fig. 1 shows the coherence and CLI calculated from the resting and sensorimotor fMRI data of the same group of normal subjects. As compared to the resting state, the sensorimotor task significantly (P<0.05, paired t-test) enhanced the coherence in the whole brain (P=0.000425, not shown in Fig. 1) and in both sides of 6 assessed ROIs (not including the 2nd and 3rd MC ROIs) (Fig. 1A and 1B). A significant increase of coherence laterality (P=0.03, paired t-test) was observed in the whole brain (using the left right hemispheres as ROIs), MC (using the first MC ROI) and FC, which were engaged in the task performance.
Figure 1.
Left hand fingertapping induced coherence change in A) the left side, B) the right side of the assessed 6 ROIs. C) shows CLIs calculated from the resting and task-involved fMRI data within the 6 ROIs. MC, BG, HPF, TL, FC, and Hem mean motor cortex, basal gangalia, hippocampus-parahippocampus-fusiform, temporal lobe, frontal cortex, and hemisphere, respectively. Significant CLI changes were found in MC, FC, and Hem due to the task engagement.
CLI calculated with the 2nd MC ROI determined the correct side of function laterality, but CLI calculated with the 3rd MC ROI failed to demonstrate function lateralization for 3 out of the 17 normal subjects.
Temporal stability of CLI in the normal brain
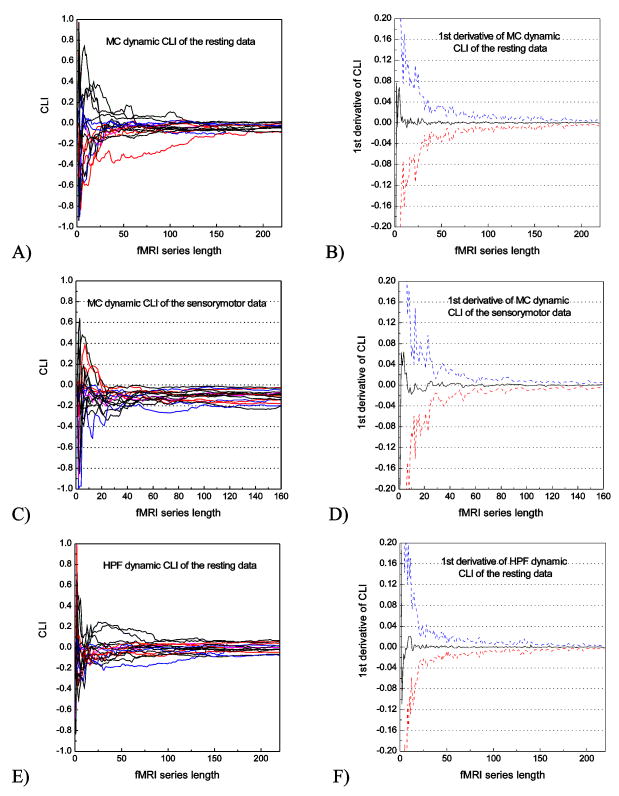
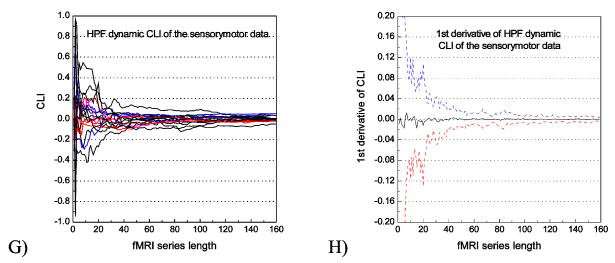
Fig. 2 shows the temporal convergence curve of CLI and its first derivative calculated from the resting data (Fig. 2A, B, E, F) and the sensorimotor data (Fig. 2C, D, G, H) using the two representative ROIs: MC (Fig. 2A, B, C, D) and HPF (Fig. 2E, F, G, H). CLI of resting data (Fig. 2A, E) and sensorimotor data (Fig. 2C, G) showed that CLI converged when the number of images was greater than 100, and the functional task did not disturb the CLI temporal profile. The first derivatives (Fig. 2B, F for resting data, Fig. 2D, H) further showed that the mean changing rate of CLI converged to 0 quickly after 100 timepoints and the fluctuation range (3 standard deviations) was within ± 0.01.
Figure 2.
CLI temporal convergence curve and its 1st derivative calculated from the resting fMRI data and the sensorimotor fMRI data using MC and HPF ROIs. Each plot in A, C, E, G represents data from a particular subject. In B, D, F, H, the black line represents the mean 1st derivative; and the blue, red dashed lines indicate the + standard deviations of the 1st derivative.
CLI within the epileptic brain and its concordance with the seizure side and IAT memory laterality
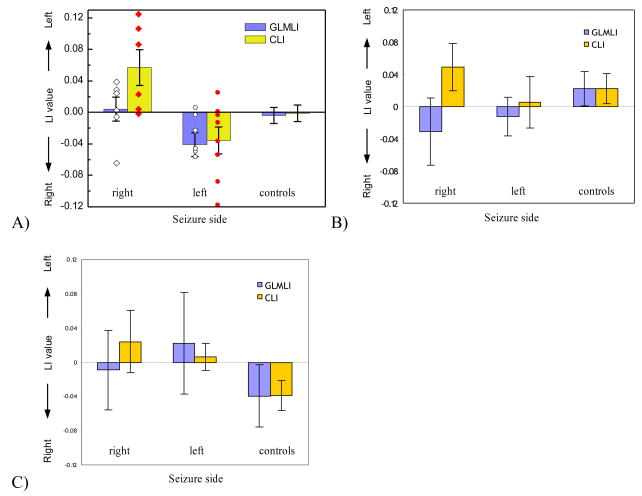
Fig. 3 shows the mean and standard error of CLI and GLMLI calculated using the left/right HPF (Fig. 3A), HIPP (Fig. 3B), and BG (Fig. 3C) for all three patient groups and the normal controls (n=23). CLI of the right sided seizure group (n=6) calculated from the HPF ROI (Fig. 3A) was significantly greater than 0 (P=0.049). For the left side group (n=8), the mean HPF CLI was less than 0 (P=0.075). CLI did not agree with IAT for 1 right sided patient, and 2 left sided patients. As compared to GLMLI using the same HPF ROI, CLI provided improved performance for seizure side/IAT laterality prediction for the right sided seizure group, while similar performance for the left sided seizure group. Also, CLI significantly (P=0.0059, two sample t-test, 2-tailed) differentiated the right sided and the left sided seizure groups. For normal controls, both GLMLI and CLI yielded a symmetrical distribution around zero, meaning no memory laterality found by either LI. A detailed list of CLI, GLMLI, IAT assessment, EEG, and structural MRI assessment for each epilepsy patient is provided in Table 1.
Figure 3.
CLI and GLMLI distributions of the epileptic patients and normal controls calculated from the scene-encoding fMRI data within A) HPF, B) hippocampus, and C) BG. The “right” and “left” unilateral epilepsy patient groups are subdivided according to their side of seizure. “controls” means normal healthy subjects. The scattered points overlapped on the bars are LIs of the right (diamonds) and the left patient group (circles).
Table 1.
list of seizure side, CLI, GLMLI, IAT assessment, EEG assessment, and structural MRI assessment for the epilepsy patients.
| Side | CLI | GLMLI | IAT-AR* | IAT-Lat | EEG | MRI | |
|---|---|---|---|---|---|---|---|
| s10 | B | 0.048 | −0.022 | ||||
| s14 | B | −0.034 | 0.021 | B | B | ||
| s04 | R | 0.106 | 0.029 | 0.41 | L | R | |
| s05 | R | 0.087 | 0.024 | 0.5 | L | R | R |
| s08 | R | 0.023 | −0.0058 | R | R | ||
| s09 | R | −0.0021 | 0.0024 | −0.09 | NA | R | L |
| s15 | R | 0.0041 | −0.065 | 1 | L | ||
| s18 | R | 0.12 | 0.039 | 0.2 | L | R | R |
| s03 | L | −0.054 | −0.13 | L | L | ||
| s06 | L | 0.025 | −0.057 | 1.33 | R | ||
| s07 | L | 0.00109 | −0.024 | 0.4 | R | L | L |
| s11 | L | −0.013 | −0.023 | 0.33 | R | L | L |
| s16 | L | −0.036 | 0.006 | 1 | R | ||
| s17 | L | −0.12 | −0.050 | L | L | ||
| s19 | L | −0.088 | −0.046 | 0.15 | R | B | |
| S20 | L | 0.00 | −0.0034 | −.04 | NA |
As shown in Fig. 3B, CLI with the HIPP ROI lateralized to the left for one patient in the right TLE group. CLI distributions for the left sided patient group and the controls were symmetric, yielding no useful information for lateralization. For both patients and controls, GLMLI yielded symmetric distributions using the HIPP ROI.
In the control BG ROI, GLMLI and CLI were symmetrically distributed for both patients (the right side and left side unilateral epilepsy patients) and controls as shown in Fig. 3C.
CLI calculation using the pseudo null-hypothesis data
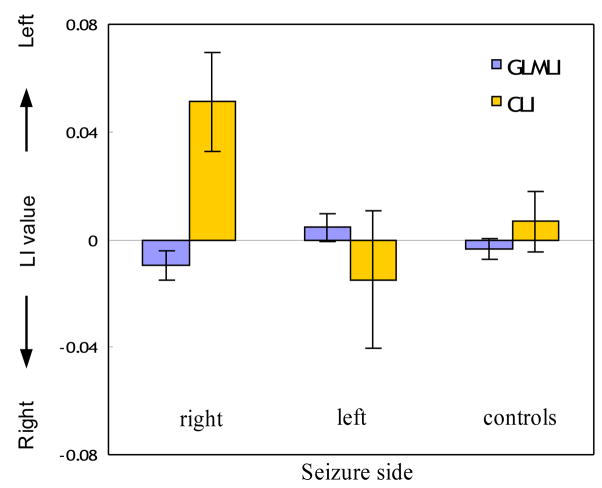
The t-value of the GLM on each voxel’s task-effect-removed (pseudo null-hypothesis) data of every subject was less than 0.00001, reflecting effective task effect removal. Fig. 4 shows the results of LI calculation from the task-effect-removed fMRI data using the HPF ROI. As compared to the results shown in Fig. 3A (using the original data), GLMLI of all subgroups calculated from the pseudo null-hypothesis data were closer to zero (not significantly different than zero), reflecting the removal of task induced effects. However, CLI still pointed to the correct seizure side for all but one patient of the right TLE group, and it was significantly greater than 0 (P=0.039) in the right sided group. For both the left TLE patient group and normal controls, GLMLI and CLI yielded symmetric distributions.
Figure 4.
Predicting the seizure side using LIs calculated from the pseudo null-hypothesis data within the HPF ROI. Patients with unilateral seizure were subdivided into the right and left groups same as in previous figures. Controls mean normal healthy subjects.
Correlation with Pre-Surgical Clinical Lateralization Measures
The CLI measure was significantly correlated with EEG laterality (r=−0.79, p=0.003), laterality of hippocampal volumetry by structural MRI (r=−0.78, p=0.013) and IAT laterality (r=0.78, p=0.013), while the GLMLI was only significantly correlated with IAT (r=0.87, p=0.003) laterality.
Correlation with Post-Surgical Change in Neuropsychological Measures
For patients with right TLE (n=6), significant correlations were found between the KCC in each side of HPF and the change in rate of forgetting (word list) (r=−0.96, p=0.002 for LW; r=−0.935, p=0.006 for RW). For patients with left-side seizure (n=7), significant correlations were found between the KCC in each side of HPF and change in immediate memory for faces (r=0.88, p=0.018 for LW; r=0.969, p=0.001 for RW).
A combination of GLMLI and CLI
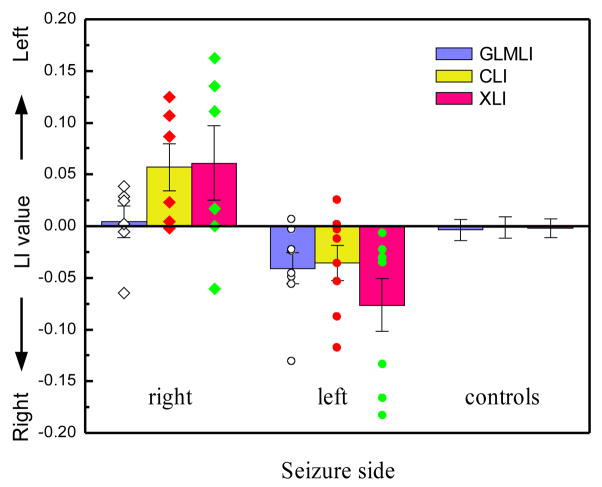
Fig 5 shows the performance of XLI (based on the ratio of positive T voxels and the coherence) for the same control group and left right unilateral epilepsy patient groups. As compared to GLMLI or CLI, the combined index showed increased difference between the right and left sided patient group and improved lateralization for the left sided patient group. For the control group, XLI demonstrated the smallest variance among the three indices. Its performance for the right sided group was weakened by one outlier.
Figure 5.
Error bars of GLMLI, CLI, and XLI for the epileptic patients and normal controls calculated from the scene-encoding fMRI data within HPF. The “right” and “left” unilateral epilepsy patient groups are subdivided according to their side of seizure. “controls” means normal healthy subjects. The scattered points overlapped on the bars are LIs of the right (diamonds) and the left sided patient group (circles).
Discussion
The spatial coherence of functional activity is an intrinsic property of brain function that can be used for hemispheric lateralization of function within functionally relevant ROI. In this paper, an fMRI data coherence based laterality index (CLI) was evaluated as a tool to assess function laterality in both sensorimotor cortex and the mesial temporal lobe.
In sensorimotor cortex during a unilateral motor task, the CLI within MC correctly lateralized to the activated hemisphere. Although functional stimulation generally increased the coherence in brain regions regardless of whether those regions were involved in the functional task or not, markedly increased coherence laterality was only observed in the task-associated functional regions (MC and FC for the sensorimotor task), suggesting a task-specific effect. This effect was also subtly detected within the hemispheric ROI.
CLI calculated within HPF in control subjects using both resting data and sensorimotor data showed a symmetric distribution, suggesting no prominent coherence laterality in HPF of the normal brain. A symmetrical distribution was also found in the HPF CLI calculation using normal subjects’ scene-encoding fMRI data, suggesting no functional lateralization in HPF of the normal brain during the scene-encoding task.
Using scene-encoding data acquired from patients with unilateral TLE, HPF CLI showed functional memory lateralization away from the seizure side (or the IAT memory laterality since they were the same for the patient cohort assessed in this paper) for both the left side and the right side unilateral epilepsy patients. CLI in HPF of the right side patient group was significantly greater than 0, meaning the brain activity coherence in the left side of HPF was significantly larger than the right side (seizure side). As compared to GLMLI, CLI provided improved correlations with IAT memory laterality for the right side seizure group and for differentiating the right sided group from the left sided group. CLI performance for the left sided patient group was dominated by one outlier. Similar results were also obtained when comparing CLI with a probability weighted GLMLI (where the T value of each voxels within the functional ROI was weighted by 1-2P (P is the p value of that voxel), and the laterality was then determined by comparing the area under the weighted T value distribution curve from the left and right side of functional region) (Branco et al., 2006). For simplicity of description, we only showed the comparison results with the ratio-based GLMLI (Rabin et al., 2004a) in this paper. The improved performance of CLI as compared to GLMLI may be attributable to its data-driven property. The coherence measure does not require prior brain response modeling based on an a priori hemodynamic response function that may be somewhat inaccurate for pathological brain.
Variations of the functional ROI are a potential source of variability for CLI calculation. Although CLI could be altered by the size of ROIs, additional CLI calculations using the normal controls’ sensorimotor data with different sizes of MC ROIs demonstrated that CLI could still yield a correct function laterality, even when using a hemispheric ROI. We selected HPF ROI for CLI calculation during scene encoding mainly because we have empirically found this larger medial temporal ROI provides more reproducible GLMLI for memory lateralization for TLE patients (Detre et al., 1998; Rabin et al., 2004a). Our results showed that CLI with HPF was able to predict the side of seizure laterality and corresponding IAT memory laterality. As with GLMLI, performance of CLI for predicting seizure laterality and IAT memory laterality was markedly degraded when using data from a much smaller hippocampal (HIPP) ROI, likely reflecting inadequate sensitivity in this small ROI which is further degraded by susceptibility artifacts (Ojemann et al., 1997). In a control brain region, the basal ganglia, CLI did not show a biased distribution for all patients and controls. For all assessed target functional or control regions, CLI yielded symmetric distributions for the normal controls performing the same scene-encoding fMRI task.
Note that in our patient cohort, IAT memory laterality was always contralateral to seizure laterality. Therefore, it was impossible to assess the relative sensitivity of CLI for lateralizing the seizure focus versus memory activity. The effects of seizure laterality independent of memory activity would be ideally assessed in resting fMRI data, though mesial temporal memory activity may persist during a resting task (Stark and Squire, 2000). In this study, removal of task effects from scene-encoding fMRI data was used to assess the utility of CLI for memory lateralization from pseudo-resting data, since true resting data was not available from the epilepsy patient cohort. Interestingly, CLI still correctly lateralized the seizure side for all but one patient of the right side group, and it was significantly greater than 0 (P=0.039) in the right side group. Further verification of this potential using actual resting data and a larger sample size is acquired.
Spatial smoothing applied during data preprocessing could alter measured spatial coherences. To minimize this effect, a modest isotropic smoothing kernel with an FWHM of 6 mm was used in this paper to improve the spatial SNR of fMRI data. As previously demonstrated (Kriegeskorte et al., 2006), this kernel size should not alter the coherence measurement. Furthermore, this smoothing kernel is much smaller than any of the ROIs assessed in this paper.
As a pure data-driven method, CLI may vary with the length of the acquired fMRI time series. The calculated temporal CLI convergence curve showed that an fMRI data series longer than 100 timepoints is enough to get a robust estimation of CLI, which subsequently guaranteed an effective coherence laterality determination with the data used in this paper, since all of them were longer than 100. Our simulations with 84 fMRI images showed that CLI could still indicate the correct size of the lateralized motor task for normal subjects and determine memory laterality for patients with seizure lateralized to the left (data not shown); GLMLI had better performance for memory lateralization for epilepsy patients with left sided focal seizures but worse performance for the right sided patient group and for differentiating the left side group from the right side group.
Since CLI and GLMGI reflect different properties of the data, it is possible if not likely that they can be combined to increase specificity. Indeed, in clinical practice lateralization of seizures or brain function is typically based on consideration of a broad range of complementary data. Our data demonstrated that improved lateralization could be potentially achieved by combining GLMLI and CLI.
Although these preliminary findings are promising, the application to memory lateralization for epilepsy patients was limited by the small number of patients assessed and the lack of a true “gold standard” for memory lateralization. CLI was more effective than GLMLI only for the right sided TLE group, and its performance for the left side patient group was largely affected by one outlier. A much larger sample size of TLE patients including careful documentation of post-surgical memory change following temporal lobectomy would be required to further verify the usefulness of CLI for memory lateralization. Resting fMRI data from unilateral epilepsy patients would also be required to assess the feasibility of using CLI to determine the memory (or other) functional laterality from the resting brain. The effects of smoothing on CLI calculations should also be assessed in future work.
Acknowledgments
This work was supported by NIH grants R03DA023496, 1R01MH080729, and R01NS44266.
Footnotes
Publisher's Disclaimer: This is a PDF file of an unedited manuscript that has been accepted for publication. As a service to our customers we are providing this early version of the manuscript. The manuscript will undergo copyediting, typesetting, and review of the resulting proof before it is published in its final citable form. Please note that during the production process errors may be discovered which could affect the content, and all legal disclaimers that apply to the journal pertain.
References
- Adcock JE, Wise RG, Oxbury JM, Oxbury SM, Matthews PM. Quantitative fMRI assessment of the differences in lateralization of language-related brain activation in patients with temporal lobe epilepsy. Neuroimage. 2003;18:423–438. doi: 10.1016/s1053-8119(02)00013-7. [DOI] [PubMed] [Google Scholar]
- Benson RR, FitzGerald DB, LeSueur LL, Kennedy DN, Kwong KK, Buchbinder BR, Davis TL, Weisskoff RM, Talavage TM, Logan WJ, Cosgrove GR, Belliveau JW, Rosen BR. Language dominance determined by whole brain functional MRI in patients with brain lesions. Neurology. 1999;52:798–809. doi: 10.1212/wnl.52.4.798. [DOI] [PubMed] [Google Scholar]
- Binder JR, Rao SM, Hammeke TA, Frost JA, Bandettini PA, Jesmanowicz A, Hyde JS. Lateralized human brain language systems demonstrated by task subtraction functional magnetic resonance imaging. Arch Neurol. 1995;52:593–601. doi: 10.1001/archneur.1995.00540300067015. [DOI] [PubMed] [Google Scholar]
- Binder JR, Swanson SJ, Hammeke TA, Morris GL, Mueller WM, Fischer M, Benbadis S, Frost JA, Rao SM, Haughton VM. Determination of language dominance using functional MRI: a comparison with the Wada test. Neurology. 1996;46:978–984. doi: 10.1212/wnl.46.4.978. [DOI] [PubMed] [Google Scholar]
- Branco DM, Suarez RO, Whalen S, O’Shea JP, Nelson AP, da Costa JC, Golby AJ. Functional MRI of memory in the hippocampus: Laterality indices may be more meaningful if calculated from whole voxel distributions. Neuroimage. 2006;32:592–602. doi: 10.1016/j.neuroimage.2006.04.201. [DOI] [PubMed] [Google Scholar]
- Carpentier A, Pugh KR, Westerveld M, Studholme C, Skrinjar O, Thompson JL, Spencer DD, Constable RT. Functional MRI of language processing: dependence on input modality and temporal lobe epilepsy. Epilepsia. 2001;42:1241–1254. doi: 10.1046/j.1528-1157.2001.35500.x. [DOI] [PubMed] [Google Scholar]
- Chlebus P, Mikl M, Brazdil M, Pazourkova M, Krupa P, Rektor I. fMRI evaluation of hemispheric language dominance using various methods of laterality index calculation. Exp Brain Res. 2007;179:365–374. doi: 10.1007/s00221-006-0794-y. [DOI] [PubMed] [Google Scholar]
- Desmond JE, Sum JM, Wagner AD, Demb JB, Shear PK, Glover GH, Gabrieli JD, Morrell MJ. Functional MRI measurement of language lateralization in Wada-tested patients. Brain. 1995;118 (Pt 6):1411–1419. doi: 10.1093/brain/118.6.1411. [DOI] [PubMed] [Google Scholar]
- Detre JA, Maccotta L, King D, Alsop DC, Glosser G, D’Esposito M, Zarahn E, Aguirre GK, French JA. Functional MRI lateralization of memory in temporal lobe epilepsy. Neurology. 1998;50:926–932. doi: 10.1212/wnl.50.4.926. [DOI] [PubMed] [Google Scholar]
- Fair DA, Schlaggar BL, Cohen AL, Miezin FM, Dosenbach NUF, Wenger KK, Fox MD, Snyder AZ, Raichle ME, Petersen SE. A method for using blocked and event-related fMRI data to study “resting state” functional connectivity. Neuroimage. 2007;35:396–405. doi: 10.1016/j.neuroimage.2006.11.051. [DOI] [PMC free article] [PubMed] [Google Scholar]
- Friston KJ, Jezzard P, Turner R. Analysis of Functional MRI Time-Series. Human Brain Mapping. 1994;1:153–171. [Google Scholar]
- Gibbons JD, Chakraborti S. Nonparametric Statistical Inference. 4. New York: Marcel Dekker Inc; 2003. [Google Scholar]
- Hamer HM, Wyllie E, Stanford L, Mascha E, Kotagal P, Wolgamuth B. Risk factors for unsuccessful testing during the intracarotid amobarbital procedure in preadolescent children. Epilepsia. 2000:554–563. doi: 10.1111/j.1528-1157.2000.tb00209.x. [DOI] [PubMed] [Google Scholar]
- Holmes AP, Friston KJ. Generalisability, Random Effects and Population Inference. Neuroimage. 1998:S754. [Google Scholar]
- Hopfinger JB, Buchel C, Holmes AP, Friston KJ. A study of analysis parameters that influence the sensitivity of event-related fMRI analyses. Neuroimage. 2000;11:326–333. doi: 10.1006/nimg.2000.0549. [DOI] [PubMed] [Google Scholar]
- Kendall M, Gibbons JD. Rank Correlation Methods. Oxford: Oxford University Press; 1990. [Google Scholar]
- Killgore WD, Glosser G, Casasanto DJ, French JA, Alsop DC, Detre JA. Functional MRI and the Wada test provide complementary information for predicting postoperative seizure control. Seizure. 1999;8:450–455. doi: 10.1053/seiz.1999.0339. [DOI] [PubMed] [Google Scholar]
- Kriegeskorte N, Goebel R, Bandettini P. Information-based functional brain mapping. PNAS. 2006;103:3863–3868. doi: 10.1073/pnas.0600244103. [DOI] [PMC free article] [PubMed] [Google Scholar]
- Maldjian JA, Laurienti PJ, Kraft RA, Burdette JH. An automated method for neuroanatomic and cytoarchitectonic atlas-based interrogation of fMRI data sets. Neuroimage. 2003;19:1233–1239. doi: 10.1016/s1053-8119(03)00169-1. [DOI] [PubMed] [Google Scholar]
- Milner B, Branch C, Rasmussen T. Study of short-term memory after intracarotid injection of sodium amytal. Transactions of the American Neurological Association. 1962;87:224–226. [Google Scholar]
- Narayan VM, Kimberg DY, Tang KZ, Detre JA. Experimental design for functional MRI of scene memory encoding. Epilepsy Behav. 2005;6:242–249. doi: 10.1016/j.yebeh.2004.12.006. [DOI] [PubMed] [Google Scholar]
- Ojemann JG, Akbudak E, Snyder AZ, McKinstry RC, Raichle ME, Conturo TE. Anatomic localization and quantitative analysis of gradient refocused echo-planar fMRI susceptibility artifacts. Neuroimage. 1997;6:156–167. doi: 10.1006/nimg.1997.0289. [DOI] [PubMed] [Google Scholar]
- Oppenheim AV, Willsky AS, Nawab SH. Signals and Systems. 2. New Jersey: Prentice Hall; 1996. [Google Scholar]
- Rabin ML, Narayan VM, Kimberg DY, Casasanto DJ, Glosser G, Tracy JI, French JA, Sperling MR, Detre JA. Functional MRI predicts post-surgical memory following temporal lobectomy. Brain. 2004a;127:2286–2298. doi: 10.1093/brain/awh281. [DOI] [PubMed] [Google Scholar]
- Rabin ML, Narayan VM, Kimberg DY, Casasanto DJ, Glosser G, Tracy JI, French JA, Sperling MR, Detre JA. Functional MRI predicts post-surgical memory following temporal lobectomy. Brain. 2004b;127:2286–2298. doi: 10.1093/brain/awh281. [DOI] [PubMed] [Google Scholar]
- Seghier ML. Laterality index in functional MRI: methodological issues. Magn Reson Imaging. 2008;26:594–601. doi: 10.1016/j.mri.2007.10.010. [DOI] [PMC free article] [PubMed] [Google Scholar]
- Stark CE, Squire LR. Functional magnetic resonance imaging (fMRI) activity in the hippocampal region during recognition memory. J Neurosci. 2000;20:7776–7781. doi: 10.1523/JNEUROSCI.20-20-07776.2000. [DOI] [PMC free article] [PubMed] [Google Scholar]
- Stern CE, Corkin S, Gonzalez RG, Guimaraes AR, Baker JR, Jennings PJ, Carr CA, Sugiura RM, Vedantham V, Rosen BR. The hippocampal formation participates in novel picture encoding: evidence from functional magnetic resonance imaging. Proc Natl Acad Sci U S A. 1996;93:8660–8665. doi: 10.1073/pnas.93.16.8660. [DOI] [PMC free article] [PubMed] [Google Scholar]
- Wada J, Rasmussen T. Intracarotid injection of sodium amytal for the lateralization of cerebral speech dominance: experimental and clinical observations. Journal of Neurosurgery. 1960;17:266–282. doi: 10.3171/jns.2007.106.6.1117. [DOI] [PubMed] [Google Scholar]
- Wang Z, Aguirre GK, Rao H, Wang J, Fernández-Seara MA, Childress AR, Detre JA. Empirical optimization of ASL data analysis using an ASL data processing toolbox: ASLtbx. Magn Reson Imaging. 2008;26:261–269. doi: 10.1016/j.mri.2007.07.003. [DOI] [PMC free article] [PubMed] [Google Scholar]
- Worsley KJ, Marrett S, Neelin P, Vandal AC, Friston KJ, Evans AC. A unified statistical approach for determining significant voxels in images of cerebral activation. Human Brain Mapping. 1996;4:58–73. doi: 10.1002/(SICI)1097-0193(1996)4:1<58::AID-HBM4>3.0.CO;2-O. [DOI] [PubMed] [Google Scholar]


