Abstract
The Edman Sequence Research Group (ESRG) of the Association of Biomolecular Resource designs and executes interlaboratory studies investigating the use of automated Edman degradation for protein and peptide analysis. In 2008, the ESRG enlisted the help of core sequencing facilities to investigate the effects of a repeating amino acid tag at the N-terminus of a protein. Commonly, to facilitate protein purification, an affinity tag containing a polyhistidine sequence is conjugated to the N-terminus of the protein. After expression, polyhistidine-tagged protein is readily purified via chelation with an immobilized metal affinity resin. The addition of the polyhistidine tag presents unique challenges for the determination of protein identity using Edman degradation chemistry. Participating laboratories were asked to sequence one protein engineered in three configurations: with an N-terminal polyhistidine tag; with an N-terminal polyalanine tag; or with no tag. Study participants were asked to return a data file containing the uncorrected amino acid picomole yields for the first 17 cycles. Initial and repetitive yield (R.Y.) information and the amount of lag were evaluated. Information about instrumentation and sample treatment was also collected as part of the study. For this study, the majority of participating laboratories successfully called the amino acid sequence for 17 cycles for all three test proteins. In general, laboratories found it more difficult to call the sequence containing the polyhistidine tag. Lag was observed earlier and more consistently with the polyhistidine-tagged protein than the polyalanine-tagged protein. Histidine yields were significantly less than the alanine yields in the tag portion of each analysis. The polyhistidine and polyalanine protein-R.Y. calculations were found to be equivalent. These calculations showed that the nontagged portion from each protein was equivalent. The terminal histidines from the tagged portion of the protein were demonstrated to be responsible for the high lag during N-terminal sequence analysis.
Keywords: chemistry, histidine, repetitive yield, initial yield, human growth hormone
For over 40 years, Edman degradation chemistry1 has been an invaluable tool for protein characterization. Although other techniques have surpassed Edman chemistry in ease, cost, and use for routine protein characterization, automated Edman degradation remains the most effective tool for obtaining N-terminal amino acid sequence information. For 20 years, the Edman Sequencing Research Group (ESRG) of the Association of Biomolecular Resource Facilities (ABRF) has enlisted the assistance of core sequencing facilities to perform studies aimed to achieve a greater understanding of the chemistry and the instrumentation used to obtain the N-terminal amino acid sequence of proteins and peptides.
A common task for core facilities performing Edman degradation chemistry is to verify correct protein purification of a polyhistidine-tagged protein through sequence identification. Although a polyhistidine-tagged protein is designed to facilitate purification and increase protein yields,2 it offers unique challenges for those performing Edman degradation chemistry. For the ESRG 2008 study, core sequencing facilities were enlisted to investigate the effects of a repeating amino acid tag at the N-terminus of a protein.
Edman degradation chemistry3 efficiency is determined primarily by two chemical reactions. The first is a phenylisothiocyanate (PITC)-coupling reaction to the N-terminus of a protein. PITC reacts with the free amine (NH2) group, resulting in an acid labile phenylthiocarbamyl derivative on the N-terminus of the protein. Following initial derivatization, trifluoroacetic acid (TFA) is introduced to cleave the modified N-terminal amino acid from the protein. After further modification to a more stable phenylthiohydantoin (PTH) derivative, the derivatized amino acid is chromatographed. The PTH amino acid is identified by its unique retention time in the chromatogram. This process is repeated iteratively for each subsequent terminal amino acid of the protein.
Automated Edman degradation chemistry cannot be continued indefinitely because of inefficiencies in the coupling and cleavage reactions. The coupling and cleavage reactions are rarely 100% efficient. A measure of the efficiency of the Edman degradation chemistry is defined by its repetitive yield (R.Y.).4 For the instruments operating in most laboratories, a 92–94% overall R.Y. is considered acceptable. For example, after 10 cycles, the average amino acid yield will be approximately 50% (0.9410=53.8%) that of the initial yield. After 20 cycles, the average amino acid yield will drop to approximately 30% (0.9420=29.0%). The longer the sequencing string becomes, the more difficult it is to identify the released amino acid.
A polyhistidine-tagged protein presents a dual challenge for an N-terminal sequence analysis using Edman degradation chemistry. First, the N-terminal sequence analysis must extend at least 8–10 aa beyond the polyhistidine tag to determine a protein's identification. Although a typical analysis may require 10–15 cycles for protein identification, a polyhistidine-tagged protein may require 20 or more cycles to obtain enough sequence for protein identification. Second, histidine has been reported to produce a lower-than-average R.Y. during an N-terminal sequence analysis.4 Six to eight histidines in a row from a typical polyhistidine-tagged protein, each having a lower-than-average yield, contribute to the difficulty of calling sequence beyond the tag. Problems with sequencing preview (an amino acid seen in the cycle prior to its release) have also been reported when sequencing histidine-containing proteins.5-8 Interpretation of the N-terminal sequence data is complicated further when preview amino acids are observed.
For the 2008 study, the ESRG enlisted the help of core sequencing facilities to investigate the effects of a repeating amino acid tag at the N-terminus of a protein. Participating laboratories were asked to sequence the same protein engineered in three configurations: with an N-terminal polyhistidine tag; with an N-terminal polyalanine tag; and with no tag. Human growth hormone (hGH) was the protein chosen for this study, as it was known to be sequenced easily in its native state. The polyhistidine- and polyalanine-tagged hGH protein each had 11 aa in the tagged region. As a tagged control protein, polyalanine was chosen as a result of the established sequenceability of the amino acid.9
MATERIALS AND METHODS
Cloning, Expression, and Purification
Homo-poly amino acid DNA constructs were designed by the technicians at Genentech, Inc. (South San Francisco, CA). The following hGH PCR primers were used:
Plasmid Vectors and Clones Used in the Study
| DNA construct | Oligonucleotide primer sequence |
|---|---|
| <hGH.cHis.ClaI> | CCATCGATTCCACCATGGCTACAGGCTCCCG |
| <hGH.cHis.AscI> | GGCGCGCCAGAAGCCACAGCTGCCCTC |
| <hGH.nHis.AscI> | GGCGCGCCCTAGAAGCCACAGCTGCCC |
| <hGH.nHis.XhoI> | CTCGAGTTCCCAACCATTCCCTTATCC |
| <HGHpolyA.ClaI.F> | CCATCGATGCTGCAGCTGCAGCTGCAGCTGCATTCCCAACCATTCCCTTATCC |
| <HGHpolyK.ClaI.F> | CCATCGATAAGAAGAAGAAGAAGAAGAAGAAGTTCCCAACCATTCCCTTATCC |
| <HGHpolyY.ClaI.F> | CCATCGATTACTACTACTACTACTACTACTACTTCCCAACCATTCCCTTATCC |
| Cycle # | |||||||||||||||||
| Sample | 1 | 2 | 3 | 4 | 5 | 6 | 7 | 8 | 9 | 10 | 11 | 12 | 13 | 14 | 15 | 16 | 17 |
| C | F | P | T | I | P | L | S | R | L | F | D | N | A | M | L | R | A |
| H | K | H | H | H | H | H | H | H | H | L | E | F | P | T | I | P | L |
| A | K | I | D | A | A | A | A | A | A | A | A | F | P | T | I | P | L |
PCR reaction was performed with Clontech Advantage guanine-cytosine polymerase mix (Clontech, Palo Alto, CA). After PCR, 5 μL of the reaction was run on a gel to visualize the product. DNA was purified further using a PCR clean-up kit. The DNA was subjected to restriction digests, as were the pRK.sm vectors (1.5 h at 37°C). The N-terminal histidine-tagged hGH was cut with XhoI, and Poly(X) hGHs were cut with ClaI and AscI. The N-terminal histidine-tagged pRK.sm was cut with XhoI, AscI, and calf intestinal alkaline phosphatase. A clean-up kit was used to purify the DNAs further.
Products were ligated at a 1:3 ratio of vector:insert (total volume, 10 μL) and incubated overnight at 14°C. The DNA was then transfected into human embryo kidney (HEK) 293 cells using Qiagen Polyfect (Qiagen, Valencia, CA). For each 150 cm2 cells, 0.6 mL serum-free 50:50 media containing 16 μg DNA was mixed with 160 μL Polyfect and incubated at room temperature for 10 min. Fresh complete media (10 mL) were added to each plate during the incubation. After incubation, 1 mL complete media was added drop-wise onto cells. Following a 3-day incubation, the media were removed from the plates and incubated with washed nickel-nitrilotriacetic acid resin (4°C, 2 h). Solutions were spun and washed with PBS, and the protein was eluted with 250 mM imidazole in PBS.
It should be noted that attempts were made to create additional proteins with a polylysine and polytyrosine tags on the N-terminus of hGH. In both instances, constructs were designed successfully, but the HEK 293 cells failed to produce viable protein.
Test Proteins
Each of N-terminally tagged proteins in this study consisted of 11 aa preceding hGH. The tag incorporated a string of 8 aa polyhistidine or polyalanine for the two test proteins. DNA construct preparation was simplified by the addition of extra nucleotides that added 3 aa to the tag portion of the two proteins, which were designed so that the N-terminal amino acid of hGH begins at cycle 12. The control protein was untagged hGH.
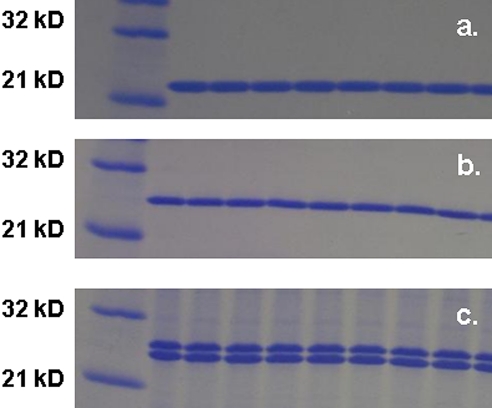
Test proteins were analyzed by SDS-PAGE and stained with Coomassie brilliant blue (Fig. 1.). Approximate concentrations were determined based on the intensity of the control hGH protein. N-terminal sequence for each of the test proteins was verified by Edman degradation chemistry.
Figure 1.
SDS-PAGE of each protein used in this study. (a) Control; (b) polyhistidine-tagged hGH protein; (c) polyalanine-tagged hGH protein. Molecular weight of each protein is ∼25 kD. The second, lower molecular weight band in the polyalanine-tagged sample has the same N-terminal sequence as the top band.
Two bands (∼25 and ∼24 kDa) were observed from the SDS-PAGE analysis of the polyalanine-tagged (Sample A) protein. Both bands produced an identical N-terminal sequence, indicating a truncation on the C-terminal end of the protein for the lower band.
Processing and Distribution
The 2008 study was announced by direct email to all ABRF members, posting on the ABRF discussion forum and under “Open Research Studies” and on the ESRG page of the ABRF web site. A total of 41 requests for samples were received. Samples were sent out by regular mail to all who requested them.
Prior to distribution to participating laboratories, test samples were reduced (10 mM DTT) and alkylated (0.2 M N-isopropyl iodacetamide). The untagged control (25 pmol; Sample C) along with the visual equivalent of 25 pmol for polyhistidine-tagged (Sample H) and polyalanine-tagged (Sample A) samples were loaded onto multiple gels (4–20% tris-glycine) and electroblotted onto polyvinylidene difluoride. Protein bands were visualized with Coomassie blue stain. Two bands were excised from each blot and sent to participating laboratories. Of the doublet observed for Sample A, only the ∼25 kDa top band was sent to participating laboratories. Study participants were asked to sequence all three samples and to return a data file containing the uncorrected (raw) amino acid picomole yields for the first 17 cycles from each. Initial and R.Y. information and the amount of lag were evaluated. Information about instrumentation and sample treatment was also collected.
RESULTS AND DISCUSSION
Survey of Instrumentation
Data were received from 23 independent laboratories, including six data sets from ESRG committee members. The sequencer and reagents used by participants and ESRG committee members in the 2008 study are summarized as follows. Instrumentation used by all study participants was manufactured exclusively by Applied Biosystems (Foster City, CA, USA) and consisted of nine Procise® (model cLC) and 14 Procise® (model HT) sequencers. Twenty laboratories report using pulsed liquid and three report using gas-phase delivery for the TFA cleavage step. Study participants primarily used the manufacturer reagents. A few laboratories reported including the following additives to the manufacturer reagents: tris-2-carboxyethyl phosphine to R4 (two laboratories) and DTT to R4 or S2 (one laboratory each). All participants having a cLC instrument used the cLC PTH column (Applied Biosystems) for chromatography. Of the HT users, 12 used the Spherisorb PTH column (Applied Biosystems), and two used a Haisil PTH column (Higgins Analytical, Mountain View, CA) for their analyses.
Sequencing Accuracy
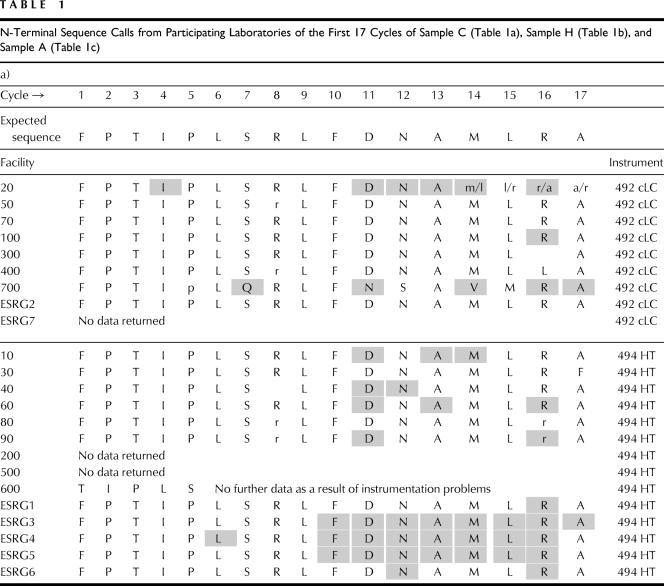
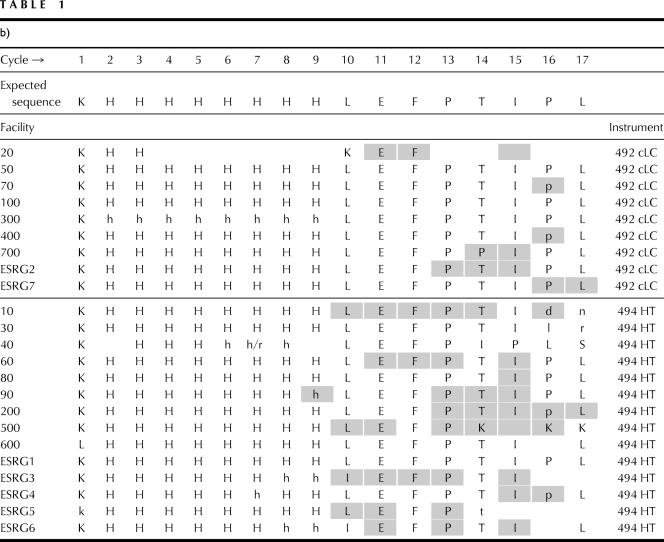
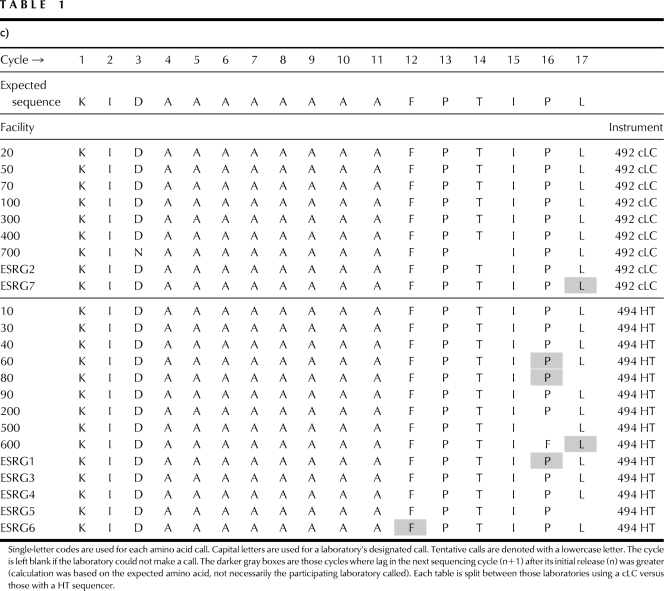
Sequences called by study participants and the ESRG committee are shown in Table 1. Of the 23 laboratories participating in the study, all called sequence of the three proteins successfully. All participating laboratories returned data from the polyhistidine-tagged (Sample H) and polyalanine-tagged (Sample A) proteins. Three of the laboratories did not return data from the control (Sample C) protein, a possible indication that too much instrument time was requested from study participants for this study. For the first 17 cycles, amino acid calls (including tentative calls) were 100% accurate for 13 of 20 (65%) laboratories for Sample C, 13 of 23 (57%) laboratories for Sample H, and 18 of 23 (78%) laboratories for Sample A proteins. Of the three proteins, Sample A was the easiest for laboratories to sequence. Each of the five laboratories, which were <100% accurate, missed only 1 aa call. Sequence data indicate Sample C was also easy to call. Five of the seven laboratories, which were <100% accurate, missed only 1 aa call. One laboratory had difficulty sequencing this sample, missing the last four cycles. The other laboratory reported instrumentation problems for Sample C. Of the three, Sample H was the most difficult to sequence. Seven of the 10 laboratories, which were <100% accurate, missed amino acid calls at two or more cycles.
TABLE 1.
N-Terminal Sequence Calls from Participating Laboratories of the First 17 Cycles of Sample C (Table 1a), Sample H (Table 1b), and Sample A (Table 1c)
Arginine continues to be a difficult amino acid to identify in a sequence analysis,3,9 Charged anilinothiazolione (ATZ)-arginine extracts poorly from the cartridge to the flask. After modification, the resulting PTH-arginine peak is typically smaller and therefore, more difficult to call than other released amino acids. Five laboratories could not call or tentatively called arginine at cycle 8 and cycle 16 of the control sample.
Participating laboratories also tended to have more difficulty making correct amino acid calls in the later cycles of an analysis. Four laboratories each missed amino acid calls in the last two cycles (cycles 16 and 17) of the analysis for Samples C and A. Eight laboratories missed amino calls in the last two cycles of the analysis for Sample H. It is not unusual for an analyst to have more difficulty interpreting the N-terminal sequence in later cycles. As Edman degradation chemistry is <100% efficient, released amino acid yield decreases during a sequence analysis. Likewise, amino acid background and lag each increases throughout the analysis. Both sets of factors contribute to the difficulty an analyst will experience when reading sequence in the later cycles of an analysis.9 When the 2008 ESRG study was designed, the ESRG committee expected to see variation in the N-terminal sequencing results among the three samples analyzed and the participating laboratories. Missed amino acid calls will be discussed further in the next section.
Histidine Versus Alanine Tag
N-terminal sequence data from all laboratories were used to compare the polyhistidine- with polyalanine-tagged protein. These data were used to determine if a polyhistidine-tagged protein is intrinsically more difficult to sequence than other amino acids. Two pieces of evidence—lag and yield—will be presented for this comparison.
As Sample H and Sample A proteins are identical, except for the 11-aa tag regions on the N-terminus, a comparison of lag between the two proteins can be made. Lag as defined for this study, is the amount of an amino acid observed as the n + 1 cycle. Amino acid lag typically shows a steady increase in an N-terminal sequence analysis because of the inefficiencies with the Edman degradation over multiple cycles of an analysis. Lag can also increase significantly from one cycle to the next, as certain amino acids are more inefficient at the coupling or cleavage steps. Therefore, a comparison of the protein sequencing data, beyond the tagged region of the protein, should indicate if one set of amino acids in a tag (histidines versus alanines) is intrinsically more difficult to sequence. Table 1, b (Sample H) and c (Sample A), shows those points in each sequence analysis where the picomole yield for an amino acid at the n + 1 cycle was greater than the cycle where it was released originally (amino acid highlighted in gray). The higher the lag, the more difficult it is for an analyst to interpret the sequencing data. There were 43 instances (cycles ≥12) from Sample H data where lag was greater in the n + 1 cycle. In Sample A, there were only six instances, and most of these occurred in cycles 15 and 16, where lag was greater in the n + 1 cycle. Most analysts in this study found the data from the polyalanine-tagged protein easier to interpret, as lag was not an issue.
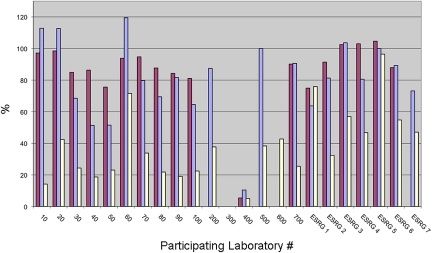
Percentage of lag was also measured for the three test proteins (Fig. 2.). Calculation of percent lag was based on amount of lag present in the cycle following the phenylalanine at cycle 12 for Sample H and Sample A. In all but one analysis, lag was greater for the polyhistidine sample at cycle 12 when compared with the polyalanine-tagged sample at the same cycle.
Figure 2.
Percentage of lag for the control protein (maroon bars), polyhistidine-tagged protein (blue bars), and polyalanine-tagged protein (white bars). Calculation of percent lag is based on amount of lag present in the cycle following the phenylalanine at cycle 12 for the polyhistidine-tagged and polyalanine-tagged samples and cycle 10 for the control sample.
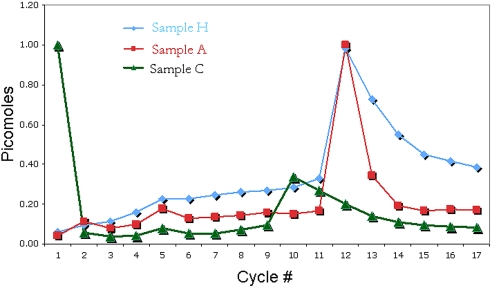
This lag is also evident when the normalized yield of phenylalanine is compared between the two proteins at each cycle (Fig. 3.). At cycle 12, phenylalanine was released at approximately equal picomole yields for Samples H and A proteins. However, in cycle 13, the normalized yield of phenylalanine was approximately two times greater for Sample H protein. Phenylalanine never returns to the background, precycle 12, picomole concentrations. The cycle 13 lag observed in Sample A protein approaches a return to background picomole concentrations. By cycle 14, background picomole concentration levels were observed.
Figure 3.
Normalized picomole yield of phenylalanine in all cycles [control (green ▴), polyhistidine-tagged protein (blue ♦), and polyalanine-tagged protein (red ■)]. A slight preview as well as significant lag are seen in the polyhistidine-tagged sample verses the control samples.
Sample C protein produced nearly as many amino acid calls with lag issues (dark gray) as Sample H (Table 1a). In addition, calculation of the percent lag for the phenylalanine at cycle 10 for Sample C protein from participating laboratories was often as high as the results from Sample H (Fig. 2). In Figure 3, phenylalanine yield after its release at cycle 10 decreased slowly in subsequent cycles. This may be because the hGH protein control has two prolines and an arginine in the first 10 cycles. These 2 aa are known to cleave and/or extract inefficiently3,9 during a sequence analysis.
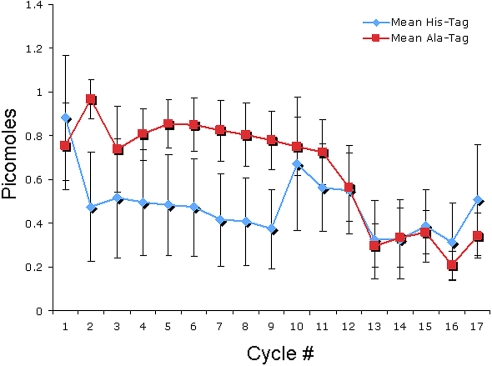
Figure 4 shows the normalized mean picomole value for each amino acid for each sequence analysis. This figure shows that the raw picomole yield for histidine is significantly less than alanine. Histidine is an amino acid that may not be extracted completely from the sequencer and is known to produce smaller peaks in a sequence analysis.4 Beyond the 11-tag aa region, however, amino acid yields from the hGH portion of the protein are similar.
Figure 4.
Normalized mean picomole values for the polyalanine-tagged sample (red ■) versus the polyhistidine-tagged sample (blue ♦). A noticeable decrease in picomole yield from cycle 1 to cycle 2 was observed in the polyhistidine-tagged sample. This decrease in yield was not present in the polyalanine-tagged sample. Error bars represent sample variation between facilities.
R.Y. was calculated for the polyhistidine- and polyalanine-tagged proteins from all participating laboratories (Table 2). To control for the histidine extraction issues discussed above, only the nontagged amino acids from each sequence were used for the R.Y. calculations. R.Y. was calculated as follows:
Generate a regression of the logarithm of the yield from each amino acid
R.Y. = exponential of the slope of the line.
TABLE 2.
R.Y. Results from Each Participating Laboratory for the Polyhistidine- and Polyalanine-Tagged Proteins
| Laboratory | Alanine-tagged R.Y. (%) | Histidine-tagged R.Y. (%) | R.Y. Ratio (His/Ala) |
| 10 | 92.6 | 91.9 | 0.99 |
| 20 | 91.3 | 91.5 | 1.00 |
| 30 | 93.9 | 92.7 | 0.99 |
| 40 | 95.8 | 97.0 | 1.01 |
| 50 | 92.9 | 93.3 | 1.00 |
| 60 | 98.3 | 96.8 | 0.98 |
| 70 | 92.3 | 94.8 | 1.03 |
| 80 | 91.8 | 90.3 | 0.98 |
| 90 | 92.9 | 89.4 | 0.96 |
| 100 | 93.3 | 93.2 | 1.00 |
| 200 | 94.2 | 94.0 | 1.00 |
| 300 | 92.5 | 93.8 | 1.01 |
| 400 | 93.5 | 89.9 | 0.96 |
| 500 | 90.8 | 89.0 | 0.98 |
| 600 | 93.7 | Not reported | – |
| 700 | 100.7 | 84.8 | 0.84 |
| ESRG1 | 95.0 | 91.7 | 0.97 |
| ESRG2 | 90.5 | 92.6 | 1.02 |
| ESRG3 | 94.5 | 97.6 | 1.03 |
| ESRG4 | 93.6 | 94.5 | 1.01 |
| ESRG5 | 91.3 | 105.9 | 1.16 |
| ESRG6 | 90.9 | 95.8 | 1.05 |
| ESRG7 | 94.1 | 91.8 | 0.98 |
| Mean | 93.5 | 93.3 | 1.00 |
| sd | 2.4 | 4.1 | 0.05 |
Raw picomole yield from cycles 1 and 9–17 from the polyhistidine-tagged protein R.Y. calculation. Raw picomole yield from cycles 1–3 and 12–17 were used for the polyalanine-tagged protein R.Y. calculation. R.Y. ratio is the R.Y. of the polyhistidine-tagged protein over the polyalanine-tagged protein. A value of 1.0 means R.Y. values for the two proteins were equal.
For Sample A, R.Y.s were 90% or greater for all laboratories. Sample H was nearly as good with 18 of the 22 laboratories also reporting data that produced a R.Y. calculation >90%. Mean R.Y. for the 23 laboratories reporting Sample A data was 93.5%. The 22 laboratories reporting Sample H data produced a nearly identical mean R.Y. result of 93.3%. R.Y. data from the two proteins within each laboratory are also consistent. Calculated ratios (histidine-tagged:alanine-tagged) are between 0.95 and 1.05 for all but two laboratories. Ratio data averages 1.0, indicating no difference in R.Y. results between the two proteins within each laboratory.
It should be reported that initial yields were also calculated from all data submitted by participating laboratories (data not shown). Initial yield results varied significantly, as participating laboratories varied the number of protein bands used in a sequence analysis and as two different instruments were used to collect the data. No conclusions could be drawn from the initial yield data.
Together, the lag and R.Y. results build a picture of how a polyhistidine tag affects an N-terminal sequence analysis. Edman degradation chemistry appears to be less efficient for histidine, as illustrated by the lag data (Figs. 2 and 3). Most laboratories saw significantly more lag with Sample H than the other two test samples. N-terminal sequence interpretation becomes more difficult for the analyst when the lag amino acid yield is equal to or greater than the cycle where it is released initially. The analyst is left with the difficult choice of choosing a repeat call at the n + 1 cycle or looking for another amino acid in the chromatogram. In addition, low histidine extraction efficiency was confirmed, as illustrated in Figure 4, further corroborating that Edman degradation is less efficient with this amino acid.
R.Y. data initially appear to contradict conclusions of low-efficiency chemistry and extraction. For an N-terminal sequence analysis, high lag should result in a low R.Y. Instead, R.Y. calculations from this study show that polyhistidine- and polyalanine-tagged proteins produce the same result and were within the acceptable parameters of the N-terminal sequencing technique. It must be remembered that a R.Y. calculation only measures the yield of an amino acid at the cycle where it is released. The calculation gives no indication of how the N-terminal sequence analysis is performing for that amino acid in subsequent cycles. The R.Y. calculation in this study, however, is biased toward the amino acids released after the tag. The effect of histidine on the sequence analysis had already occurred before the majority of amino acids used in the calculation was measured. If all of the amino acids following the histidine tag were low, then the slope of the best-fit line may be equal to a calculated slope, where all of the amino acid yields were high. The normalized amino acid yield data from Figure 4 illustrate that the hGH portion (cycles 12–17) of each sequence analysis was equally efficient. With amino acid yields equivalent, so too were the R.Y. calculations.
Data from this study were used to assess potential histidine preview claimed by early users of Edman chemistry. Blombäck et al.5 first reported abnormal cleavage of histidine during automated Edman degradation of fibrinogen, later followed by Thomsen et al.,6 Walker et al.,7 and Kingston et al.8 Thomsen et al.6 observed that abnormal histidine cleavage occurred after coupling of PITC in volatile buffers such as dimethylalylamine (DMAA). Importantly, this cleavage occurred prior to the programmed acid cleavage step. It was demonstrated that the pH of the solution in the spinning cup sequencer was 6.5 after evaporation of the DMAA coupling buffer, suggesting the possibility that cyclization and cleavage were the result of this pH drop. Maintaining the pH of the coupling buffer between pH 9.2 and pH 9.5 during the evaporation step by substituting DMAA with N-methylmorpholine or the use of Quadrol™ [N,N,N′,N′-tetrakis (2-hydroxypropyl) ethylenediamine] abolished abnormal histidine cleavage. Interestingly, lowering the pH of the Quadrol™ buffer did not produce abnormal histidine cleavage.
In these previous studies, the abnormal histidine cleavage caused a preview sequence to be observed where the amino acid following (histidine+1) in the protein sequence was also observed in the same sequencer cycle as histidine. However, reports of abnormal histidine cleavage or “histidine preview” have not been observed in the literature following the introduction of the second generation of automated Edman sequencing instruments, where the sample is immobilized on a solid support, and volatile coupling bases triethylamine, diisopropylethylamine, or N-methylpiperidine have been used.
A phenomenon resembling histidine preview was observed for the polyhistidine but not for the polyalanine-tagged sample as demonstrated in Figure 3. The picomole yield of PTH-phenylalanine (PTH-Phe) is shown as a function of cycle number. As phenylalanine appears first in the sequence at cycle 12, one would expect background levels of PTH- Phe to remain low until its release. However, as sequencing progressed through the histidine-tagged region, there was a steady increase in the signal for PTH-Phe. In contrast, the alanine-tagged sample data show a low PTH-Phe background until cycle 12. However, if sequential, abnormal histidine cleavage occurred during sequencing of the histidine-tagged sample, one would expect to observe increasing signals for PTH-histidine (PTH-His) as sequencing progressed through the histidine-tag region. In addition, the appearance of preview should be observed from all amino acids C-terminal to the tag region. This was not apparent from the data shown in Figure 4, where PTH-His yields remained relatively constant and PTH-Phe yields (Fig. 3) began to rise by cycle two.
To test further whether abnormal histidine cleavage could be occurring and therefore, responsible for the increases in the PTH-Phe signals, the ESRG sequenced BSA. The N-terminal 4 aa of BSA are: D-T-H-K. If abnormal histidine cleavage were to occur during cycle three, one should observe an increase in the signal for PTH-lysine in that cycle. Instead, no increase could be observed, suggesting that abnormal histidine cleavage has not occurred (data not shown).
The ESRG fully realizes that this study is essentially one comparison repeated 23 times. A more comprehensive study would have included not just polyalanine but other poly amino acids for comparison with the polyhistidine tag. Unfortunately, creation of other poly amino acid-tagged proteins was not easy to do. Attempts to express polylysine- and polytyrosine-tagged proteins were not successful. A more thorough study would have also included multiple proteins with polyalanine and polyhistidine tags for comparison. This was not possible as a result of time constraints and limits in the number of samples participating laboratories will handle. A follow-up study based on these findings would include a greater variety of tags and proteins.
CONCLUSIONS
For this study, the majority of participating laboratories successfully called the amino acid sequence for 17 cycles for all three test proteins (Table 1). Laboratories, in general, found it harder to call the sequence after the polyhistidine tag than the other two test samples. Lag was observed earlier and more consistently on the polyhistidine-tagged protein than the polyalanine-tagged protein (Table 1 and Fig. 2). Averaged phenylalanine yield data indicate a significant increase in lag for the polyhistidine sample as compared with the other two test samples (Fig. 3). Poor histidine extraction identified in an earlier publication4 was corroborated in this study. Histidine yields were significantly less than the alanine yields in the tag portion of each analysis (Fig. 4). The polyhistidine and polyalanine protein R.Y. calculations were found to be equal (Table 2). These calculations showed that the nontagged portion from each protein was equivalent. The histidines from the tagged portion of the proteins were found to be the reason for high lag in an N-terminal sequence analysis.
ACKNOWLEDGMENT
We thank Jessica Huard (Genentech, Inc.) for expressing and purifying the 2008 study proteins and Liza Ingle (Genentech, Inc.) for running the gels and blots for distribution. We also thank Glenda Cowart (Monsanto Co., St. Louis, MO) for removing identifiers from data supplied by the responding laboratories and communicating with the laboratories when questions arose. Finally, we thank all of the participating laboratories that analyzed the three test samples and sent in their results.
REFERENCES
- 1.Hunkapillar M, Hewick RM, Dreyer WJ, Hood LE. High-sensitivity sequencing with a gas phased sequencer. Met. Enzymol 1983; 91: 399– 413 [DOI] [PubMed] [Google Scholar]
- 2.Porath J. Immobilized metal ion affinity chromatography. Protein Expr Purif 1992; 3: 263– 281 [DOI] [PubMed] [Google Scholar]
- 3.PROCISE®, PROCISE® cLC, and PROCISE® C Protein Sequencing Systems User Guide, Rev. A., Applied Biosystems, Part #4340645, 2003
- 4.Brune DC, Hampton B, Kobayashi R, et al. ABRF ESRG 2006 Study: Edman sequencing as a method for polypeptide quantitation. J Biomol Tech 2007; 18: 306– 320 [PMC free article] [PubMed] [Google Scholar]
- 5.Blombäck B, Blombäck M, Hessel B, Iwanaga S. Structure of N-terminal fragments of fibrinogen and specificity of thrombin. Nature 1967; 215: 1445– 1448 [DOI] [PubMed] [Google Scholar]
- 6.Thomsen J, Kristiansen K, Brunfeldt K. The amino acid sequence of human glucagon. FEBS Lett 1972; 21: 315– 319 [DOI] [PubMed] [Google Scholar]
- 7.Walker JE, Carne AF, Runswick MJ, Harris JL, Bridgen JD. Glyceraldehyde-3-phosphate dehydrogenase: complete amino-acid sequence of the enzyme from Bacillus stearothermophilus.. Eur J Biochem 1980; 108: 549– 565 [DOI] [PubMed] [Google Scholar]
- 8.Kingston IB, Kingston BL, Putnam FW. Primary structure of a histidine-rich proteolytic fragment of human ceruloplasmin. I. Amino acid sequence of the cyanogens bromide peptides. J Biol Chem 1980; 255: 2878– 2885 [PubMed] [Google Scholar]
- 9.Hunkapiller MW, Granlund-Moyer K, Whiteley NW. Gas-phase protein/peptide sequencer. In Shively JE (ed). Methods of Protein Microcharacterization, 1986; 8: 223– 247 [Google Scholar]


