

Abstract
Despite being substantially outnumbered by intracortical inputs on thalamorecipient neurons, thalamocortical projections efficiently deliver acoustic information to the auditory cortex. We hypothesized that thalamic projections may achieve effectiveness by forming synapses at optimal locations on dendritic trees of cortical neurons. Using two-photon calcium imaging in dendritic spines, we constructed maps of active thalamic and intracortical inputs on dendritic trees of thalamorecipient cortical neurons in mouse thalamocortical slices. These maps revealed that thalamic projections synapse preferentially on stubby dendritic spines within 100 μm of the soma, whereas the locations and morphology of spines that receive intracortical projections have a less-defined pattern. Using two-photon photolysis of caged glutamate, we found that activation of stubby dendritic spines located perisomatically generated larger postsynaptic potentials in the soma of thalamorecipient neurons than did activation of remote dendritic spines or spines of other morphological types. These results suggest a novel mechanism of reliability of thalamic projections: the positioning of crucial afferent inputs at optimal synaptic locations.
Introduction
Reliability and temporal precision of stimulus delivery to the sensory neocortex are essential for timely and accurate representation of the external world in the brain. In mammals, the thalamocortical pathway provides effective delivery of sensory information to the sensory neocortex (Ferster et al., 1996; Brecht and Sakmann, 2002; DeWeese et al., 2003), i.e., neurons in thalamic nuclei send axons to the sensory cortices, in which they synapse on neurons in the cortical middle layers (McGuire et al., 1984; Chiaia et al., 1991; Sherman and Guillery, 2002). Neurons in these layers also receive intracortical (IC) inputs (McGuire et al., 1984; Ahmed et al., 1994) that substantially outnumber the thalamic (Th) inputs (Benshalom and White, 1986). Nonetheless, Th projections reliably deliver information to thalamorecipient neurons (Rose and Metherate, 2005) and are considered the most powerful projection system in the mammalian brain (Stratford et al., 1996; Gil et al., 1999).
Previous studies have presented various models of reliability of thalamocortical pathways, including high-efficacy (Stratford et al., 1996; Gil et al., 1999; Amitai, 2001), larger synapses (Nahmani and Erisir, 2005) or low-efficacy synapses that require cortical amplification (Douglas et al., 1995; Lübke et al., 2000) or synchronization (Bruno and Sakmann, 2006). In all of these studies, the subcellular distributions of Th and IC inputs along dendritic trees of thalamorecipient neurons has been presumed to be random; however, this assumption has never been verified. Here we hypothesized that Th inputs synapse at preferred locations on dendritic trees of thalamorecipient neurons, thus providing an additional mechanism of thalamocortical reliability.
Thalamorecipient neurons have complex dendritic trees composed of many dendrites with thousands of dendritic spines that are the sites of synaptic inputs. Dendritic branches extend hundreds of micrometers from the soma, and, according to cable theory (Rall, 1967), if not compensated (Magee and Cook, 2000; Nicholson et al., 2006), distal inputs may have less influence than proximal inputs over soma depolarization and eventually over action potential generation (Spruston et al., 1993; Stuart and Spruston, 1998; Williams and Stuart, 2002; Nevian et al., 2007). Moreover, even at the same distance from the soma, synaptic activation of morphologically diverse spines may produce different postsynaptic responses (Matsuzaki et al., 2001; Noguchi et al., 2005). Therefore, reliability of detection of sensory information by thalamorecipient neurons may be the outcome of the pattern of numerous inputs converging on dendritic trees of these neurons. To reveal this connectivity pattern, one must explore the spatial distributions of active Th and IC inputs on the dendritic branches of thalamorecipient neurons.
Previous works have established the general rules of connectivity between brain areas and groups of neurons in the auditory system (Read et al., 2002; Winer et al., 2005; Lee and Winer, 2008a,b,c). However, more precise patterns of connectivity, specifically the subcellular distributions of active synaptic connections converging on single neurons, are unknown. Attempts to solve this problem have relied mostly on neuroanatomical methods that detect putative synapses (Ahmed et al., 1994; Anderson et al., 1994). However, the proximity between axon terminal and dendritic spine does not guarantee that a site is an active, functional synapse (Stepanyants and Chklovskii, 2005). To localize active synapses, we used two-photon calcium imaging in individual synaptically responsive dendritic spines. Locations of all identified inputs were compiled to construct maps of active Th and IC inputs on dendritic trees of excitatory thalamorecipient neurons in the mouse auditory cortex (ACx). These composite maps revealed that Th inputs occupy select locations and dendritic spine types on dendrites of thalamorecipient neurons. Two-photon photolysis of caged glutamate (two-photon glutamate uncaging) at these sites revealed that these two factors, spine proximity to the soma and morphology of dendritic spines, contribute to the reliability of thalamocortical projections.
Materials and Methods
Animals.
Young adult male C57BL/6J mice (3–4 weeks old; The Jackson Laboratory) were used in all of the experiments. The care and use of animals were reviewed and approved by the Institutional Animal Care and Use Committee of St. Jude Children's Research Hospital. The mice did not possess any deficit in detecting acoustic information; the auditory-evoked brainstem responses seen in C57BL/6J mice were indistinguishable from those observed in CBA/J mice (supplemental Fig. S1, available at www.jneurosci.org as supplemental material).
Brain slice preparation.
Acute thalamocortical slices (400 μm) containing the ACx and the portions of the ventral part of the medial geniculate nuclei (MGv) of the thalamus were prepared as described previously (Cruikshank et al., 2002). In some experiments, horizontal or coronal slices containing the ACx were prepared. Briefly, mouse brains were quickly removed and placed in cold (4°C) dissecting artificial CSF (ACSF) containing 125 mm choline-Cl, 2.5 mm KCl, 0.4 mm CaCl2, 6 mm MgCl2, 1.25 mm NaH2PO4, 26 mm NaHCO3, and 20 mm glucose (285–295 mOsm), with 95% O2/5% CO2. Primary thalamocortical slices were obtained from the left hemisphere using a diagonal cut at 15°, as described previously (Cruikshank et al., 2002). Primary slices were distinguished from shell slices by visual inspection during the slicing procedure (Verbny et al., 2006). In primary slices, the hippocampus was elongated rostrocaudally, the fimbria/fornix was present, and the lateral geniculate nucleus and MGv were clearly visible. After a 1 h incubation in recording ACSF [125 mm NaCl, 2.5 mm KCl, 2 mm CaCl2, 2 mm MgCl2, 1.25 mm NaH2PO4, 26 mm NaHCO3, and 10 mm glucose (285–295 mOsm), with 95% O2/5% CO2] at room temperature, the slices were transferred into the recording chamber and superfused (2–3 ml/min) with warm (30–32°C) low Mg2+ (0.2 mm MgCl2) ACSF containing 2–3 μm 2,3-dihydroxy-6-nitro-7-sulfonyl-benzo[f]quinoxaline (NBQX). In two-photon glutamate uncaging experiments (except in Fig. 2), NBQX was omitted and 1 mm MgCl2 was used.
Figure 2.
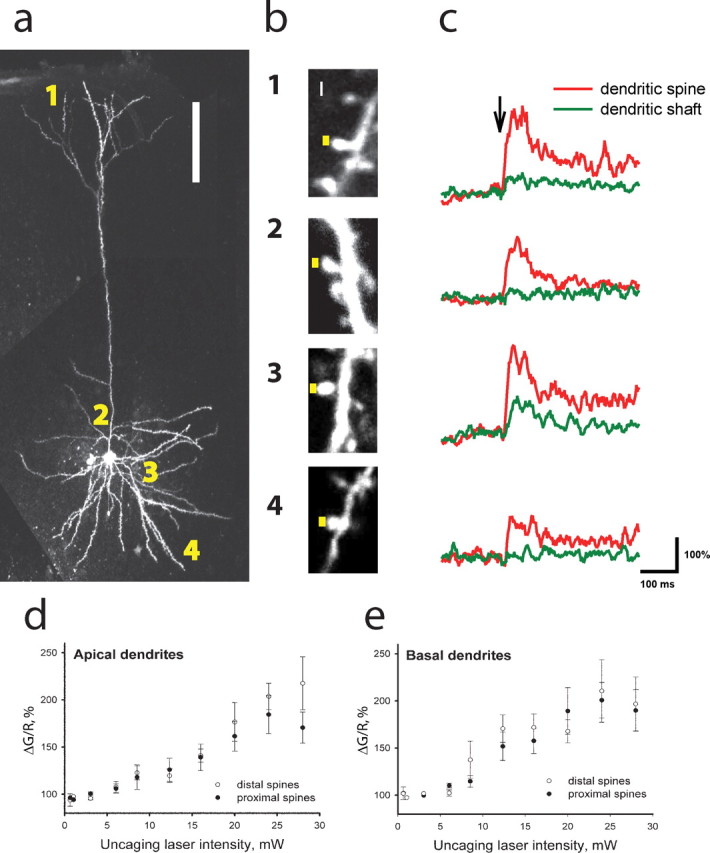
Glutamate uncaging reveals similar glutamate sensitivity of calcium transients in proximal and distal dendritic spines on thalamorecipient neurons in the ACx. a, The image of a thalamorecipient neuron filled with Fluo-5F and Alexa 594. Glutamate uncaging targeted dendritic spines in four different locations: (1) distal apical, (2) proximal apical, (3) proximal basal, and (4) distal basal. Scale bar, 100 μm. b, Representative images of dendritic spines in the four different locations. Yellow squares represent the sites of glutamate uncaging (0.5 ms exposure). Scale bar, 0.5 μm. c, Fluo-5F fluorescence intensity measured in dendritic spines (red) and parent dendritic shafts (green) from b in response to a single pulse of glutamate uncaging (arrow). d, e, Mean ± SEM peak Fluo-5F fluorescence (ΔG/R) intensity as a function of uncaging laser intensity measured in distal (open circles; n = 14 and 11) and proximal (filled circles; n = 12 and 17) dendritic spines of apical (d) and basal (e) dendrites, respectively.
Whole-cell electrophysiology.
Whole-cell recordings were obtained from cell bodies of layer 3 (L3) and L4 thalamorecipient neurons. These neurons were chosen within the first 40–60% of the slice from the pial surface and were visualized using laser-scanning Dodt contrast imaging (Dodt et al., 2002; Yasuda et al., 2004). Patch pipettes (open pipette resistance, 3–5 MΩ) were filled with an internal solution containing 140 mm KMeSO4, 8 mm NaCl, 1 mm MgCl2, 10 mm HEPES, 5 mm MgATP, 0.4 mm Na2GTP, 5 mm QX-314, 300 μm Fluo-5F, and 10–25 μm Alexa 594, pH 7.3. In some experiments, the low-affinity calcium indicator Fluo-5F was replaced with a high-affinity calcium indicator Oregon Green BAPTA-1 (200–600 μm), but no difference in detection of synaptically connected dendritic spines was observed.
Current-clamp recordings were made using a Multiclamp 700B (Molecular Devices), digitized (10 kHz; DigiData 1322A; Molecular Devices), and recorded using pClamp 9.0 software (Molecular Devices). Tungsten bipolar electrodes (FHC) were used to stimulate Th and IC afferents. Th afferents were activated via a stimulating electrode placed either in the superior Th radiation, midway between the MGv and the ACx (rostral to the hippocampus) or immediately near the MGv (Fig. 1 a). IC afferents were activated via stimulating electrodes placed in different cortical layers. Stimulating electrodes used for IC stimulation were located 200–300 μm lateral to the recording electrode (see Fig. 4 a1–c1). Stimulation intensities (100–300 μA) were adjusted in every experiment to elicit 50% of the maximal EPSP. In some experiments in Figure 1, stimulation intensities were adjusted to elicit near-maximal EPSP (data not shown).
Figure 1.
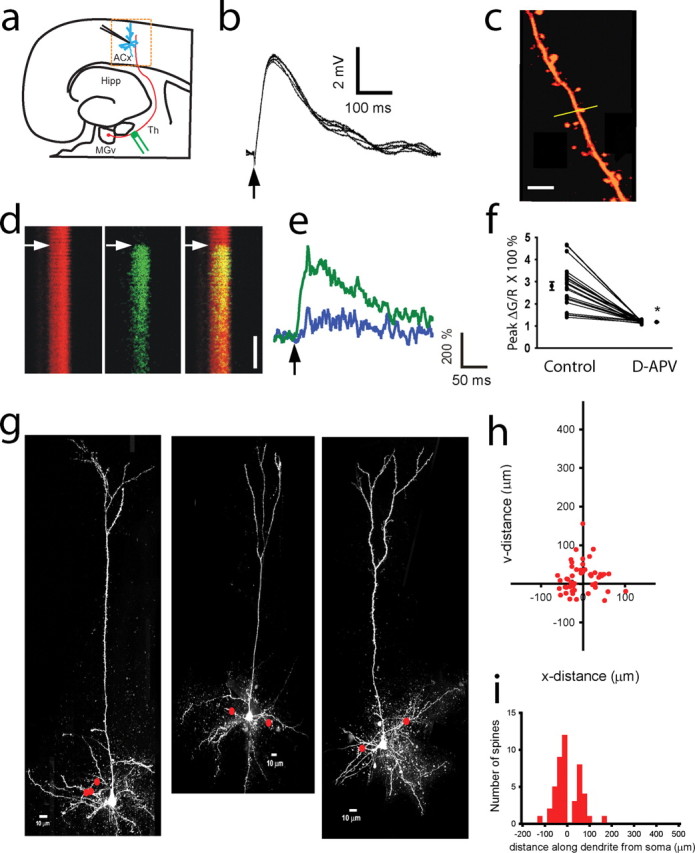
Maps of active thalamocortical inputs on dendritic trees of thalamorecipient pyramidal neurons. a, Diagram of a thalamocortical slice containing parts of the MGv and the ACx. Thalamorecipient pyramidal neurons (blue) are recorded in the ACx. Th afferents (red lines) are stimulated using stimulating electrodes (green). Hipp, Hippocampus. b, Monosynaptic EPSPs recorded in a thalamorecipient neuron in response to a single Th stimulation (arrow). Average EPSP onset latency was 4.2 ± 0.80 ms (mean ± SD), analyzed for 150 representative EPSPs. c, Image of part of a dendritic tree. Line scans (yellow line) are performed across a dendritic spine and parent dendritic shaft. Scale bar, 3 μm. d, Line scans of Alexa 594 (red), Fluo-5F (green), and their overlay (right) in a dendritic spine and shaft in response to a single Th stimulation (arrows). Scale bar, 100 ms. e, Changes in Fluo-5F fluorescent intensity in a dendritic spine (green) and in the parent dendritic shaft (blue) over time in response to a single synaptic stimulation (arrow). f, d-APV (50 μm) eliminates calcium transients in dendritic spines (*p < 0.01, paired t test; n = 24). Filled circles represent mean peak Ca2+ signal (averaged from 5–10 Ca2+ transients) before (control) and after application of 50 μm d-APV. Also shown are means ± SEM calculated from all 24 experiments. g, Alexa 594 reconstructions of three thalamorecipient neurons in the ACx indicating sites where active spines were detected (red dots). h, Composite map of all active Th inputs (n = 46) detected from 31 thalamorecipient pyramidal neurons. Cartesian coordinates represent the placement of Th inputs on a dendritic tree, in which the coordinates of the soma are 0,0. Note that Cartesian coordinates of basal dendritic spines may be in the positive or negative direction on either of the axes, depending on their orientation to the cell soma (as in g). i, Frequency histogram of the distance of all active Th inputs measured along dendrites from the cell soma of thalamorecipient pyramidal neurons. Negative values denote basal dendrites, and positive values denote apical and oblique dendrites.
Figure 4.
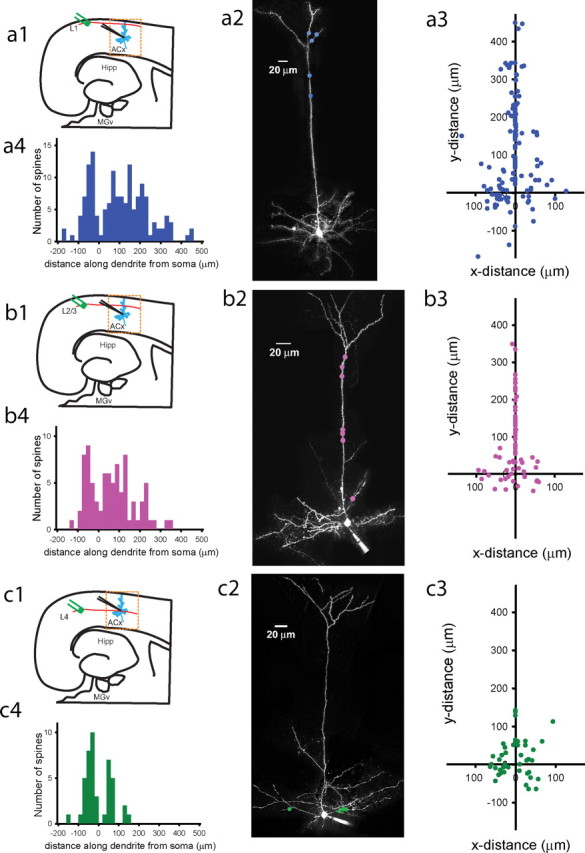
Maps of active intracortical inputs on dendritic trees of thalamorecipient pyramidal neurons found in response to L1, L2/3, or L4 stimulation. a1, b1, c1, Diagrams of a thalamocortical slice showing the site of L1 (a1), L2/3 (b1), and L4 (c1) stimulation relative to the recorded thalamorecipient neuron (blue). a2, b2, c2, Examples of Alexa 594 reconstructions of pyramidal thalamorecipient neurons showing locations (colored dots) in which active spines were detected in response to L1 (a2), L2/3 (b2), and L4 (c2) stimulation. a3, b3, c3, Cartesian coordinates represent the placement of L1-connected (a3; n = 145), L2/3-connected (b3; n = 83), and L4-connected (c3; n = 44) inputs along the dendritic trees, in which the coordinates of the soma are 0,0. a4, b4, c4, Frequency histograms of distances of active L1 (a4), L2/3 (b4), and L4 (c4) inputs measured along dendrites from the cell soma of thalamorecipient pyramidal neurons. Negative values denote basal dendrites, and positive values denote apical and oblique dendrites. Hipp, Hippocampus.
Two-photon imaging.
Two-photon laser scanning microscopy (TPLSM) was performed using an Ultima imaging system (Prairie Technologies), a titanium:sapphire Chameleon Ultra femtosecond-pulsed laser (Coherent), and 60× [0.9 numerical aperture (NA)] or 20× (0.95 NA) water-immersion infrared objectives (Olympus). Alexa Fluor 594 and Fluo-5F were included in the internal solution (see above) and were excited at 820 nm. Synaptically evoked changes in fluorescence of both fluorophores were measured in line-scan mode (500 Hz) in spine heads and the parent dendritic shaft. Line scans were analyzed as changes in green (G) (Fluo-5F) fluorescence normalized to red (R) (Alexa Fluor 594) fluorescence (ΔG/R) as described previously (Sabatini et al., 2002). A line-scan was performed through every visible dendritic spine on a targeted dendritic branch in an orientation that was parallel to the dendritic spine neck and orthogonal to the dendritic shaft. In addition, line scans were performed through a long axis of dendritic branches to detect nonspiny synapses (White et al., 1980). A similar method was used previously to effectively detect excitatory synapses on aspiny neurons (Goldberg et al., 2003). The threshold for detection of [Ca2+] transients was set individually for each spine in a plot of all individual trials (10–20 stimulations delivered at 0.1–0.2 Hz). Only dendritic spines that showed a clear separation between failures and successes (supplemental Fig. S2a, available at www.jneurosci.org as supplemental material) were included in the analysis. The P ca was measured as a ratio of detected calcium transients (successes) to the total number of stimulations.
At the end of every experiment, the detailed morphology of the dendritic tree of a recorded neuron was reconstructed using Alexa 594 fluorescence. The upper surface of the slice was identified as a transition point between the slice autofluorescent signal and the lack of the fluorescent signal of ACSF. Distances between the slice surface and a recorded neuron were calculated using a digital micrometer (Prairie Technologies). Only neurons with apical dendrites approximately parallel to the surface of the slice were analyzed. Neurons with branches approaching the slice surface or that showed any sign of dissection artifacts were excluded from analysis.
Dendritic spines were identified as protrusions emanating from a dendritic shaft. Spines with distinct heads were classified as “mushroom.” These spines have a spine head diameter larger than the diameter of the neck. Spines without distinct heads were classified as “stubby” (supplemental Fig. S3, available at www.jneurosci.org as supplemental material). Protrusions without a distinct head that were thinner than 0.3 μm and longer than 2 μm were classified as “filopodia.” Dendritic spines longer than their maximal width were classified as “long,” and other spines were “classified as ”short.“ Dendritic branches emanating from the soma were classified as first-order dendrites; these include apical dendrites and major basal dendrites. Dendritic branches originating from the first-order dendrites were classified as second-order dendrites; these include major oblique dendrites, secondary basal dendrites, and major apical tuft branches emerging from the apical dendrite. Dendritic branches originating from the second-order dendrites were classified as third-order dendrites. The point-spread function of the focal volume of two-photon excitation was 300 nm laterally and 1100 nm axially (NA 0.9) based on images of 100 nm fluorescent beads.
Two-photon glutamate uncaging.
4-Methoxy-7-nitroindolinyl-caged l-glutamate (MNI-glutamate) (2.5–5 mm; Tocris Bioscience) was added to the recording ACSF. MNI-glutamate was uncaged using TriggerSync (Prairie Technologies), and 0.2–0.5 ms pulses were delivered from a second titanium:sapphire Chameleon Ultra femtosecond-pulsed laser at 720 nm. The intensity and duration of the uncaging laser was adjusted to mimic miniature spontaneous EPSPs (mEPSPs) (see Fig. 6 b). In all experiments, before each uncaging pulse, an image of the spine was acquired and automatically aligned with a reference image of the spine. The uncaging laser intensity was normalized to the same degree of Alexa 594 bleaching using the previously described method to deliver the same photostimulation power to individual dendritic spines, independent of the depth of the spine in the slice or the refraction index of local tissue (Bloodgood and Sabatini, 2005).
Figure 6.

Focal glutamate uncaging at individual dendritic spines evokes uEPSPs that attenuate with distance from the soma. a, Alexa 594 reconstruction of a part of a pyramidal thalamorecipient neuron showing three sites of two-photon glutamate uncaging (arrows). b, The top shows mEPSPs recorded in a thalamorecipient pyramidal neuron (black trace) and an example of a uEPSP (blue trace) in response to a single pulse of glutamate uncaging in the same neuron. The bottom shows the same uEPSP (blue trace) superimposed against the averaged mEPSP (black trace) from the same neuron. Miniature EPSPs (amplitude, 0.44 ± 0.15 mV; 20–80% rise time, 9.8 ± 3.5 ms; 80–20% decay time, 24.0 ± 15.7 ms) were not significantly different from uEPSPs evoked on the secondary dendrites (amplitude, 0.45 ± 0.12 mV; 20–80% rise time, 8.9 ± 6.9 ms; 80–20% decay time, 22.8 ± 8.3 ms; n = 51; p > 0.05, Mann–Whitney U test). c, Representative traces of uEPSPs (top black traces) evoked by two-photon uncaging (arrow) measured at the soma and calcium transients (middle blue traces) and Alexa 594 bleaching (red traces) measured in a dendritic spine of the same neuron. d, Peak uEPSPs as a function of distance generated at mushroom spines along basal and apical dendrites of thalamorecipient neurons. Each data point is an average of 5–16 uEPSPs; length constants were calculated from raw data (n = 168 uEPSPs generated along basal dendrites at a total of 17 sites in 7 neurons; n = 162 uEPSPs generated along apical dendrites at a total of 17 sites in 8 neurons).
Once the duration and laser power were adjusted to achieve a 0.4 mV EPSP recorded in the soma (except in Fig. 2), we delivered six to nine test pulses around the perimeter of a spine head to determine the optimal site (determined as the maximal response) of uncaging. Another test pulse to the center of the spine head determined the level of Alexa 594 bleaching. We then uncaged MNI-glutamate at the optimal site. The level of Alexa 594 bleaching was used to adjust the laser power (but not duration) to other dendritic spines of the same neuron.
All drugs were purchased from Sigma-Aldrich except NBQX, d-APV, and picrotoxin, which were purchased from Tocris Cookson. All data are represented as mean ± SEM, unless otherwise noted. All statistics were computed using Sigma Plot and Sigma Stat (Systat Software).
Results
Thalamic inputs form active synapses on basal, apical, and oblique dendrites of thalamorecipient neurons within 100 μm of the soma
To map the active Th and IC inputs, we performed whole-cell recordings from excitatory neurons in the middle cortical layers (L3/4, which are the major input layers of mouse primary ACx) in mouse acute thalamocortical slices. These brain slices contain the ACx and portions of the ventral part of the MGv (Cruikshank et al., 2002). Electrical stimulation of Th projections (Fig. 1 a) evoked monosynaptic EPSPs (Fig. 1 b), indicating that recorded neurons are thalamorecipient neurons. In every experiment, we filled recorded neurons with the cytoplasmic dye Alexa 594 and the calcium indicator Fluo 5F (Oertner et al., 2002) and used two-photon optical imaging (Denk et al., 1990) to visualize detailed dendritic morphology (Fig. 1 c) and synaptically evoked calcium transients (Fig. 1 d,e), respectively. Based on Alexa 594 fluorescence, the majority of recorded thalamorecipient neurons (320 of 325) in the mouse ACx were spiny pyramidal neurons with apical trunks that extended toward the pial surface; the remainder (5 of 325) were stellate neurons that lacked a defined apical dendrite. The abundance of pyramidal neurons and sparsity of stellate neurons were consistent with previously reported data (McMullen and Glaser, 1982; Fitzpatrick and Henson, 1994; Smith and Populin, 2001; Rose and Metherate, 2005) and are recognized as hallmarks of the thalamorecipient layers in the ACx of different species (Lund, 1973; Feldman and Peters, 1978; Smith and Populin, 2001). Golgi staining confirmed that spiny pyramidal neurons comprised the majority of stained cells (65.3%, 282 of 432) in the middle layers of the ACx (supplemental Fig. S4, available at www.jneurosci.org as supplemental material).
Using the line-scan mode of TPLSM in pyramidal thalamorecipient neurons (Fig. 1 c), we systematically looked for monosynaptically connected dendritic spines that responded to synaptic stimulation with increased Fluo 5F fluorescence (Fig. 1 d). These experiments were conducted in current-clamp mode, in the presence of a low concentration of magnesium (0.2 mm) to relieve the magnesium block from NMDA channels throughout the dendritic tree and therefore facilitate calcium influx through NMDA channels. The AMPA receptor (AMPAR) blocker NBQX was added to the bath solution to ensure the monosynaptic nature of synaptic transmission.
The search for monosynaptically connected active synapses was systematically conducted in all dendritic spines on targeted dendritic branches of thalamorecipient neurons. In a single experiment, we scanned through hundreds of dendritic spines on a few (no more than six) but not all dendritic branches because of the relatively short lifetime (1–2 h) of whole-cell recording. In different experiments, we alternated our search between basal, apical, and apical-oblique (oblique) dendritic branches to avoid bias toward one type of dendrite. During initial screening, we measured calcium responses at dendritic spines in response to a train of high-frequency stimulation (five pulses at 10 Hz). Scanning with high-frequency trains was done to ensure the detection of all active Th inputs, including those that did not respond to low-frequency stimuli, presumably attributable to a low probability of neurotransmitter release at a given synapse. Dendritic spines that responded with calcium transients to high-frequency stimulation were identified as putative sites of active inputs. Once these spines were identified, we delivered several (10–20) single synaptic stimuli at low frequency (0.1 Hz) to ensure the monosynaptic nature of calcium influx into the spine (Fig. 1 d). During low-frequency stimulation, dendritic spines responded in an all-or-none manner, presumably reflecting probabilistic nature of synaptic vesicle release from a cognate presynaptic terminal (supplemental Fig. S2a, available at www.jneurosci.org as supplemental material). Based on low-frequency stimulation, dendritic spines were scored as monosynaptically connected and considered sites of active synaptic inputs if calcium transients were time locked to a single synaptic stimulation, i.e., if they had short onset latencies (no more than 5 ms) (supplemental Fig S2c, available at www.jneurosci.org as supplemental material) (mean ± SD onset latency was 1.3 ± 1.8 ms; n = 67) and were substantially stronger than calcium transients in the parent dendritic shaft, indicating that the calcium transient originated in the spine (Fig. 1 e). Both EPSPs and calcium transients evoked in response to Th stimulation showed low onset latency variability (jitter), an additional indicator of monosynaptic inputs (Fig. 1 b) (supplemental Fig. S2a, available at www.jneurosci.org as supplemental material). Thus, the mean ± SD EPSP jitter was 0.41 ± 0.13 ms, and the mean ± SD calcium transient jitter was 1.1 ± 0.9 ms (analyzed for 11 representative neurons for both values). Calcium transients in these dendritic spines were mediated mostly by NMDA channels, because they were blocked by the NMDA channel antagonist d-APV (50 μm) (Fig. 1 f).
To map the active Th inputs onto the dendritic trees of thalamorecipient pyramidal neurons, we combined the partial maps of 31 neurons (Fig. 1 g). The composite map (Fig. 1 h) revealed that Th-connected dendritic spines are found on all types of dendrites: 63% were on basal dendrites, 9%, on the apical shaft, and 28% on oblique dendrites (46 spines) (supplemental Fig. S5a, available at www.jneurosci.org as supplemental material). We found that the vast majority (96%, or 44 of 46) of Th-connected dendritic spines were found within 100 μm of the soma (perisomatic area) (Fig. 1 h,i).
To ensure that the perisomatic localization of Th-connected dendritic spines was not caused by the slice preparation or our experimental approach, we (1) searched for active synapses specifically in distal parts of dendritic tree (>250 μm from the soma) (27 neurons), (2) examined Th-connected spines in thicker (600 μm) thalamocortical slices (11 neurons), and (3) recorded neurons at different depths (50–200 μm) from the slice surface. In addition, in some experiments (10 neurons), we replaced Fluo-5F with the higher-affinity indicator Oregon Green BAPTA-1. We also tested the possibility of GABA-mediated inhibition of Th-connected spines and searched active synapses in the presence of picrotoxin (100 μm) (12 neurons). All of these approaches confirmed that Th-connected spines were invariably found only within the perisomatic area of the thalamorecipient neurons.
The failure to detect Th-connected dendritic spines on distal parts of thalamorecipient neurons could have resulted from a low concentration of the calcium indicator or fewer NMDA receptors on distal dendritic spines. To rule out both of these possibilities, we compared the sensitivities of proximal and distal dendritic spines with glutamate. Using two-photon glutamate uncaging (Pettit et al., 1997; Matsuzaki et al., 2001), we focally released glutamate at individual dendritic spines located either proximally (<100 μm) or distally (175–400 μm) from the soma on basal and apical dendrites (Fig. 2 a). We detected calcium transients in response to glutamate uncaging at both proximal and distal dendritic spines of both types of dendrites (Fig. 2 b,c), demonstrating that active synapses can be detected at distal dendritic spines. Moreover, the sensitivities of the calcium influx to glutamate were similar in the proximal and distal dendritic spines. Input–output curves of the calcium transient peak amplitude as a function of uncaging laser intensity were similar in dendritic spines located in proximal and distal locations of both apical and basal parts of the dendritic tree of thalamorecipient neurons (Fig. 2 d,e). Together these results indicated that Th inputs predominantly target dendritic spines that are located within 100 μm of the soma of thalamorecipient neurons.
Intracortical inputs form active synapses throughout the dendritic tree of thalamorecipient neurons
If Th inputs synapse only on dendritic spines within a perisomatic area, where do IC inputs synapse? We searched for synaptically connected dendritic spines that responded with calcium transients to IC stimulation in the ACx. We placed the stimulating electrode ∼200 μm laterally from the recorded neurons to avoid stimulating Th inputs. In different sets of experiments, we placed a stimulating electrode at different distances from the pial surface that approximately corresponded to cortical L1, L2/3, or L4 (Fig. 3 a). In addition, we performed similar experiments in slices made in different orientations to ensure that neither rostrocaudal (thalamocortical or horizontal slices) nor dorsoventral (coronal slices) projections were more favored. In all of these experiments, IC stimulation evoked monosynaptic EPSPs in thalamorecipient neurons (mean ± SD onset latency was 5.0 ± 1.3 ms; mean ± SD jitter was 0.37 ± 0.17 ms, analyzed for 17 representative neurons; n = 215) (Fig. 3 b). Using the same approach as in the case of Th inputs, we searched for IC inputs based on calcium transients evoked by low-frequency synaptic stimulation. Calcium transients in IC-connected dendritic spines were evoked with a short onset latency (0.7 ± 1.3 ms, mean ± SD; n = 293) and showed a little jitter (0.7 ± 0.7 ms, mean + SD; calculated from 17 representative neurons) (supplemental Fig. S2d, available at www.jneurosci.org as supplemental material), suggesting a monosynaptic nature of synaptic transmission in these spines. The lack of paired-pulse potentiation or depression between Th and IC inputs (performed in thalamocortical slices only) indicated that IC stimulation did not activate Th axons (data not shown).
Figure 3.
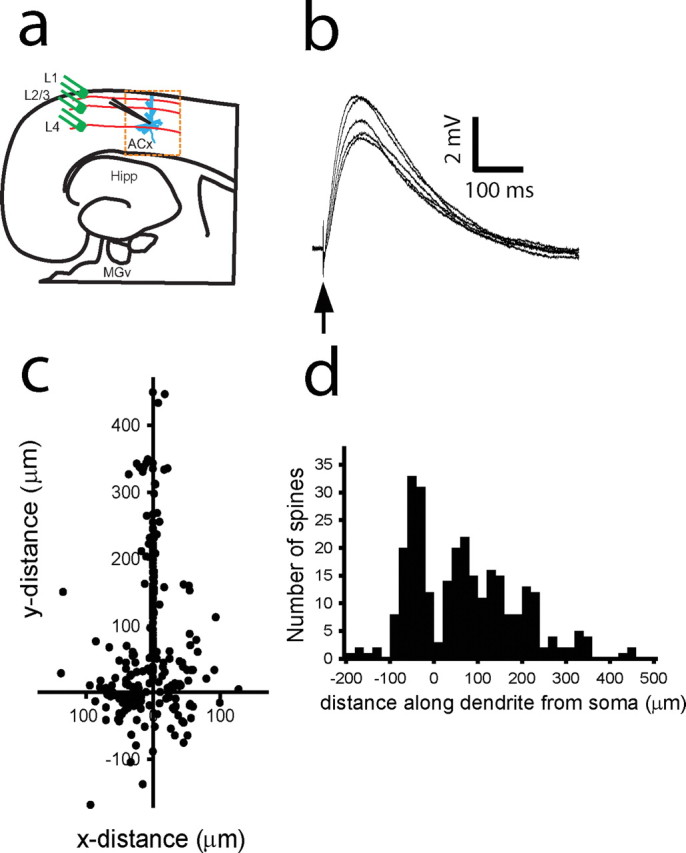
Map of active intracortical inputs on a dendritic tree of a thalamorecipient pyramidal neuron. a, Diagram of a thalamocortical slice containing parts of the MGv and ACx. Thalamorecipient pyramidal neurons (blue) are recorded in the ACx. Th afferents (red lines) are stimulated using stimulating electrodes (green). Hipp, Hippocampus. b, Monosynaptic EPSPs recorded in a thalamorecipient neuron in response to single cortical stimulation (arrow). c, Composite map of all active IC inputs (n = 272) detected from 87 thalamorecipient pyramidal neurons. Cartesian coordinates represent the sites of IC inputs on the dendritic tree, in which the coordinates of the soma are 0,0. Note that Cartesian coordinates of basal dendritic spines may be either in the positive or negative direction, depending on their orientation to the cell soma. d, Frequency histogram of the distance of all active IC inputs measured along the dendrites from the cell soma of thalamorecipient pyramidal neurons. Negative values denote basal dendrites, and positive values denote apical and oblique dendrites.
Using combined data from all of these experiments, we constructed a composite map of active IC inputs (87 neurons, 272 spines) on a dendritic tree of thalamorecipient excitatory neurons (Fig. 3 c). IC-connected dendritic spines were found on all types of dendrites (supplemental Fig. S5b, available at www.jneurosci.org as supplemental material). In contrast to Th-connected dendritic spines, IC-connected spines were found at various distances from the soma, inside and outside the perisomatic area occupied by Th-connected dendritic spines (Fig. 3 c,d). On average, IC-connected spines were found 110.0 ± 5.3 μm (range, 8–444 μm; n = 272), whereas Th-connected spines were located 49.4 ± 4.2 μm (range, 15–152 μm; n = 46; p < 0.001; U = 9181, Mann–Whitney U test) from the soma.
Thalamorecipient neurons receive IC inputs from within the ACx and other parts of the cortex (Lee and Winer, 2008c), and combined IC inputs appeared to occupy the entire dendritic tree of thalamorecipient neurons. Thus, we questioned whether different IC inputs occupy different parts of the dendritic tree and by summation occupy the entire dendritic tree, or whether they are all widely distributed. To distinguish between these two possibilities, we separately mapped the active dendritic spines that responded to stimulation of areas L1, L2/3, or L4 (Fig. 4). Because electrical stimulation may cover more than one cortical layer and axons stimulated in a given area do not necessarily originate there, the stimulated cortical areas in our experiments technically did not represent anatomical cortical layers. Nevertheless, we found that stimulation of different cortical areas activated different subsets of dendritic spines on thalamorecipient neurons, indicating a certain degree of selectivity among IC inputs converging on thalamorecipient neurons.
We found that L1- and L2/3-connected spines were widely distributed on dendritic trees, whereas L4-connected spines we predominantly found in the perisomatic area (Fig. 4). The average distance from the soma for L1-connected spines was 132.5 ± 8.41 μm (range, 15–444 μm; n = 145) from the soma and that for L2/3-connected spines was 99.1 ± 8.24 μm (range, 8–340 μm; n = 83; p > 0.05, Kruskal–Wallis ANOVA, Dunn's test). L1- and L2/3-connected spines were equally distributed on basal (30 vs 34%), apical (48 vs 48%), and oblique (22 vs 18%) dendrites (supplemental Fig. S5b1,b2, available at www.jneurosci.org as supplemental material). In contrast, L4-connected spines were located closer to the soma than L1- and L2/3-connected spines (p < 0.05, Kruskal–Wallis ANOVA, Dunn's test). Similar to Th-connected spines (p > 0.05, Kruskal–Wallis ANOVA, Dunn's test), L4-connected spines were preferentially found in a perisomatic area (56.7 ± 4.71 μm; range, 11–150 μm; n = 44) and similarly distributed on different types of dendrites (supplemental Fig. S5b3, available at www.jneurosci.org as supplemental material).
Overall, these data show that IC inputs can be found throughout the dendritic tree of thalamorecipient neurons. IC axons that project from ACx supragranular layers L1 and L2/3 form active synapses in a nonselective manner, targeting a substantially wider area of the dendritic tree of thalamorecipient neurons compared with those of Th-connected synapses. In contrast, axons that pass through the granular cortical layer (L4) create active inputs in a more restrictive manner similar to that of Th-connected inputs. Given that thalamorecipient neurons located in L4 are highly interconnected in sensory cortices (Lübke et al., 2000; Barbour and Callaway, 2008), overlapping of maps of Th-connected and L4-connected inputs on thalamorecipient neurons may represent the anatomical substrate for amplification of sparse Th synapses in the thalamocortical systems (Bannister, 2005).
Thalamic and intracortical inputs target morphologically different types of dendritic spines
Do Th and IC inputs target different types of dendritic spines? To address this question, we analyzed the morphology of Th- and IC-connected dendritic spines (Fig. 5) (n = 37 and 272, respectively). Spines on dendritic trees of thalamorecipient pyramidal neurons were classified as mushroom spines, stubby spines, and filopodia (Fig. 5 a). Mushroom and stubby spines (supplemental Fig. S3, available at www.jneurosci.org as supplemental material) were similarly distributed on basal dendrites (p > 0.05, Mann–Whitney U test; 119 and 104 spines, respectively,). However, significantly more mushroom spines than stubby spines were found on apical and oblique dendrites (p < 0.001, Mann–Whitney U test; 189 and 47 spines, respectively) (supplemental Fig. S6, available at www.jneurosci.org as supplemental material).
Figure 5.
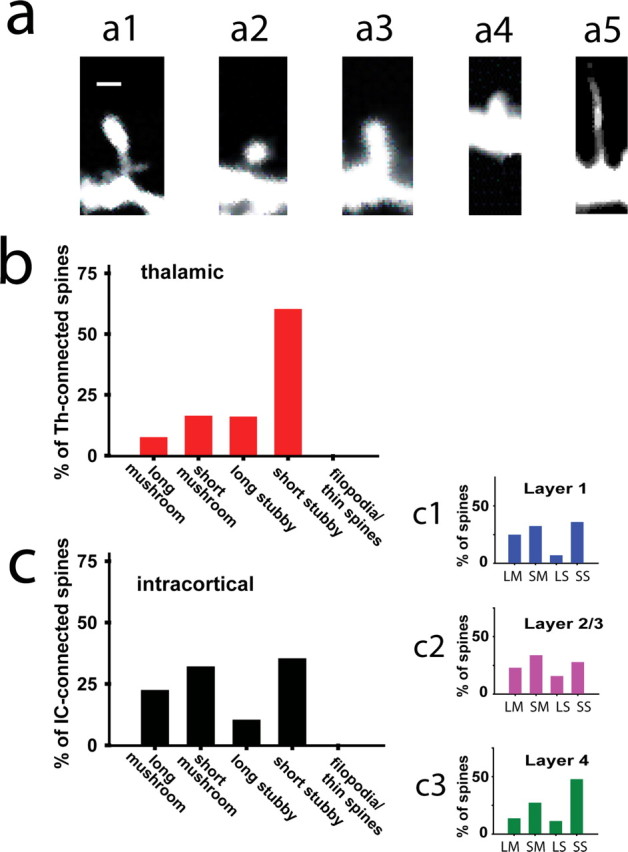
Thalamic inputs but not intracortical inputs specifically synapse on stubby dendritic spines. a, Morphological types of dendritic spines found on thalamorecipient pyramidal neurons are classified as follows: a1, long mushroom; a2, short mushroom; a3, long stubby; a4, short stubby; and a5, filopodia. Scale bar, 0.5 μm. b, c, Frequency histograms showing the percentage of thalamic (b; n = 37), intracortical (c; n = 272), L1 (c1; n = 145), L2/3 (c2; n = 83), and L4 (c3; n = 44) inputs synapsing on the five morphological types of dendritic spines.
Th and IC inputs formed active synapses on both stubby and mushroom dendritic spines but not on filopodia (Fig. 5 b,c). Interestingly, short stubby spines were the preferred site for Th inputs (Fig. 5 b), whereas IC inputs were distributed more equally among different spine types and lengths (Fig. 5 c). Although we distinguished between long and short spines, the observed length of a dendritic spine may not reflect its actual length but rather a nonparallel orientation of a spine toward an imaging plane. Assuming that the orientation of dendritic spines is uniform in all directions, we would expect that Th inputs equally target short and long stubby spines. However, the strong preference of Th inputs to synapse on short stubby spines indicated certain specificity. This selectivity suggests two possibilities: either Th-connected stubby spines are indeed short or Th-connected stubby spines are oriented at a certain angle toward the imaging plane. Given that our optical methods cannot distinguish between these possibilities, the only distinction we made in additional experiments was between mushroom and stubby dendritic spines. Th-connected spines were preferentially stubby (75.6% of 37 spines), whereas IC inputs showed no preference toward stubby spines (47.1% of 272 spines).
We next compared whether spine-type selectivity is preserved in a perisomatic area in which Th and IC inputs overlap. Almost all (96%, 35 of 37) of Th inputs and 60% (163 of 272) of IC inputs were found within 100 μm of the soma. Of these perisomatic synapses, 80% (28 of 35) of Th inputs preferentially targeted stubby spines, whereas IC inputs showed no preference toward stubby spines (48% of 163 spines). These data show selectivity of Th but not IC inputs toward stubby spines.
Interestingly, peak amplitudes of calcium transients evoked in Th- and IC-connected dendritic spines were similar. Thus, during synaptic stimulation, Fluo-5F fluorescence increased by 175.6 ± 17.2% (n = 35), 151.2 ± 7.3% (n = 128), 143.1 ± 7.9% (n = 86), and 162.0 ± 10.8% (n = 53; p > 0.05, Kruskal–Wallis one-way ANOVA on ranks) in Th-, L1-, L2/3-, and L4-connected spines, respectively. Similarly, peak amplitudes of calcium transients did not depend on morphology of dendritic spines (data not shown). These data suggested that Th and IC inputs do not differ in their abilities to release neurotransmitter. To test this hypothesis further, we measured the probability of calcium transients (P Ca) in Th- and IC-connected dendritic spines (supplemental Fig. S7, available at www.jneurosci.org as supplemental material). Previous studies indicated that P Ca is a measure of neurotransmitter release (determined by the probability of neurotransmitter release at each release site and the number of functional release sites) (Yuste and Denk, 1995; Yuste et al., 1999; Emptage et al., 2003). The P Ca was measured as the ratio of calcium transient occurrences to the total number of stimuli delivered during a low-frequency train (supplemental Fig. S7a, available at www.jneurosci.org as supplemental material). Indeed, the adenosine receptor antagonist 1,3-dipropyl-8-(p-sulfophenyl)xanthine (10 μm), which relieves tonic presynaptic inhibition in glutamatergic synapses (Dunwiddie et al., 1981; Bayazitov et al., 2007), substantially increased the P Ca, indicating that P Ca is a reliable indicator of presynaptic function at thalamocortical and IC synapses (supplemental Fig. S7b, available at www.jneurosci.org as supplemental material). We found that the P Ca was not significantly different between Th (0.57 ± 0.05; n = 33) and IC (0.51 ± 0.02; n = 185; p = 0.21, Mann–Whitney U test) inputs, nor was the P Ca dependent on the distance of Th and IC inputs from the soma (supplemental Fig. S7c,d, available at www.jneurosci.org as supplemental material).
Together, these data suggest that individual Th inputs and IC inputs in mouse ACx differ in their locations on the dendritic tree of thalamorecipient neurons and in the type of dendritic spines they target but not in properties of neurotransmitter release at individual synapses.
Activation of proximal or stubby dendritic spines produces larger EPSPs
Our findings indicate that Th inputs predominantly occupy stubby dendritic spines located within 100 μm of the cell body. Does activation of either proximal spines or stubby spines produce a stronger response in thalamorecipient neurons?
First, we quantified the relationship between the distance of a dendritic spine along the dendrite and the somatic EPSP evoked by activation of this spine (Fig. 6). In these experiments, we used NBQX-free external solution to record glutamate uncaging-evoked EPSPs (uEPSPs) in several dendritic spines at various distances from the cell body in either basal or apical dendrites (Fig. 6 a). These experiments were done on mushroom dendritic spines because of their relative abundance on apical dendrites (supplemental Fig. S6, available at www.jneurosci.org as supplemental material). We adjusted the power of the uncaging laser to produce a uEPSP in the most proximal dendritic spine (located <30 μm from the soma) that mimicked mEPSPs (amplitude, 0.44 ± 0.15 mV; n = 859) (Fig. 6 b). Once uEPSPs of ∼0.4 mV were established in a proximal dendritic spine, we measured Alexa 594 bleaching (typically 25–40%) in the spine (Fig. 6 c). Because local laser excitation controls both Alexa 594 bleaching and glutamate uncaging (Bloodgood and Sabatini, 2007), we adjusted the power of the uncaging laser to keep the same level of Alexa 594 bleaching in all targeted dendritic spines in the same experiment, thus delivering the same amount of glutamate to all targeted dendritic spines. Indeed, local calcium transients were similar in targeted dendritic spines (Fig. 6 c). However, uEPSPs recorded in the soma attenuated dramatically when we activated dendritic spines farther from the soma (Fig. 6 c,d).
Overall, we found a similar strong forward attenuation of uEPSP peak amplitudes along basal dendrites (length constant, λ = 44.0 μm; n = 168 uEPSPs measured at 17 spines in 7 neurons) and apical dendrites (λ = 45.7 μm; n = 162 uEPSPs measured at 17 spines in 8 neurons) (Fig. 6 d), indicating that the somata of thalamorecipient neurons are capable of detecting single uEPSPs primarily from inputs located in a perisomatic area that is distributed equally on basal and apical branches. In addition, rise times of uEPSPs increased significantly with distance from the soma on both basal (r 2 = 0.73; n = 14; p < 0.01) and apical (r 2 = 0.53; n = 15; p < 0.01) dendrites (supplemental Fig. S8, available at www.jneurosci.org as supplemental material), consistent with the idea that somatic time course of unitary EPSPs is a predictor of synapse location (Redman and Walmsley, 1983; Magee and Cook, 2000). Similar to our results, strong forward attenuation (λ = 50 μm) of subthreshold EPSPs has been reported in basal dendrites of L5 neocortical rat neurons (Nevian et al., 2007). Previous attempts to estimate forward attenuation in apical dendrites of cortical L5 and hippocampal CA1 neurons by using patch recordings from different dendritic locations revealed substantially weaker attenuation (λ = ∼200–270 μm) (Magee and Cook, 2000; Berger et al., 2001), perhaps reflecting the specialized computational roles played by apical dendrites of different classes of neurons.
These results indicate that the proximity of active dendritic spines to the soma is important for delivering EPSPs from these spines to the soma, and this proximity contributes to the amplitude of these synaptically evoked potentials. Measured length constants of attenuation imply that activation of an individual dendritic spine located farther than 100 μm from the soma (Fig. 6 d) on basal and apical dendrites may have a minor effect on somatic depolarization and, therefore, contribute little to the generation of action potentials. Conversely, activation of a proximal dendritic spine located within 100 μm of the soma will make a greater contribution to depolarization of the cell body and the generation of action potentials. Because nearly all Th inputs were within 100 μm of the soma, we conclude that Th-connected dendritic spines have an advantage over supragranular IC-connected dendritic spines in depolarizing the soma of thalamorecipient neurons.
Because Th inputs favored stubby spines, we next addressed whether the morphology of dendritic spines contributes to the effectiveness of thalamocortical projections. We compared uEPSPs at stubby dendritic spines with those evoked at nearby mushroom spines. Our analysis revealed that Th inputs preferentially target dendritic spines located on second-order dendrites (supplemental Fig. S9, available at www.jneurosci.org as supplemental material). Therefore, we located second-order dendrites within 100 μm of the soma, in which both stubby and mushroom spines were within 10 μm of each other (Fig. 7 a) and then compared uEPSPs evoked by the same amount of glutamate at these two spines. As described previously, we adjusted the power of the uncaging laser to evoke uEPSPs of 0.4 mV to mimic mEPSPs (Fig. 6 b) at the stubby dendritic spine and delivered the same laser power to the neighboring mushroom spine. We found that uncaging glutamate evoked significantly smaller uEPSPs in mushroom spines than in stubby spines (Fig. 7 b,c). On average, uEPSPs in mushroom spines (0.178 ± 0.038 mV) were 52 ± 3.1% the amplitude of uEPSPs recorded from nearby stubby spines (0.349 ± 0.024 mV; 11 spine pairs, 7 neurons; p = 0.013, Mann–Whitney U test). These data show that activation of stubby dendritic spines more effectively depolarizes the soma than activation of mushroom dendritic spines.
Figure 7.

Activation of stubby dendritic spines produces a larger uEPSP in thalamorecipient neurons. a, Image of a second-order dendrite with a short stubby spine and a nearby mushroom spine on which glutamate was uncaged (yellow squares) for 0.2 ms. Scale bar, 1 μm. b, Examples of single uEPSPs evoked by a pulse of glutamate uncaging (arrow) at a short stubby dendritic spine (black) and at the neighboring mushroom (red) dendritic spine in the neuron from a. c, Filled circles represent peak uEPSP amplitudes (averaged from 5–10 uEPSPs) measured at stubby spines and neighboring mushroom spines (11 stubby-mushroom spine pairs from 7 neurons) located on second-order dendrites within 100 μm of the soma. Also shown are the means ± SEM calculated from all experiments. *p < 0.001 (paired t test).
In summary, we presented maps of active Th and IC inputs on dendritic trees of thalamorecipient neurons in the mouse ACx. Th inputs typically synapsed onto short stubby dendritic spines on second-order dendrites located within 100 μm of the soma. We also showed that spine location and morphology influence the strength of somatic EPSPs, providing Th inputs with an advantage over IC inputs. Thus, spine location and morphology may contribute to the effectiveness of thalamocortical pathways in the ACx.
Discussion
Thalamorecipient pyramidal neurons in the ACx are primary cortical recipients of acoustic information from the outside world. These neurons receive inputs from various regions within the cortex and the thalamus. These multiple inputs converge on dendritic trees of thalamorecipient neurons, providing cortical neurons with a plethora of information. IC inputs substantially outnumber Th inputs (Benshalom and White, 1986); therefore, it is clear that Th inputs require certain distinguishing properties that allow them to reliably deliver acoustic information to the cortex. We hypothesized that Th inputs use advantages in location of synaptic connection on dendritic trees of thalamorecipient neurons to achieve effectiveness. To test this hypothesis, we identified the precise locations of active Th and IC inputs on dendrites of these neurons. By imaging calcium signals in single dendritic spines, we ensured that all detected synaptic contacts are functional rather than putative. The locations of all synaptically connected dendritic spines were used to construct composite maps of Th and IC inputs on thalamorecipient pyramidal neurons in the ACx. We also characterized the morphological and functional properties of individual dendritic spines connected to the various inputs.
We presented evidence that Th inputs cluster within a perisomatic area of dendritic trees of thalamorecipient neurons. Specifically, Th-connected synapses are located on all types of dendrites (basal, oblique, and apical) within a 100 μm perimeter of the soma, predominantly on second-order dendrites. In contrast, combined IC inputs were more dispersed and occupied the entire dendritic tree. Thus, our data argue against the assumption that Th and IC inputs are both distributed randomly on dendrites of thalamorecipient neurons. Instead, here we show that Th inputs form synapses in certain locations, whereas IC inputs occupy the entire dendritic tree. Our data confirm the model that was developed for the cat visual cortex and suggest that few Th inputs synapse on proximal dendrites whereas the substantially greater number of IC inputs are broadly distributed on dendrites of thalamorecipient neurons (Ahmed et al., 1994; Anderson et al., 1994; Douglas et al., 1995; Douglas and Martin, 2007).
The proximity to the soma may provide an advantage for Th inputs over IC inputs and facilitate a reliable flow of sensory information to the cortex. The position of synapses on a dendritic tree is an important factor in determining the amplitude and shape of synaptic potentials delivered to the soma (Jack and Redman, 1971). The close proximity of Th inputs to the soma may limit the attenuation of postsynaptic potentials characteristic for distal synapses and attributable to the cable properties of dendrites (Rall, 1967; Williams and Stuart, 2002; Nevian et al., 2007). We also described a broader distribution of IC inputs that was primarily the result of a wide dispersion of inputs responding to stimulation of supragranular L1 and L2/3 layers but not the thalamorecipient layer L4.
One limitation of this study is that it was done in brain slices. Although slice preparations are widely used to examine synaptic dynamics or plasticity, it is questionable whether the slice preparation is appropriate for the examination of cellular circuits, particularly when attempting to examine the role of the remote structures such as the thalamus. Therefore, the fact that this study was performed in vitro should be kept in mind when evaluating the data and its potential implications. Our results, which indicate that thalamic inputs occupy selective parts of dendritic trees of thalamorecipient neurons in the ACx, may arise from an incomplete circuit and may underestimate the role of the thalamus. It is possible that similar experiments performed in vivo could potentially lead to very different results, because all synaptic inputs would be intact. However, the facts that all thalamic inputs were found within 100 μm from the soma regardless of the depth of a thalamorecipient neuron in a slice and thickness of a slice and all analyzed neurons had intact dendritic trees strongly argue against the possibility of thalamic axons targeting the distal parts of dendritic tree of thalamorecipient L3/4 neurons. Indeed, anterograde tracing in primary thalamocortical slices has shown that thalamic axons terminate mostly in L3/4 rarely reaching supragranular cortical layers in which the distal parts of apical dendrites are located (Cruikshank et al., 2002).
Although combined IC and Th inputs occupied different areas on dendritic trees, their locations were not mutually exclusive. Th inputs and 60% of IC inputs were found in the perisomatic area. What additional mechanisms may provide Th inputs an advantage over nearby IC inputs? We found that Th inputs primarily synapse on short stubby dendritic spines, whereas IC inputs have a preference toward mushroom spines. The short length and wide neck of short stubby spines suggest that neck resistance is minimal in these spines relative to other types of dendritic spines. Some evidence indicates that spine neck resistance is not homogenous in pyramidal neurons and may range from 1 to 1000 MΩ (Svoboda et al., 1996; Bloodgood and Sabatini, 2005). Therefore, we hypothesized that Th inputs preferentially targeting stubby dendritic spines may use dendritic spine morphology as a second advantage over IC inputs.
Using two-photon glutamate uncaging, we showed that the amplitude of a postsynaptic potential recorded in the soma depends on proximity and morphology of activated dendritic spines. Indeed, uncaging glutamate at dendritic spines at different distances from the soma revealed a strong attenuation (λ = ∼45 μm) of postsynaptic potentials in both basal and apical dendrites. Given that the average distances of Th and IC inputs are ∼49 and 110 μm from the soma, respectively, Th inputs are situated more favorably to contribute to depolarization of the soma and eventually to the generation of action potentials in thalamorecipient neurons.
Furthermore, two-photon glutamate uncaging revealed that the activation of stubby dendritic spines produces significantly larger postsynaptic potentials than does the activation of neighboring mushroom dendritic spines. Thus, even at the same distance from the soma, Th inputs that target stubby spines have an advantage over IC inputs located on mushroom dendritic spines in depolarizing the soma. The larger postsynaptic potentials seen in response to activation of stubby spines compared with mushroom spines may be explained by differences in their spine neck width and eventually to spine neck resistance. Alternatively, the possibility of a higher number of AMPARs in postsynaptic densities of stubby spines should be considered.
We found that Th and IC inputs did not differ in their individual presynaptic properties, as evident by measurements of peak amplitudes of calcium transients and P Ca; therefore, it is unlikely that thalamocortical projections in ACx achieve their advantage over IC projections through such presynaptic mechanisms as an increase in the probability of neurotransmitter release or the number of release sites at a single synapse. Interestingly, previous works in thalamocortical slices containing the somatosensory cortex indicated that Th inputs have three times more release sites per axon than IC inputs (Gil et al., 1999; Amitai, 2001). In contrast, the difference in probability of neurotransmitter release between Th and IC inputs determined by electrophysiological methods was substantially smaller: it was 1.5-fold higher in Th synapses compared with IC synapses (Gil et al., 1999). Together with our results, these data suggest that a thalamic axon forms more synaptic contacts with thalamorecipient neurons than an IC axon. However, a difference between neurotransmitter release properties at individual TC and IC synapses is more subtle in both ACx and the somatosensory cortex.
In addition to reliably receiving sensory information from the thalamus, the ACx is very plastic. The ACx receptive fields change in response to alterations of neural activity or sensory experience (Kilgard and Merzenich, 1998; Fritz et al., 2003; Weinberger, 2004; Froemke et al., 2007). It is important that plastic changes in the ACx during learning should not compromise the effectiveness of thalamocortical projections and consequently the reliability of the delivery of acoustic information to the ACx. Given that Th inputs preferentially make synapses on stubby spines and recent data showing that mushroom spines are the primary site of synaptic plasticity in pyramidal neurons (Matsuo et al., 2008), it is tempting to speculate that synaptic plasticity in mushroom spines of thalamorecipient neurons may underlie plastic changes in receptive fields that occur in the ACx during learning, whereas synaptic transmission via stubby spines guarantees reliable delivery of sensory information from the thalamus to the cortex (Nahmani and Erisir, 2005).
In conclusion, our data suggest that fewer Th inputs occupying select locations (stubby spines located close to the soma) outperform more numerous IC inputs occupying less optimal locations on dendritic trees of thalamorecipient neurons. Here we propose that these mechanisms alone, or in concert with previously suggested mechanisms (Douglas et al., 1995; Stratford et al., 1996; Gil et al., 1999; Lübke et al., 2000; Bruno and Sakmann, 2006), may contribute to the reliability of sensory information delivery to the cortex.
Footnotes
This work was supported by the Whitehall Foundation, National Institute of Mental Health Grant R01MH079079, National Cancer Institute Cancer Center Support Grant P30 CA021765, and the American Lebanese Syrian Associated Charities (S.S.Z.). S.S.Z. is a Searle Scholar. We thank Laurie Earls and Gaines Fricke for their comments, Katie Steigelman and Jian Zuo for their help with the ABR experiments, and Angela McArthur for editing this manuscript.
References
- Ahmed B, Anderson JC, Douglas RJ, Martin KA, Nelson JC. Polyneuronal innervation of spiny stellate neurons in cat visual cortex. J Comp Neurol. 1994;341:39–49. doi: 10.1002/cne.903410105. [DOI] [PubMed] [Google Scholar]
- Amitai Y. Thalamocortical synaptic connections: efficacy, modulation, inhibition and plasticity. Rev Neurosci. 2001;12:159–173. doi: 10.1515/revneuro.2001.12.2.159. [DOI] [PubMed] [Google Scholar]
- Anderson JC, Douglas RJ, Martin KA, Nelson JC. Map of the synapses formed with the dendrites of spiny stellate neurons of cat visual cortex. J Comp Neurol. 1994;341:25–38. doi: 10.1002/cne.903410104. [DOI] [PubMed] [Google Scholar]
- Bannister AP. Inter- and intra-laminar connections of pyramidal cells in the neocortex. Neurosci Res. 2005;53:95–103. doi: 10.1016/j.neures.2005.06.019. [DOI] [PubMed] [Google Scholar]
- Barbour DL, Callaway EM. Excitatory local connections of superficial neurons in rat auditory cortex. J Neurosci. 2008;28:11174–11185. doi: 10.1523/JNEUROSCI.2093-08.2008. [DOI] [PMC free article] [PubMed] [Google Scholar]
- Bayazitov IT, Richardson RJ, Fricke RG, Zakharenko SS. Slow presynaptic and fast postsynaptic components of compound long-term potentiation. J Neurosci. 2007;27:11510–11521. doi: 10.1523/JNEUROSCI.3077-07.2007. [DOI] [PMC free article] [PubMed] [Google Scholar]
- Benshalom G, White EL. Quantification of thalamocortical synapses with spiny stellate neurons in layer IV of mouse somatosensory cortex. J Comp Neurol. 1986;253:303–314. doi: 10.1002/cne.902530303. [DOI] [PubMed] [Google Scholar]
- Berger T, Larkum ME, Lüscher HR. High I(h) channel density in the distal apical dendrite of layer V pyramidal cells increases bidirectional attenuation of EPSPs. J Neurophysiol. 2001;85:855–868. doi: 10.1152/jn.2001.85.2.855. [DOI] [PubMed] [Google Scholar]
- Bloodgood BL, Sabatini BL. Neuronal activity regulates diffusion across the neck of dendritic spines. Science. 2005;310:866–869. doi: 10.1126/science.1114816. [DOI] [PubMed] [Google Scholar]
- Bloodgood BL, Sabatini BL. Nonlinear regulation of unitary synaptic signals by CaV(2.3) voltage-sensitive calcium channels located in dendritic spines. Neuron. 2007;53:249–260. doi: 10.1016/j.neuron.2006.12.017. [DOI] [PubMed] [Google Scholar]
- Brecht M, Sakmann B. Whisker maps of neuronal subclasses of the rat ventral posterior medial thalamus, identified by whole-cell voltage recording and morphological reconstruction. J Physiol. 2002;538:495–515. doi: 10.1113/jphysiol.2001.012334. [DOI] [PMC free article] [PubMed] [Google Scholar]
- Bruno RM, Sakmann B. Cortex is driven by weak but synchronously active thalamocortical synapses. Science. 2006;312:1622–1627. doi: 10.1126/science.1124593. [DOI] [PubMed] [Google Scholar]
- Chiaia NL, Bennett-Clarke CA, Rhoades RW. Effects of cortical and thalamic lesions upon primary afferent terminations, distributions of projection neurons, and the cytochrome oxidase pattern in the trigeminal brainstem complex. J Comp Neurol. 1991;303:600–616. doi: 10.1002/cne.903030407. [DOI] [PubMed] [Google Scholar]
- Cruikshank SJ, Rose HJ, Metherate R. Auditory thalamocortical synaptic transmission in vitro. J Neurophysiol. 2002;87:361–384. doi: 10.1152/jn.00549.2001. [DOI] [PubMed] [Google Scholar]
- Denk W, Strickler JH, Webb WW. Two-photon laser scanning fluorescence microscopy. Science. 1990;248:73–76. doi: 10.1126/science.2321027. [DOI] [PubMed] [Google Scholar]
- DeWeese MR, Wehr M, Zador AM. Binary spiking in auditory cortex. J Neurosci. 2003;23:7940–7949. doi: 10.1523/JNEUROSCI.23-21-07940.2003. [DOI] [PMC free article] [PubMed] [Google Scholar]
- Dodt HU, Eder M, Schierloh A, Zieglgansberger W. Infrared-guided laser stimulation of neurons in brain slices. Sci STKE. 2002;2002:L2. doi: 10.1126/stke.2002.120.pl2. [DOI] [PubMed] [Google Scholar]
- Douglas RJ, Martin KA. Mapping the matrix: the ways of neocortex. Neuron. 2007;56:226–238. doi: 10.1016/j.neuron.2007.10.017. [DOI] [PubMed] [Google Scholar]
- Douglas RJ, Koch C, Mahowald M, Martin KA, Suarez HH. Recurrent excitation in neocortical circuits. Science. 1995;269:981–985. doi: 10.1126/science.7638624. [DOI] [PubMed] [Google Scholar]
- Dunwiddie TV, Hoffer BJ, Fredholm BB. Alkylxanthines elevate hippocampal excitability. Evidence for a role of endogenous adenosine. Naunyn Schmiedebergs Arch Pharmacol. 1981;316:326–330. doi: 10.1007/BF00501365. [DOI] [PubMed] [Google Scholar]
- Emptage NJ, Reid CA, Fine A, Bliss TV. Optical quantal analysis reveals a presynaptic component of LTP at hippocampal Schaffer-associational synapses. Neuron. 2003;38:797–804. doi: 10.1016/s0896-6273(03)00325-8. [DOI] [PubMed] [Google Scholar]
- Feldman ML, Peters A. The forms of non-pyramidal neurons in the visual cortex of the rat. J Comp Neurol. 1978;179:761–793. doi: 10.1002/cne.901790406. [DOI] [PubMed] [Google Scholar]
- Ferster D, Chung S, Wheat H. Orientation selectivity of thalamic input to simple cells of cat visual cortex. Nature. 1996;380:249–252. doi: 10.1038/380249a0. [DOI] [PubMed] [Google Scholar]
- Fitzpatrick DC, Henson OW., Jr Cell types in the mustached bat auditory cortex. Brain Behav Evol. 1994;43:79–91. doi: 10.1159/000113626. [DOI] [PubMed] [Google Scholar]
- Fritz J, Shamma S, Elhilali M, Klein D. Rapid task-related plasticity of spectrotemporal receptive fields in primary auditory cortex. Nat Neurosci. 2003;6:1216–1223. doi: 10.1038/nn1141. [DOI] [PubMed] [Google Scholar]
- Froemke RC, Merzenich MM, Schreiner CE. A synaptic memory trace for cortical receptive field plasticity. Nature. 2007;450:425–429. doi: 10.1038/nature06289. [DOI] [PubMed] [Google Scholar]
- Gil Z, Connors BW, Amitai Y. Efficacy of thalamocortical and intracortical synaptic connections: quanta, innervation, and reliability. Neuron. 1999;23:385–397. doi: 10.1016/s0896-6273(00)80788-6. [DOI] [PubMed] [Google Scholar]
- Goldberg JH, Tamas G, Aronov D, Yuste R. Calcium microdomains in aspiny dendrites. Neuron. 2003;40:807–821. doi: 10.1016/s0896-6273(03)00714-1. [DOI] [PubMed] [Google Scholar]
- Jack JJ, Redman SJ. The propagation of transient potentials in some linear cable structures. J Physiol. 1971;215:283–320. doi: 10.1113/jphysiol.1971.sp009472. [DOI] [PMC free article] [PubMed] [Google Scholar]
- Kilgard MP, Merzenich MM. Cortical map reorganization enabled by nucleus basalis activity. Science. 1998;279:1714–1718. doi: 10.1126/science.279.5357.1714. [DOI] [PubMed] [Google Scholar]
- Lee CC, Winer JA. Connections of cat auditory cortex. I. Thalamocortical system. J Comp Neurol. 2008a;507:1879–1900. doi: 10.1002/cne.21611. [DOI] [PMC free article] [PubMed] [Google Scholar]
- Lee CC, Winer JA. Connections of cat auditory cortex. II. Commissural system. J Comp Neurol. 2008b;507:1901–1919. doi: 10.1002/cne.21614. [DOI] [PMC free article] [PubMed] [Google Scholar]
- Lee CC, Winer JA. Connections of cat auditory cortex. III. Corticocortical system. J Comp Neurol. 2008c;507:1920–1943. doi: 10.1002/cne.21613. [DOI] [PMC free article] [PubMed] [Google Scholar]
- Lübke J, Egger V, Sakmann B, Feldmeyer D. Columnar organization of dendrites and axons of single and synaptically coupled excitatory spiny neurons in layer 4 of the rat barrel cortex. J Neurosci. 2000;20:5300–5311. doi: 10.1523/JNEUROSCI.20-14-05300.2000. [DOI] [PMC free article] [PubMed] [Google Scholar]
- Lund JS. Organization of neurons in the visual cortex, area 17, of the monkey (Macaca mulatta) J Comp Neurol. 1973;147:455–496. doi: 10.1002/cne.901470404. [DOI] [PubMed] [Google Scholar]
- Magee JC, Cook EP. Somatic EPSP amplitude is independent of synapse location in hippocampal pyramidal neurons. Nat Neurosci. 2000;3:895–903. doi: 10.1038/78800. [DOI] [PubMed] [Google Scholar]
- Matsuo N, Reijmers L, Mayford M. Spine-type-specific recruitment of newly synthesized AMPA receptors with learning. Science. 2008;319:1104–1107. doi: 10.1126/science.1149967. [DOI] [PMC free article] [PubMed] [Google Scholar]
- Matsuzaki M, Ellis-Davies GC, Nemoto T, Miyashita Y, Iino M, Kasai H. Dendritic spine geometry is critical for AMPA receptor expression in hippocampal CA1 pyramidal neurons. Nat Neurosci. 2001;4:1086–1092. doi: 10.1038/nn736. [DOI] [PMC free article] [PubMed] [Google Scholar]
- McGuire BA, Hornung JP, Gilbert CD, WIESEL TN. Patterns of synaptic input to layer 4 of cat striate cortex. J Neurosci. 1984;4:3021–3033. doi: 10.1523/JNEUROSCI.04-12-03021.1984. [DOI] [PMC free article] [PubMed] [Google Scholar]
- McMullen NT, Glaser EM. Morphology and laminar distribution of nonpyramidal neurons in the auditory cortex of the rabbit. J Comp Neurol. 1982;208:85–106. doi: 10.1002/cne.902080107. [DOI] [PubMed] [Google Scholar]
- Nahmani M, Erisir A. VGluT2 immunochemistry identifies thalamocortical terminals in layer 4 of adult and developing visual cortex. J Comp Neurol. 2005;484:458–473. doi: 10.1002/cne.20505. [DOI] [PubMed] [Google Scholar]
- Nevian T, Larkum ME, Polsky A, Schiller J. Properties of basal dendrites of layer 5 pyramidal neurons: a direct patch-clamp recording study. Nat Neurosci. 2007;10:206–214. doi: 10.1038/nn1826. [DOI] [PubMed] [Google Scholar]
- Nicholson DA, Trana R, Katz Y, Kath WL, Spruston N, Geinisman Y. Distance-dependent differences in synapse number and AMPA receptor expression in hippocampal CA1 pyramidal neurons. Neuron. 2006;50:431–442. doi: 10.1016/j.neuron.2006.03.022. [DOI] [PubMed] [Google Scholar]
- Noguchi J, Matsuzaki M, Ellis-Davies GC, Kasai H. Spine-neck geometry determines NMDA receptor-dependent Ca2+ signaling in dendrites. Neuron. 2005;46:609–622. doi: 10.1016/j.neuron.2005.03.015. [DOI] [PMC free article] [PubMed] [Google Scholar]
- Oertner TG, Sabatini BL, Nimchinsky EA, Svoboda K. Facilitation at single synapses probed with optical quantal analysis. Nat Neurosci. 2002;5:657–664. doi: 10.1038/nn867. [DOI] [PubMed] [Google Scholar]
- Pettit DL, Wang SS, Gee KR, Augustine GJ. Chemical two-photon uncaging: a novel approach to mapping glutamate receptors. Neuron. 1997;19:465–471. doi: 10.1016/s0896-6273(00)80361-x. [DOI] [PubMed] [Google Scholar]
- Rall W. Distinguishing theoretical synaptic potentials computed for different soma-dendritic distributions of synaptic input. J Neurophysiol. 1967;30:1138–1168. doi: 10.1152/jn.1967.30.5.1138. [DOI] [PubMed] [Google Scholar]
- Read HL, Winer JA, Schreiner CE. Functional architecture of auditory cortex. Curr Opin Neurobiol. 2002;12:433–440. doi: 10.1016/s0959-4388(02)00342-2. [DOI] [PubMed] [Google Scholar]
- Redman S, Walmsley B. The time course of synaptic potentials evoked in cat spinal motoneurones at identified group Ia synapses. J Physiol. 1983;343:117–133. doi: 10.1113/jphysiol.1983.sp014884. [DOI] [PMC free article] [PubMed] [Google Scholar]
- Rose HJ, Metherate R. Auditory thalamocortical transmission is reliable and temporally precise. J Neurophysiol. 2005;94:2019–2030. doi: 10.1152/jn.00860.2004. [DOI] [PubMed] [Google Scholar]
- Sabatini BL, Oertner TG, Svoboda K. The life cycle of Ca2+ ions in dendritic spines. Neuron. 2002;33:439–452. doi: 10.1016/s0896-6273(02)00573-1. [DOI] [PubMed] [Google Scholar]
- Sherman SM, Guillery RW. The role of the thalamus in the flow of information to the cortex. Philos Trans R Soc Lond B Biol Sci. 2002;357:1695–1708. doi: 10.1098/rstb.2002.1161. [DOI] [PMC free article] [PubMed] [Google Scholar]
- Smith PH, Populin LC. Fundamental differences between the thalamocortical recipient layers of the cat auditory and visual cortices. J Comp Neurol. 2001;436:508–519. doi: 10.1002/cne.1084. [DOI] [PubMed] [Google Scholar]
- Spruston N, Jaffe DB, Williams SH, Johnston D. Voltage- and space-clamp errors associated with the measurement of electrotonically remote synaptic events. J Neurophysiol. 1993;70:781–802. doi: 10.1152/jn.1993.70.2.781. [DOI] [PubMed] [Google Scholar]
- Stepanyants and Chklovskii, 2005.Stepanyants A, Chklovskii DB. Neurogeometry and potential synaptic connectivity. Trends Neurosci. 2005;28:387–394. doi: 10.1016/j.tins.2005.05.006. [DOI] [PubMed] [Google Scholar]
- Stratford et al., 1996.Stratford KJ, Tarczy-Hornoch K, Martin KA, Bannister NJ, Jack JJ. Excitatory synaptic inputs to spiny stellate cells in cat visual cortex. Nature. 1996;382:258–261. doi: 10.1038/382258a0. [DOI] [PubMed] [Google Scholar]
- Stuart and Spruston, 1998.Stuart G, Spruston N. Determinants of voltage attenuation in neocortical pyramidal neuron dendrites. J Neurosci. 1998;18:3501–3510. doi: 10.1523/JNEUROSCI.18-10-03501.1998. [DOI] [PMC free article] [PubMed] [Google Scholar]
- Svoboda et al., 1996.Svoboda K, Tank DW, Denk W. Direct measurement of coupling between dendritic spines and shafts. Science. 1996;272:716–719. doi: 10.1126/science.272.5262.716. [DOI] [PubMed] [Google Scholar]
- Verbny et al., 2006.Verbny YI, Erdelyi F, Szabo G, Banks MI. Properties of a population of GABAergic cells in murine auditory cortex weakly excited by thalamic stimulation. J Neurophysiol. 2006;96:3194–3208. doi: 10.1152/jn.00484.2006. [DOI] [PMC free article] [PubMed] [Google Scholar]
- Weinberger, 2004.Weinberger NM. Specific long-term memory traces in primary auditory cortex. Nat Rev Neurosci. 2004;5:279–290. doi: 10.1038/nrn1366. [DOI] [PMC free article] [PubMed] [Google Scholar]
- White et al., 1980.White EL, Hersch SM, Rock MP. Synaptic sequences in mouse SmI cortex involving pyramidal cells labeled by retrograde filling with horseradish peroxidase. Neurosci Lett. 1980;19:149–154. doi: 10.1016/0304-3940(80)90186-x. [DOI] [PubMed] [Google Scholar]
- Williams and Stuart, 2002.Williams SR, Stuart GJ. Dependence of EPSP efficacy on synapse location in neocortical pyramidal neurons. Science. 2002;295:1907–1910. doi: 10.1126/science.1067903. [DOI] [PubMed] [Google Scholar]
- Winer et al., 2005.Winer JA, Miller LM, Lee CC, Schreiner CE. Auditory thalamocortical transformation: structure and function. Trends Neurosci. 2005;28:255–263. doi: 10.1016/j.tins.2005.03.009. [DOI] [PubMed] [Google Scholar]
- Yasuda et al., 2004.Yasuda R, Nimchinsky EA, Scheuss V, Pologruto TA, Oertner TG, Sabatini BL, Svoboda K. Imaging calcium concentration dynamics in small neuronal compartments. Sci STKE. 2004;2004:l5. doi: 10.1126/stke.2192004pl5. [DOI] [PubMed] [Google Scholar]
- Yuste and Denk, 1995.Yuste R, Denk W. Dendritic spines as basic functional units of neuronal integration. Nature. 1995;375:682–684. doi: 10.1038/375682a0. [DOI] [PubMed] [Google Scholar]
- Yuste et al., 1999.Yuste R, Majewska A, Cash SS, Denk W. Mechanisms of calcium influx into hippocampal spines: heterogeneity among spines, coincidence detection by NMDA receptors, and optical quantal analysis. J Neurosci. 1999;19:1976–1987. doi: 10.1523/JNEUROSCI.19-06-01976.1999. [DOI] [PMC free article] [PubMed] [Google Scholar]