

Abstract
Vitamin D insufficiency is prevalent in the northeast United States. Since vitamin D insufficiency is readily amenable to supplementation, it is important to understand what factors are associated with serum 25 hydroxy vitamin D (25(OH)D) response to vitamin D supplementation.
Objective
In this study we examined the association of serum 25(OH)D response to vitamin D supplementation with body size in a population of elderly subjects.
Methods
257 healthy, ambulatory men and women 65 years of age or older were randomly assigned to treatment with either 700 IU/day (17.5 μg/d) of supplemental vitamin D3 and 500 mg/day (12.5 mmol/d) of supplemental calcium, or to placebo.
Results
In multivariate regression analyses, after adjusting for baseline 25(OH)D, season, and sex, we found change in 25(OH)D to be inversely associated with baseline BMI (p = 0.01) in subjects treated with supplements for one year. Change in 25(OH)D was also negatively associated with other baseline anthropometric measurements in these subjects.
Conclusion
Our study implies that body size should be taken into account when estimating the amount of vitamin D intake needed to raise 25(OH)D to the desired level.
Keywords: Body size, body mass index, 25 hydroxy vitamin D, vitamin D3 supplements, elderly
INTRODUCTION
Vitamin D is a fat-soluble vitamin that has important effects upon calcium and bone metabolism. In addition to maintaining calcium homeostasis, vitamin D metabolites may also be involved in the functioning of numerous other systems [1]. There is evidence that vitamin D may reduce the risk of cardiovascular disease [2], hypertension [3,4], diabetes [2,5] and some cancers [6,7].
Vitamin D insufficiency is prevalent in the northeast United States [8-10]. Many factors influence blood 25 hydroxy vitamin D (25(OH)D) concentration that is used to determine clinical vitamin D status. The amount of sunlight exposure [11], amount of skin pigmentation [12] and age [13] of subjects as well as vitamin D intake [14-16] all affect blood levels of 25(OH)D. In addition, Vitamin D status is known to be altered by obesity [17-23].
There is evidence that even in subjects who are not morbidly obese, 25(OH)D levels vary with body size. Serum 25(OH)D level is inversely associated with percent total body fat in women [24] and with body weight in men and women [25]. In addition, in young men given either 1000, 10,000 or 50,000 IU per day (25, 250 or 1250 μg/d) of vitamin D3 supplements for eight weeks, the rise in serum 25(OH)D levels was inversely associated with BMI [26]. Since the prevalence of overweight and obesity in the U.S. is increasing [27], it is important to determine whether body size needs to be considered when estimating the vitamin D intake needed to raise serum 25(OH)D concentrations to a desired level. In this study, we examined the association of serum 25(OH)D response to vitamin D supplementation with body size in a population of elderly subjects enrolled in a randomized placebo-controlled study of vitamin D and calcium supplementation.
MATERIALS AND METHODS
The subjects in this study were healthy, ambulatory men and women 65 years of age or older who participated in a 3-year intervention study [14]. Subjects were randomly assigned to treatment with either 700 IU/day (17.5 μg/d) of supplemental vitamin D3 and 500 mg/day (12.5 mmol/d) of supplemental calcium, or to placebo. Subjects were advised to maintain their usual diets and to avoid taking supplemental calcium and vitamin D on their own for two months before and throughout the study. Data for this analysis are from measurements made at the initial visit and from measurements obtained at year one.
As previously described [14], exclusion criteria included selected conditions and medications related to bone metabolism, BMD more than 2 SD below the reference mean for adults of the same sex and age, and dietary calcium intake above 1500 mg/day (37.5 mmol/d). Of the 389 subjects who completed the trial, the 257 subjects selected for this study were subjects who had not traveled to a latitude of ≤ 35° N for 3 months prior to their initial study visit and 3 months prior to their visit at year one [25]. The protocol was approved by the Investigation Review Board at Tufts University and all volunteers gave written informed consent.
Measurements
The subjects came to the Center every six months for measurements. Volunteers were recruited and enrolled at an approximately even rate over a 12.5 month period starting in February. For the analyses, subjects were grouped by season of enrollment which was defined as one of three periods: June through September (when 25(OH)D concentrations are known to be highest in Boston), and the two flanking 4 month intervals of February through May and October through January [25]. Dietary calcium and vitamin D intakes were estimated on the basis of a food-frequency questionnaire and total calcium and vitamin D intakes (diet plus supplements) were computed. Tobacco use was determined by questionnaire. Height was measured with a stadiometer and weight with a digital scale. Body mass index (BMI) was calculated by dividing the weight (in kilograms) by the square of the height (in meters). Waist circumference (in centimeters) was measured with a tape measure placed at the smallest horizontal circumference between the ribs and iliac crest. Body fat (in kilograms) was measured with a total body scan by dual-energy x-ray absorptiometry with use of a DPX-L scanner (Lunar Radiation, Madison, Wis.). The coefficient of variation for the total body scan measurement was 0.6 percent. Central fat was calculated by adding together fat mass from the trunk, ribs, pelvis, spine, dorsal and lumbar regions, and peripheral fat was calculated by adding the fat mass of the legs to that of the arms. Blood was drawn between 7:00 and 9:30 a.m. after the subjects had fasted for at least eight hours. Plasma 25(OH)D was measured by the method of Preece et al [28]. The vitamin D3 tablets used as supplements were assayed at baseline and found to contain 707 IU (17.7 μg).
Statistical Analysis
Characteristics of the subjects are reported as means or proportions. Associations between variables were examined using Pearson correlation coefficients, partial correlation coefficients and analysis of covariance (ANCOVA). The models included covariates known to affect 25(OH)D level. The statistical significance of potential interactions was examined by including interaction terms in the ANCOVA models. In analyzing the association of baseline 25(OH)D with baseline BMI, a significant interaction was found between sex and baseline BMI, so for this analysis men and women were analyzed separately. For some of the analyses subjects were divided into subgroups based on BMI at baseline. Comparisons between groups were made with two sample t tests, with Fisher's z statistic for comparing correlation coefficients, and with analysis of covariance when adjustments were required. Statistical tests were conducted at the two-tailed 0.05 level. SPSS for Window, version 12.0 (SPSS Inc, Chicago) was used for the analyses.
RESULTS
Baseline characteristics of the 257 subjects divided by gender and treatment group are listed in Table 1. Overall, 97% of the subjects were white and only 4% of the subjects were current smokers. The age range for the subjects was 65 to 86 years of age. Of the study population, 47.5% were less than 70 years old, 30.7% were between 70 and 74 years old, 16.4% were between 75 and 79 years old and 5.4% were 80 years or older. Mean calcium intake for the group as a whole was 721 ± 329 mg/day (18.0 ± 8.2 mmol/d) and mean intake of vitamin D was 189 ± 106 IU/day (4.7 ± 2.7 μg/d). 36.2% of the subjects were lean (BMI < 25), 44.7% were overweight (25 ≤ BMI <30) and 19.1% were obese (BMI ≥ 30).
Table 1.
Baseline Characteristics of the 257 Study Subjects.*
| Characteristic | Men | Women | ||
|---|---|---|---|---|
|
Calcium-Vitamin D Group (n=66) |
Placebo Group (n=56) |
Calcium-Vitamin D Group (n=66) |
Placebo Group (n= 69) |
|
| Age (yr) | 70.5 ± 4.9 | 71.5 ± 4.8 | 71.4 ± 4.8 | 71.9 ± 4.7 |
| Weight (kg) | 82.8 ± 11.4 | 83.4 ± 14.4 | 67.6 ± 12.3 | 68.1 ± 13.9 |
| BMI (kg/m2) | 27.2 ± 3.1 | 27.3 ± 3.8 | 26.7 ± 4.9 | 26.8 ± 5.0 |
| Waist Circumference (cm) | 98.3 ± 9.8 | 98.2 ± 12.0 | 84.5 ± 10.7 | 84.9 ± 11.4 |
| Body fat (kg) | 24.1 ± 7.4 | 23.4 ± 9.1 | 27.1 ± 9.1 | 27.0 ± 10.0 |
| Central Fat (kg) | 30.4 ± 10.0 | 29.4 ± 11.9 | 28.0 ± 10.2 | 27.7 ± 10.5 |
| Peripheral Fat (kg) | 8.9 ± 3.0 | 8.7 ± 3.5 | 13.1 ± 4.5 | 13.2 ± 5.2 |
| 25(OH)D (ng/ml) | 32.1 ± 14.6 | 32.6 ± 12.6 | 27.6 ± 12.0 | 25.2 ± 10.3 |
Plus-minus values are means ± SD.
To convert values for serum 25(OH)D to nmol/l, multiply by 2.5.
We examined associations of baseline 25(OH)D level with baseline BMI. Since the data suggested that this association was different in men and women, we analyzed men and women separately. In the women but not the men, baseline 25(OH)D level was negatively associated with baseline BMI (r=−0.25, p< 0.01, r=−0.01, NS, respectively, p = 0.05 for difference between women and men). Similarly, in multivariate regression analyses, baseline 25(OH)D level in the women was negatively associated with BMI after adjusting for season ( β= −0.67, p< 0.01). In this model, baseline 25(OH)D level was also significantly associated with season (p<0.01).
We next evaluated the association of change in 25(OH)D level in response to vitamin D supplementation with baseline BMI in the group as a whole. 132 subjects were in the calcium-vitamin D supplementation treatment group and 125 were in the placebo group. There were no significant differences in the two groups in age, male to female ratio or BMI. The two groups also did not differ significantly with respect to season of visit. Mean baseline 25(OH)D level was 29.9 ± 13.5 ng/ml (74.7 ± 33.8 nmol/l) in the calcium-vitamin D group and 28.5 ± 11.9 ng/ml (71.2 ± 29.8 nmol/l) in the placebo group (NS). As expected, the calcium-vitamin D group had a significant increase in 25(OH)D level over the course of one year compared to the placebo group [mean increase in 25(OH)D level: 19.4 ±14.1 vs. 3.7 ± 8.6 ng/ml, respectively, p< 0.01 (48.5 ± 35.3 vs. 9.3 ± 21.5 nmol/l)].
In this analysis, there was no significant interaction between baseline BMI and gender, so men and women were examined together. In multivariate regression analyses, in the calcium-vitamin D group, change in 25(OH)D level was negatively associated with BMI (β= −0.70 , p= 0.01) after adjusting for baseline 25(OH)D level, season and sex (Table 3). In this model, season was significantly associated with change in 25(OH)D level (p=0.01) but sex was not, and baseline 25(OH)D level was negatively associated with change in 25(OH)D level (p≤ 0.01). In the placebo group in multiple regression analyses, change in 25(OH)D level was also inversely associated with baseline BMI, however the results were not significant (β = −0.31, NS). The calcium-vitamin D group and placebo group were not significantly different from each other with respect to the association of change in 25(OH)D level at one year with BMI.
Table 3.
Associations of Change in 25(OH) Vitamin D Level (ng/ml) with Baseline Measurements of Body Size in Both Treatment Groups.
| Model | Calcium-Vitamin D Group | Placebo Group | ||
|---|---|---|---|---|
| B | 95% CI | B | 95% CI | |
| A. BMI (kg/m2) | −0.70a | (−1.24, −0.17) | −0.31e | (−0.64, 0.02) |
| B. Weight (kg) | −0.25b | (−0.45, −0.05) | −0.12e | (−0.24, 0.01) |
| C. Waist Circumference (cm) | −0.29a | (−0.51, −0.07) | −0.10e | (−0.23, 0.04) |
| D. Body fat (kg) | −0.29c | (−0.56, −0.01) | −0.15e | (−0.32, 0.02) |
| E. Central Fat (kg) | −0.25d | (−0.47, −0.03) | −0.12e | (−0.27, 0.02) |
| F. Peripheral Fat (kg) | −0.49e | (−1.1, 0.12) | −0.31e | (−0.66, 0.04) |
B represents regression coefficients and CI is confidence interval. All models are adjusted for baseline 25(OH)D level, season, and sex. Models B through F are additionally adjusted for height.
Significant value, p=0.01.
Significant value, p =0.02.
Significant value, p =0.04.
Significant value, p =0.03.
Value is not significant.
To illustrate the association of change in 25(OH)D level with baseline BMI, we stratified the subjects in each treatment group based on their baseline BMI (subgroup I: BMI less than 25 kg/m2, subgroup II: BMI greater than or equal to 25 but less than 30 kg/m2, and subgroup III: BMI greater than or equal to 30 kg/m2). Table 2 depicts selected characteristics across the subgroups in the two treatment groups. As expected, the BMI subgroups within each treatment group differed significantly in weight. Within each treatment group, the BMI subgroups did not differ significantly in baseline 25(OH)D level, although the level tended to be lower in those in the highest BMI subgroups in both the calcium-vitamin D group and in the placebo group. The BMI subgroups also did not differ significantly with regard to season of visit (data not shown). Figure 1 portrays the mean change in 25(OH)D levels at one year in BMI subgroups for both treatment groups after adjusting for baseline 25(OH)D levels and season. In the calcium-vitamin D group, there was a significant difference in mean adjusted change in 25(OH)D levels at one year across BMI subgroups (ANOVA p = 0.05). As shown, the mean adjusted change in 25(OH)D level was 22.8 ± 5.6 (SE) ng/ml (57.0 ± 14.0 nmol/l) in BMI subgroup I compared to a change of 16.3 ± 2.1ng/ml (40.8 ± 5.3 nmol/l)) in BMI subgroup III in the calcium-vitamin D group. In the placebo group, change in 25(OH)D level did not differ significantly among the BMI subgroups. In this model, when compared to placebo subjects, the change in mean adjusted 25(OH)D level seen at one year in the calcium-vitamin D subjects with a BMI of 30 kg/m2 or more was approximately 21% less than the change in mean adjusted 25(OH)D level seen in subjects with a BMI of less than 25 kg/m2.
Table 2.
Baseline Characteristics of Subjects Divided into BMI Subgroups
| Characteristic | Calcium-Vitamin D Group | Placebo Group | ||||
|---|---|---|---|---|---|---|
|
BMI I (n=47) |
BMI II (n=59) |
BMI III (n=26) |
BMI I (n=46) |
BMI II (n=56) |
BMI III (n=23) |
|
| Age (yr) | 72.4 ± 5.3| | 70.0 ± 4.4 | 70.5 ± 4.5 | 72.4 ± 4.7 | 71.7 ± 5.1 | 70.5 ± 4.0 |
| BMI (kg/m2) | 23.0 ± 1.8⇕ | 27.3 ± 1.3 | 33.1 ± 3.3 | 22.1 ± 1.5‡ | 27.5 ± 1.5 | 34.2 ± 3.7 |
| Weight (kg) | 62.6 ± 8.5⇕ | 79.0 ± 9.5 | 89.4 ± 12.4 | 61.6 ± 9.0‡ | 77.1 ± 10.5 | 96.3 ± 11.8 |
| 25(OH)D (ng/ml) | 31.7 ± 13.4 | 29.8 ± 12.9 | 26.7 ± 14.9 | 29.6 ± 10.7 | 28.3 ± 11.9 | 27.2 ± 14.4 |
BMI I represents subjects with BMI ± 25 kg/m2, BMI II represents subjects with 25 kg/m2 ≤ BMI ±30 kg/m2, and BMI III represents subjects with BMI ≥30 kg/m2. *Plus-minus values are means ± SD.
Significant differences found between the BMI subgroups in the calcium-vitamin D group in characteristics listed (p<0.05).
Significant differences found between the BMI subgroups in the calcium-vitamin D group in characteristics listed (p<0.01).
Significant differences found between the BMI subgroups in the placebo group in characteristics listed (p<0.01).
To convert values for serum 25(OH)D to nmol/l, multiply by 2.5.
Figure 1.
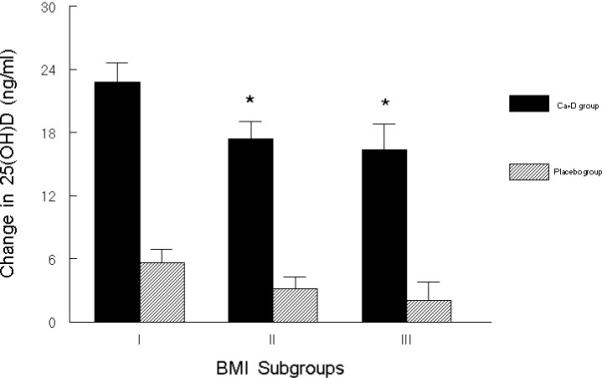
Mean adjusted change in 25(OH)D level (±SEM) at one year in the calcium-vitamin D and placebo groups, each divided into subgroups based on BMI at baseline. (Subgroup I: BMI < 25 kg/m2, subgroup II: 25 kg/m2 ≤ BMI< 30 kg/m2, subgroup III: BMI ≥30 kg/m2 ). Mean change in 25(OH)D level for calcium-vitamin D BMI subgroups (ANOVA P = 0.05) and placebo BMI subgroups (NS) are each adjusted for baseline 25(OH)D level and season. Sample size for the six groups from left to right are as follows: n= 47, n=46, n=59, n=56, n=26, n=23. *Significantly differs from BMI subgroup I (P < 0.05). To convert values for serum 25(OH)D to nmol/l, multiply by 2.5.
We also evaluated the association of change in 25(OH)D level with additional anthropometric measurements. Table 3 depicts associations of change in 25(OH)D level at one year with baseline anthropometric measurements in both the calcium-vitamin D group and the placebo group. Listed are regression coefficients from multivariate regression analyses. All models are adjusted for baseline 25(OH) D level, season and sex. Models B through F are additionally adjusted for height. As shown, in the calcium-vitamin D group, change in 25(OH)D level was negatively associated with baseline weight and waist circumference as well as with body fat. In this group, change in 25(OH)D level was also significantly associated with central fat, but it was not significantly associated with peripheral fat. The proportion of variability of change in 25(OH)D level explained by each of these models was similar, but baseline BMI was a slightly better predictor of change in 25(OH)D then the other anthropometric variables.
DISCUSSION
In this group of healthy elderly subjects enrolled in a study of vitamin D and calcium supplementation, baseline measurements of BMI, central fat, and other related body size measurements were inversely associated with change in serum 25(OH)D level in response to vitamin D supplementation. We found that in the calcium-vitamin D group, for every additional 5 kg/m2 of BMI at baseline or 15 kg of weight, the mean adjusted change in 25(OH)D level at one year was approximately 4 ng/ml (10 nmol/l) lower. Based on the report of a recent study [29], there is no reason to expect that the calcium given with the vitamin D supplement influenced the 25(OH)D response to the vitamin D. In their study, older men and women were given 800IU of vitamin D supplements daily for 90 days, and in addition, subjects were randomly assigned to receive either calcium (500mg twice daily) or placebo. At the end of the study, there was no significant difference in mean change in serum 25(OH) vitamin D levels between the group that received calcium supplementation and the group that received placebo. This study demonstrated that calcium supplements did not have a significant effect on the rise in serum 25(OH)D that occurred in response to vitamin D supplementation. Our study implies that not only obese subjects, but heavier subjects in general require higher doses of vitamin D supplements compared to thinner subjects in order to be vitamin D replete.
Prior studies have reported an inverse association of 25(OH)D levels with various body size measurements [17-24], but in a study of a healthy population in New Zealand, no correlation between serum vitamin D levels and BMI was found [30]. While these studies were cross-sectional and evaluated 25(OH)D levels at one point in time, our study is longitudinal and additionally examines factors associated with change in serum 25(OH)D level after one year of oral vitamin D supplementation. We also included a placebo group in our study to illustrate the secular changes in serum 25(OH)D levels. We analyzed results for the calcium-vitamin D treatment group and the placebo group separately, and while not significant, there appeared to be an inverse association between change in 25(OH)D levels and BMI in the placebo group as well. A previous longitudinal study reported an inverse association of BMI with change in serum 25(OH)D level in response to different doses of vitamin D [26]. In this study of healthy young men, 38 subjects were given either 1000, 10,000 or 50,000 IU (25, 250 or 1250 μg) of oral vitamin D3 for 8 weeks. In contrast to our study, this study used higher doses of vitamin D supplements, had a much shorter duration and studied a different population [26].
In contrast to weight, BMI is an estimate of general adiposity, and waist circumference estimates fat pattern. For clinical relevance we used BMI ranges defined by NIH guidelines [31] and divided the treatment groups into lean (BMI < 25 kg/m2), overweight (25 kg/m2 ≤ BMI< 30 kg/m2) and obese (BMI ≥ 30 kg/m2) subgroups. By measuring waist circumference as well as central and peripheral fat, we evaluated fat patterning which has been found to be an independent risk factor for various diseases [32]. Although other researchers have suggested that serum 25(OH)D levels are more strongly correlated with fat mass or adiposity than with body mass [24], we found only small differences between each of the anthropometric variables measured.
Vitamin D is stored in fat tissue [33, 34], and scientists have suggested that vitamin D in fat is a reservoir that could be drawn upon during deprivation [34]. However, research in obese subjects appears to challenge this. Liel et al proposed that there is enhanced uptake and clearance of vitamin D by adipose tissue in obese subjects [22]. Similarly, Wortsman, et al conclude that obese subjects have vitamin D trapped in adipose tissue and not released as needed [23]. These possibilities are consistent with our findings and suggest that since vitamin D is deposited in fat tissue and as such is not readily available, obese subjects may require larger than usual doses of vitamin D supplements.
The subjects in this study were from relatively homogenous racial backgrounds and were all elderly, so our findings may not be representative of the whole population. Racial differences in serum 25(OH)D levels have been reported [12] and 25(OH)D declines with age [13, 35]. However, utilization of oral vitamin D appears to be similar for blacks and whites [36]. Furthermore, absorption of vitamin D from the gut does not appear to be impaired by aging [37, 38], and there does not appear to be an age-related decline in 25(OH)D level in response to vitamin D supplements [39]. Nevertheless, since older people tend to have lower dietary intakes of vitamin D and less exposure to sunlight, the elderly often need vitamin D supplements to prevent vitamin D deficiency. It is thus important to substantiate what factors influence elderly subjects’ response to vitamin D supplements.
CONCLUSION
We found that change in 25(OH)D levels in response to vitamin D supplementation was inversely associated with BMI and other body size measurements in healthy men and women 65 years of age and older. Differences in body size of study subjects may explain some of the variability of serum 25(OH)D level response to vitamin D3 treatment reported in the literature [15, 16]. In our study, 700 IU/day (17.5 μg/d) of vitamin D supplementation produced a mean increase in serum 25(OH)D of 15.8 ng/ml (39.5 nmol/l). Based on these results we roughly estimate that in order to obtain a similar increase in serum 25(OH)D, an additional 17% or approximately an extra intake of 119 IU/day (3 μg/d) of vitamin D above 700 IU/day (17.5 μg/d) would be needed for every 10 kg of body weight above that which achieved the mean 25(OH)D response seen in our study population. This study implies that body size should be taken into account when estimating the amount of vitamin D intake needed to raise 25(OH)D to the desired level.
Acknowledgments
Grant support: This work was supported by the National Institutes of Health (grants K23 AR47869 and AG10353) and by a contract (53-3K06-5-10) with the Jean Mayer U.S. Department of Agriculture Human Nutrition Research Center on Aging at Tufts University.
References
- 1.Reichel H, Koeffler H, Norman A. The Role of the vitamin D endocrine system in health and disease. N Engl J Med. 1989;320:981–991. doi: 10.1056/NEJM198904133201506. [DOI] [PubMed] [Google Scholar]
- 2.Boucher B. Inadequate vitamin D status: does it contribute to the disorders comprising syndrome 'X'? Br J Nutr. 1998;79:315–327. doi: 10.1079/bjn19980055. [DOI] [PubMed] [Google Scholar]
- 3.Sowers MR, Wallace RB, Lemke J. The association of intakes of vitamin D and calcium with blood pressure among women. Am J Clin Nutr. 1985;42:135–142. doi: 10.1093/ajcn/42.1.135. [DOI] [PubMed] [Google Scholar]
- 4.Pfeifer M, Begerow B, Nachtigall D, Minne H. Vitamin D and calcium supplementation reduces blood pressure and secondary hyperparathyroidism in elderly women: A prospective, randomized, double-blind study. J Bone Miner Res. 1999;15(suppl):S443. doi: 10.1359/jbmr.2000.15.6.1113. [DOI] [PubMed] [Google Scholar]
- 5.Hypponen E, Laara E, Reunanen A, Jarvelin MR, Virtanen S. Intake of vitamin D and risk of type I diabetes: A birth-cohort study. Lancet. 2001;358:1500–1503. doi: 10.1016/S0140-6736(01)06580-1. [DOI] [PubMed] [Google Scholar]
- 6.Peehl D. Vitamin D and prostate cancer risk. European Urology. 1999;35:392–394. doi: 10.1159/000019914. [DOI] [PubMed] [Google Scholar]
- 7.Martinez M, Willet W. Calcium, vitamin D, and colorectal cancer: A review of the epidemiologic evidence. Cancer Epidemiology, Biomarkers and Prevention. 1998;7:163–168. [PubMed] [Google Scholar]
- 8.LeBoff M, Kohlmeier L, Hurwitz S, Franklin J, Wright J, Glowacki J. Occult vitamin D deficiency in postmenopausal US women with acute hip fracture. JAMA. 1999;281:1505–1511. doi: 10.1001/jama.281.16.1505. [DOI] [PubMed] [Google Scholar]
- 9.Webb A, Pilbeam C, Hanafin N, Holick M. An evaluation of the relative contributions of exposure to sunlight and of diet to the circulating concentrations of 25-hydroxyvitamin D in an elderly nursing home population in Boston. Am J Clin Nutr. 1990;51:1075–1081. doi: 10.1093/ajcn/51.6.1075. [DOI] [PubMed] [Google Scholar]
- 10.Thomas M, Lloyd-Jones D, Thadhani R, et al. Hypovitaminosis D in medical inpatients. N Engl J Med. 1998;338:777–783. doi: 10.1056/NEJM199803193381201. [DOI] [PubMed] [Google Scholar]
- 11.Webb A, Kline L, Holick M. Influence of season and latitude on the cutaneous synthesis of vitamin D3: Exposure to winter sunlight in Boston and Edmonton will not promote vitamin D3 synthesis in human skin. J Clin Endorcinol Metab. 1988;67:373–378. doi: 10.1210/jcem-67-2-373. [DOI] [PubMed] [Google Scholar]
- 12.Harris S, Dawson-Hughes B. Seasonal changes in plasma 25-hydroxyvitamin D concentrations of young American black and white women. Am J Clin Nutr. 1998;67:1232–1236. doi: 10.1093/ajcn/67.6.1232. [DOI] [PubMed] [Google Scholar]
- 13.Need A, Morris H, Horowitz M, Nordin B. Effects of skin thickness, age, body fat and sunlight on serum 25-hydroxyvitamin D. Am J Clin Nutr. 1993;58:882–885. doi: 10.1093/ajcn/58.6.882. [DOI] [PubMed] [Google Scholar]
- 14.Dawson-Hughes B, Harris S, Krall E, Dallal G. Effect of calcium and vitamin D supplementation on bone density in men and women 65 years of age or older. N Engl J Med. 1997;337:670–676. doi: 10.1056/NEJM199709043371003. [DOI] [PubMed] [Google Scholar]
- 15.Chapuy MC, Arlot ME, Duboeuf F, Brun J, Crouzet B, Arnaud S. Vitamin D3 and calcium to prevent hip fractures in elderly women. N Engl J Med. 1992;327:1637–1642. doi: 10.1056/NEJM199212033272305. [DOI] [PubMed] [Google Scholar]
- 16.Lips P, Wiersinga A, van Ginkel FC, Jongen JM, Netelenbos JC, Hackeng W. The effect of vitamin D supplementation on vitamin D status and parathyroid function in elderly subjects. J Clin Endocrinol Metab. 1988;67:644–650. doi: 10.1210/jcem-67-4-644. [DOI] [PubMed] [Google Scholar]
- 17.Teitelbaum SL, Halverson JD, Baates M, Wise L, Haddad J. Abnormalities of circulating 25-OH vitamin D after jejunal bypass for obesity: Evidence of an adaptive response. Ann Intern Med. 1977;86:289–293. doi: 10.7326/0003-4819-86-3-289. [DOI] [PubMed] [Google Scholar]
- 18.Compston JE, Vedi S, Ledger JE, Webb A, Gazet JC, Pilkington T. Vitamin D status and bone histomorphometry. Am J Clin Nutr. 1981;34:2359–2363. doi: 10.1093/ajcn/34.11.2359. [DOI] [PubMed] [Google Scholar]
- 19.Rickers H, Christiansen C, Balslev I, Rodbro P. Impairment of vitamin D metabolism and bone mineral content after intestinal bypass surgery. Scand J Gastroenterol. 1984;19:184–189. [PubMed] [Google Scholar]
- 20.Bell NH, Epstein S, Greene A, Shary J, Oexmann MJ, Shaw S. Evidence for alteration of the vitamin D-endocrine system in obese subjects. J Clin Invest. 1985;76:370–373. doi: 10.1172/JCI111971. [DOI] [PMC free article] [PubMed] [Google Scholar]
- 21.Bell NH, Epstein S, Shary J, Greene V, Oexmann MJ, Shaw S. Evidence of a probable role for 25-hydroxyvitamin D in the regulation of calcium metabolism in man. J Bone Miner Res. 1988;3:489–495. doi: 10.1002/jbmr.5650030503. [DOI] [PubMed] [Google Scholar]
- 22.Liel Y, Ulmer E, Shary J, Hollis BW, Bell N. Low circulating vitamin D in obesity. Calcif Tissue Int. 1988;43:199–201. doi: 10.1007/BF02555135. [DOI] [PubMed] [Google Scholar]
- 23.Wortsman J, Matsuoka L, Chen T, Lu Z, Holick M. Decreased bioavailability of vitamin D in obesity. Am J Clin Nutr. 2000;72:690–693. doi: 10.1093/ajcn/72.3.690. [DOI] [PubMed] [Google Scholar]
- 24.Arunabh S, Pollack S, Yeh J, Aloia J. Body fat content and 25-hydroxyvitamin D levels in healthy women. J Clin Endocrinol Metab. 2003;88(1):157–161. doi: 10.1210/jc.2002-020978. [DOI] [PubMed] [Google Scholar]
- 25.Dawson-Hughes B, Harris S, Dallal G. Plasma calcidiol, season and serum parathyroid hormone concentrations in healthy elderly men and women. Am J Clin Nutr. 1997;65:67–71. doi: 10.1093/ajcn/65.1.67. [DOI] [PubMed] [Google Scholar]
- 26.Barger-Lux MJ, Heaney RP, Dowell S, Chen TC, Holick M. Vitamin D and its major metabolites: serum levels after graded oral dosing in healthy men. Osteoporos Int. 1998;8:222–230. doi: 10.1007/s001980050058. [DOI] [PubMed] [Google Scholar]
- 27.Flegal KM, Carroll MD, Ogden CL, Johnson C. Prevalence and trends in obesity among US adults, 1999−2000. JAMA. 2002;288:1723–1727. doi: 10.1001/jama.288.14.1723. [DOI] [PubMed] [Google Scholar]
- 28.Preece MA, O'Riordan JL, Lawson DE, Kodicek E. A competitive protein-binding assay for 25-dihydroxycholecalciferol and 25-hydroxyergocalciferol in serum. Clin Chem Acta. 1974;54:235–242. doi: 10.1016/0009-8981(74)90241-1. [DOI] [PubMed] [Google Scholar]
- 29.Goussous R, Song L, Dallal G, Dawson-Hughes B. Lack of effect of calcium intake on the 25-hydroxyvitamin D response to oral vitamin D3. J Clin Endocrinol Metab. 2005;90:707–711. doi: 10.1210/jc.2004-1380. [DOI] [PubMed] [Google Scholar]
- 30.Scragg R, Holdaway I, Singh V, Metcalf P, Baker J, Dryson E. Serum 25 hydroxyvitamin D3 is related to physical activity and ethnicity but not to obesity in a multicultural workforce. Aust N Z J Med. 1995;25:218–223. doi: 10.1111/j.1445-5994.1995.tb01526.x. [DOI] [PubMed] [Google Scholar]
- 31.National Institutes of Health Clinical guidelines on the identification, evaluation and treatment of overweight and obesity in adults- The Evidence Report. Obes Res. 1998:51S. [PubMed] [Google Scholar]
- 32.Janssen I, Katzmarzyk PT, Ross R. Body mass index, waist circumference, and health risk: evidence in support of current National Institutes of Health guidelines. Arch Intern Med. 2002;162:2074–2079. doi: 10.1001/archinte.162.18.2074. [DOI] [PubMed] [Google Scholar]
- 33.Mawer EB, Backhouse J, Holman CA, Lumb GA, Stanbury S. The distribution and storage of vitamin D and its metabolites in human tissues. Clin Sci. 1972;43:414–431. doi: 10.1042/cs0430413. [DOI] [PubMed] [Google Scholar]
- 34.Rosenstreich SJ, Rich C, Volwiler W. Deposition in and release of vitamin D3 from body fat: Evidence for a storage site in the rat. J Clin Invest. 1971;50:679–687. doi: 10.1172/JCI106538. [DOI] [PMC free article] [PubMed] [Google Scholar]
- 35.MacLaughlin JA, Holick M. Aging decreases the capacity of skin to produce vitamin D3. J Clin Invest. 1985;76:1536–1538. doi: 10.1172/JCI112134. [DOI] [PMC free article] [PubMed] [Google Scholar]
- 36.Dawson-Hughes B. Racial/Ethnic considerations in making recommendations for vitamin D for adult and elderly men and women. Am J Clin Nutr. 2004;80(suppl):1763S–6S. doi: 10.1093/ajcn/80.6.1763S. [DOI] [PubMed] [Google Scholar]
- 37.Clemens TL, Zhou XY, Myles M, Endres D, Lindsay R. Serum vitamin D2 and vitamin D3 metabolite concentrations and absorption of vitamin D2 in elderly subjects. J Clin Endocrinol Metab. 1986;63:656–660. doi: 10.1210/jcem-63-3-656. [DOI] [PubMed] [Google Scholar]
- 38.Holick MF. Vitamin D requirements for the elderly. Clin Nutr. 1986;5:121–129. [Google Scholar]
- 39.Harris SS, Dawson-Hughes B. Plasma vitamin D and 25OHD responses of young and old men to supplementation with vitamin D3. J Am Coll Nut. 2002;21(4):357–362. doi: 10.1080/07315724.2002.10719235. [DOI] [PubMed] [Google Scholar]