

Abstract
Bilirubin may have a major role in the prevention of cardiovascular disease based on recent data regarding its anti-oxidant properties. We determined the relationship between total serum bilirubin and vascular reactivity in a large cohort of individuals with diabetes, a disease associated with known oxidant stress. We studied 302 individuals: 52 controls, 37 with type 1 diabetes, 213 with type 2 diabetes. High-resolution ultrasound was used to measure flow-mediated dilation (FMD; endothelium-dependent) and nitroglycerin-induced dilation (NID, endothelium-independent) of the brachial artery. Laser Doppler perfusion imaging was used to measure microvascular reactivity in the forearm skin before and after iontophoresis of acetylcholine (endothelium-dependent) and sodium nitroprusside (endothelium-independent). Bilirubin levels were higher in the type 2 diabetes group (0.71 ± 0.34 mg/dl) compared to controls (0.56 ± 0.26 mg/dl, p < 0.0001). A weak inverse correlation was observed between bilirubin and FMD (r = -0.125, p = 0.032) and skin endothelium-dependent vasodilation (r = -0.157, p = 0.019). In multivariate analyses, however, these correlations were not statistically significant. There is no association between bilirubin levels and vascular reactivity in the macro- and microcirculation of individuals with diabetes. Bilirubin, therefore, does not correlate with predictors of cardiovascular risk in the diabetic population.
Keywords: bilirubin, diabetes, endothelial function
Introduction
Diabetes can promote and perpetuate oxidative stress through multiple mechanisms including hyperglycemia and increased free fatty acids. As oxidative stress has been implicated in the pathogenesis of the microvascular and macrocirculatory complications of diabetes, the therapeutic role of antioxidants in ameliorating these effects has been an area of intense research.1
Bilirubin, once thought to be toxic, has been recently found to have potent antioxidant properties.2 In both in vitro and in vivo models, bilirubin has demonstrated potent antiinflammatory effects such as the inhibition of lipid peroxidation.3,4 Recent human studies have shown that higher bilirubin levels correlate with better cardiovascular outcomes, suggesting that bilirubin has important physiological properties. In people with Gilbert’s syndrome, which causes mild hyperbilirubinemia, the prevalence of ischemic heart disease was found to be only 2% compared to 12% in the general population.5 In the Framingham offspring study, higher serum bilirubin levels correlated with a decreased risk of cardiovascular disease in men.6 Furthermore, in the Framingham Heart Study, individuals homozygous for the UGT1A1*28 allele, which causes increased serum bilirubin levels, had a lower risk of cardiovascular disease.7 In the National Health and Nutrition Examination Survey, increased serum total bilirubin levels were associated with reduced peripheral arterial disease.8 Finally, in normal healthy individuals, low serum bilirubin levels correlated with predictors of cardiovascular disease such as impaired flow-mediated dilation and increased carotid intima-media thickness.9 In aggregate, these findings suggest that increased bilirubin levels decrease the risk of developing cardiovascular disease in normal individuals.
The role of bilirubin in people with diabetes is less clear. Thus far, the majority of human studies involving bilirubin and cardiovascular outcomes have been in people without diabetes and as a result, the role of bilirubin as an antioxidant in diabetes is unknown. The main aim of this cross-sectional study was to determine the relationship between serum bilirubin and markers of cardiovascular risk (such as endothelium-dependent vasodilation) in individuals with type 1 diabetes, individuals with type 2 diabetes, and healthy controls. Our main hypothesis was that bilirubin would be protective of vascular function in individuals with diabetes in both the micro- and macrocirculations.
Research design and methods
Study participants
We included 302 individuals who were divided into four groups: 52 control individuals, 37 with type 1 diabetes (T1 DM), and 213 with type 2 diabetes (T2 DM). There were 42 individuals in the T2 DM group who had vascular complications of diabetes such as coronary artery disease, carotid artery disease, or peripheral vascular disease. Participants were identified as having T1 DM or T2 DM according to the American Diabetes Association (ADA) criteria.10 Although some of the individuals had participated in other research studies, none of the findings of the present research study is previously published. All participants gave written informed consent for our protocols, which had the approval of the institutional review board of the Beth Israel Deaconess Medical Center.
Selection and exclusion criteria
Individuals aged 21-80 years old were included in the study. Healthy participants underwent an oral glucose tolerance test to exclude subclinical diabetes prior to being enrolled in our study. Patients with T1 DM or T2 DM with no known serious long-term complications were included if the diagnosis of diabetes had been clearly established prior to study enrollment according to ADA criteria.10 All participants were clinically screened for liver disease and were excluded if they had any overt signs and symptoms of liver disease or if aspartate aminotransferase (AST), alanine aminotransferase (ALT), and alkaline phosphatase (Alk phos) were more than twice the upper limit of normal for our lab. Other exclusion criteria were: smoking during the prior 6 weeks, congestive heart failure, cardiac arrhythmias, stroke or transient ischemic attack, end stage renal failure, uncontrolled hypertension, severe dyslipidemia, or any other severe chronic medical condition requiring active treatment. Furthermore, in order to avoid influence on brachial artery diameter by antihypertensive or lipid-lowering medications,11 we selected individuals with documented blood pressure and lipid control who had been on stable treatment over the prior 6 months.
Clinical measurements
All clinical examinations and evaluations were conducted at the Beth Israel Deaconess Medical Center during the morning hours after an overnight fast. The participants were abstinent from alcohol or vigorous exercise 24 hours prior to testing. Vital signs were measured by experienced physicians and nurses. Each individual underwent a thorough medical history and physical examination by a licensed physician.
Blood samples were obtained using the standard sterile technique from the antecubital vein. Plasma glucose, total serum cholesterol, and triglycerides were measured using the Synchoron CX analyzer (Beckman Systems, Fullerton, CA, USA). High-density lipoprotein (HDL) serum cholesterol was measured directly (Sigma, St Lois, MO, USA) and low-density lipoprotein (LDL) was calculated. The glycated hemoglobin (HbA1c) was measured in whole blood with ion-exchange high-performance liquid chromatography. Complete blood count (CBC) and total bilirubin were measured at the Beth Israel Deaconess Medical Center’s core laboratory using standard laboratory techniques.
Vascular reactivity measurements
All vascular reactivity measurements were made while the participants were fasting during the morning hours of testing. All studies were performed in temperature-controlled rooms (24-26°C). The vascular reactivity of the skin microcirculation was measured using laser Doppler flowmetry before and after the iontophoresis of acetylcholine (Ach; endothelium-dependent vasodilation) and sodium nitroprusside (SNp; endothelium-independent vasodilation). All measurements were taken from the ventral surface of the forearm. The reproducibility of this technique has been previously described.12 The coefficient of variation of the baseline measurement was 14.1% and during maximal hyperemic response after iontophoresis it was 13.7%.13
Vascular reactivity of the macrocirculation was measured in the brachial artery using a high-resolution ultrasound with a 10.0 MHz linear array transducer and an HDI Ultramark 9 system (Advanced Technology Laboratories, Bothel, WA, USA). To measure endothelial-dependent vasodilation, the brachial artery diameter was measured before and after flow-mediated dilation (FMD) during reactive hyperemia. Reactive hyperemia was accomplished by inflating a pneumatic tourniquet distal to the brachial artery to 50 mmHg above systolic blood pressure for 5 minutes and then deflating it. This method has been described previously.14 All techniques were performed according to published guidelines.15
To measure endothelial-independent vasodilation, the brachial artery width was measured before and after administration of systemic sublingual nitroglycerin (400 μg). All ultrasound images of nitroglycerin-induced dilation (NID) were analyzed by experienced personnel in the lab.
The common carotid artery (CCA) intima-media thickness (IMT) was measured according to previously described methods using the same high-resolution ultrasound equipment that was used for measuring the brachial artery reactivity.16 Briefly, the protocol included scanning of the CCA, carotid bulbs, and proximal internal carotid artery. All IMT measurements (both baseline and follow-up) were made at the same site and angle for each participant and were carried out by an experienced examiner. Ultrasound images were recorded on super-VHS videotape and read by a single reader.
Statistical analysis
The Minitab 15 statistical package (Minitab, State College, PA, USA) for personal computers was used for the statistical analysis. For normally distributed data, the analysis of variance (ANOVA) was used followed by the Fisher’s test to identify differences between groups. For non-parametrically distributed data, the Kruskal-Wallis test was used. For analysis of correlation between variables the Pearson correlation test was employed for normally distributed data. For non-parametric data, the Spearman correlation test was used. The contribution of bilirubin and other factors in the variation of vascular reactivity measurements was assessed by univariate and multivariate regression analysis.
Results
A total of 302 individuals were included in the analysis. There were 52 control individuals. A total of 37 individuals had T1 DM and 213 had T2 DM. Of the 213 individuals with T2 DM, 42 had vascular complications of diabetes defined as coronary artery disease, carotid artery disease, or peripheral vascular disease. The baseline demographics of all the groups are described in Table 1. Biochemical data, including liver function tests, complete blood counts, and lipid panels were collected from all participants. A total of 223 participants completed evaluations of the skin microcirculation using laser Doppler flowmetry before and after the iontophoresis of Ach and SNp. The common carotid artery IMT was evaluated in 134 participants (29 controls and 105 T2 DM patients). The vascular reactivity of the brachial artery and common carotid artery IMT measurements of all the groups are described in Table 2.
Table 1.
Clinical characteristics of participants
| Control (C) | Type 1 diabetes (T1 DM) | Type 2 diabetes (T2 DM) | |
|---|---|---|---|
| n | 52 | 37 | 213 |
| Age (years)a | 50 ± 11 | 54 ± 9 | 56 ± 10 |
| Male | 24 (46%) | 27 (73%) | 129 (61%) |
| Diabetes duration (years)b | N/A | 30 ± 13 | 8 ± 8 |
| BMI (kg/m2)c | 29.6 ± 6.6 | 30.1 ± 6.2 | 33.0 ± 8.1 |
| Systolic blood pressure (mmHg)d | 126 ± 20 | 144 ± 22 | 136 ± 19 |
| Diastolic blood pressure (mmHg) | 76 ± 10 | 76 ± 9 | 79 ± 10 |
| HbA1c (%)d | 5.4 ± 0.4 | 8.5 ± 1.9 | 7.6 ± 1.5 |
| Fasting glucosed | 81 ± 11 | 179 ± 120 | 151 ± 57 |
| Total cholesterol (mg/dl) | 201 ± 41 | 181 ± 41 | 193 ± 41 |
| LDL cholesterol (mg/dl)e | 119 ± 34 | 100 ± 33 | 111 ± 36 |
| HDL cholesterol (mg/dl)f | 57 ± 20 | 57 ± 17 | 49 ± 12 |
| Triglycerides (mg/dl)f | 127 ± 65 | 124 ± 86 | 181 ± 109 |
| Total bilirubinf | 0.56 ± 0.26 | 0.46 ± 0.16 | 0.71 ± 0.34 |
| Alk phos (IU/l)g | 75 ± 20 | 87 ± 23 | 75 ± 26 |
| ALT (IU/l) | 22 ± 10 | 27 ± 16 | 25 ± 10 |
| AST (IU/l) | 23 ± 6 | 25 ± 11 | 24 ± 7 |
| HCT (%)f | 38.6 ± 6.0 | 37.6 ± 5.0 | 40.9 ± 5.2 |
| Hb (g/dl) | 13.5 ± 1.3 | 12.9 ± 1.9 | 14.2 ± 6.1 |
| RBC (m/μl)h | 4.6 ± 0.5 | 4.3 ± 0.6 | 4.7 ± 0.6 |
| MCH (pg) | 29.5 ± 2.8 | 29.7 ± 1.7 | 29.4 ± 2.2 |
| MCV (fl) | 86 ± 8 | 87 ± 5 | 87 ± 7 |
| Platelet count (K/μl)i | 288 ± 73 | 269 ± 67 | 249 ± 73 |
| Creatinine (mg/dl)j | 0.9 ± 0.2 | 1.3 ± 0.7 | 0.9 ± 0.3 |
Data are means ± standard deviation.
BMI, body mass index; HbA1c, glycated hemoglobin; LDL, low-denisty lipoprotein; HDL, high-density lipoprotein; Alk phos, alkaline phosphatase; ALT, alanine aminotransferase; AST, aspartate aminotransferase; HCT, hematocrit; Hb, hemoglobin; RBC, red blood cell; MCH, mean corpuscular hemoglobin; MCV, mean corpuscular volume.
C versus T2 DM, p = 0.002
T1 DM versus T2 DM, p < 0.0001
C and T1 DM versus T2 DM, p = 0.004
C versus T1 DM and T2 DM, T1 DM versus T2 DM, p < 0.0001
C versus T1 DM, p = 0.04
C and T1 DM versus T2 DM, p < 0.0001
C and T2 DM versus T1 DM, p = 0.03
C and T2 DM versus T1 DM, p = 0.001
C versus T2 DM, p = 0.001
C and T2 DM versus T1 DM.
Table 2.
Vascular reactivity of the brachial artery (as measured by flow-mediated dilation and nitroglycerin-induced dilation) and common carotid artery intima-media thickness measurements of individuals in the control, type 1 diabetes (T1 DM), and type 2 diabetes (T2 DM) groups
| Control | T1 DM | T2 DM | |
|---|---|---|---|
| Flow-mediated dilation (% change from baseline)a | 6.86 ± 3.42 | 5.56 ± 2.187 | 5.28 ± 2.62 |
| Nitroglycerin-induced dilation (% change from baseline)b | 16.61 ± 5.64 | 12.35 ± 3.32 | 13.50 ± 5.95 |
| Common carotid artery intima-media thickness (mm)c | 0.73 ± 0.09 | N/A | 0.80 ± 0.12 |
p = 0.002, control vs T1 DM and T2 DM
p = 0.001, control vs T1 DM and T2 DM
p = 0.006.
Alkaline phosphatase tended to be higher in the T1 DM group when compared with the control and T2 DM groups (Table 1, p = 0.03). ALT and AST levels were similar among all three groups (Table 1). There were no differences in hemoglobin levels between the three groups. Hematocrit, however, was higher in the T2 DM group compared to control and T1 DM groups (Table 1, p < 0.0001). Red blood cell counts were lowest in the T1 DM group compared to the control and T2 DM groups (Table 1, p = 0.001). The T2 DM group had lower platelet counts compared to the control group (Table 1, p = 0.001). Total bilirubin levels were higher in participants who had T2 DM compared to control and T1 DM groups (Table 1 and Figure 1, p < 0.0001). Endothelium-dependent and independent vasodilation was impaired in both the macrocirculation (as measured by FMD and NID) and the microcirculation (as measured by the iontophoresis of Ach and SNp) in the groups with diabetes when compared to controls (Figure 2). Baseline brachial artery width prior to FMD were similar between the control, T1 DM and T2 DM groups (3.80 ± 0.77 mm, 3.91 ± 0.74 mm, and 3.96 ± 0.70 mm respectively, p = 0.33). Baseline brachial artery width measurements prior to NID were also similar between all three groups (3.76 ± 0.76 mm, 3.92 ± 0.72 mm, 3.95 ± 0.72 mm respectively, p = 0.26).
Figure 1.
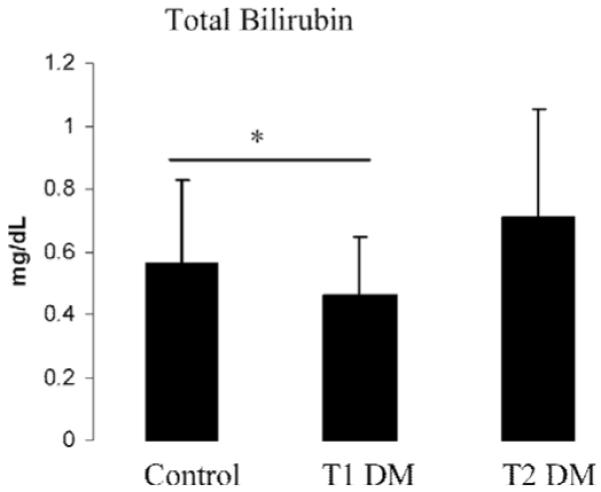
Total bilirubin levels were increased in the individuals with type 2 diabetes (T2 DM) when compared to healthy controls and individuals with type 1 diabetes (T1 DM). Results are presented as means ± SD. *Control and T1 DM vs T2 DM, p < 0.0001.
Figure 2.
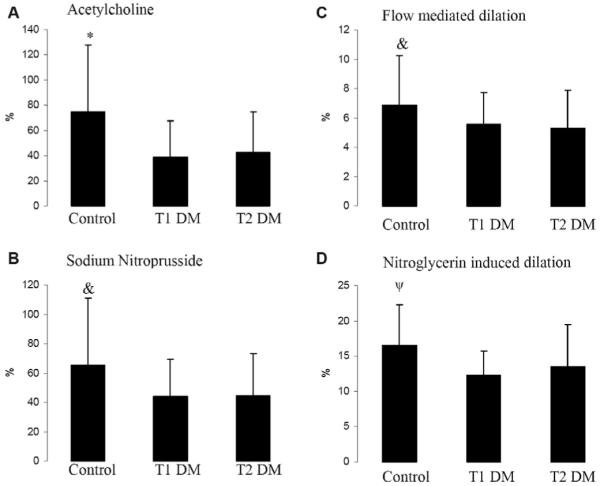
The skin perfusion response to iontophoresis of acetylcholine (endothelium-dependent vasodilation in the microcirculation) and sodium nitroprusside (endothelium-independent vasodilation in the microcirculation), and the brachial artery diameter change in response to reactive hyperemia (flow-mediated dilation, endothelium-dependent vasodilation in the macrocirculation) and nitroglycerin (nitroglycerin-induced dilation, endothelium-independent vasodilation in the macrocirculation) in controls, individuals with type 1 diabetes (T1 DM), and individuals with type 2 diabetes (T2 DM). Compared with controls, all groups with diabetes had impaired endothelium-dependent and independent vasodilation in both the macro (FMD and NID) and microcirculations (Ach and SNp). Results are presented as percent increase over baseline and expressed as means ± SD. *Control versus T1 DM and T2 DM, p < 0.0001; &: Control versus T1 DM and T2 DM, p = 0.002; ψ: Control versus T1 DM and T2 DM, p = 0.001.
The relationship between total bilirubin levels and vascular reactivity, and clinical, metabolic, and biochemical parameters is shown in Table 3. Total bilirubin inversely correlated weakly with FMD (r = -0.125, p = 0.032) and skin endothelium-dependent vasodilation after iontophoresis of Ach (r = -0.157, p = 0.019) when all participants were analyzed. However, when multivariate analysis was performed that included all factors that contributed to the variation of the endothelium-dependent macro- and microcirculation, bilirubin was found to be a non-significant contributor to the variation of both the above measurements (Table 4). Independent variables were included in the model if p was < 0.020 in the Pearson correlation.
Table 3.
Correlation of total bilirubin levels (T. Bili) to various relevant parameters in all individuals (including controls), individuals with type 1 diabetes (T1 DM), and individuals with type 2 diabetes (T2 DM)
| All individuals | T1 DM | T2 DM | |
|---|---|---|---|
| T. Bili | T. Bili | T. Bili | |
| % change FMD | -0.125 (0.032) | -0.052 (0.763) | -0.053 (0.450) |
| % change NID | -0.060 (0.333) | -0.157 (0.390) | -0.088 (0.234) |
| % change Ach | -0.157 (0.019) | -0.128 (0.465) | -0.214 (0.008) |
| % change SNp | -0.100 (0.137) | -0.060 (0.731) | -0.103 (0.206) |
| Age | -0.004 (0.959) | -0.100 (0.556) | 0.012 (0.857) |
| BMI | -0.126 (0.027) | 0.061 (0.720) | -0.239 (0.000) |
| Hemoglobin | 0.189 (0.001) | 0.450 (0.005) | 0.163 (0.017) |
| Hematocrit | 0.434 (0.000) | 0.447 (0.006) | 0.427 (0.000) |
| RBC | 0.401 (0.000) | 0.505 (0.001) | 0.384 (0.000) |
Data are r (p).
FMD, flow-mediated dilation; NID, nitroglycerin-induced dilation; Ach, acetylcholine; SNp, sodium nitroprusside; BMI, body mass index; RBC, red blood cell.
Table 4.
Multiple linear regression model of several relevant parameters on endothelium-dependent vasodilation in the (A) macrocirculation (FMD) and (B) microcirculation (Ach)
| Predictor | Coefficient | SE coefficient | t | p |
|---|---|---|---|---|
| (A) | ||||
| Age | -0.067 | 0.016 | -4.13 | <0.0001 |
| Sex | 0.132 | 0.378 | 0.35 | 0.727 |
| T. Bili | -0.347 | 0.586 | -0.59 | 0.554 |
| ALT | -0.025 | 0.0148 | -1.70 | 0.090 |
| HCT | -0.061 | 0.034 | -1.82 | 0.070 |
| Platelet | 0.003 | 0.002 | 1.19 | 0.233 |
| (B) | ||||
| Age | -0.653 | 0.260 | -2.51 | 0.013 |
| Sex | 3.629 | 5.198 | 0.70 | 0.486 |
| T. Bili | 1.280 | 8.077 | 0.16 | 0.874 |
| ALT | -0.391 | 0.328 | -1.19 | 0.235 |
| AST | -0.354 | 0.467 | -0.76 | 0.449 |
| HCT | -1.334 | 0.431 | -3.10 | 0.002 |
| Platelet | 0.031 | 0.033 | 0.92 | 0.361 |
Total bilirubin levels do not have an effect on FMD and Ach in these models.
SE, standard error; T. Bili, total bilirubin; ALT, alanine aminotransferase; HCT, hematocrit; AST, aspartate aminotransferase.
The effects of age and sex on the relationship between total bilirubin and vascular function were also assessed. Men have higher bilirubin levels than women (0.72 ± 0.34 versus 0.57 ± 0.28 mg/dl, p< 0.0001) and age negatively correlated with both FMD and Ach (Table 4). However, there was no effect modification by sex or age on the relationship between bilirubin and vascular measures when age, sex, total bilirubin, age × bilirubin, and sex × bilirubin were included in the regression model (FMD, r = 0.303, p = NS; Ach, r = 0.327, p = NS). There was also no correlation between age and total bilirubin levels (Table 3).
When only control individuals were analyzed, total bilirubin negatively correlated with FMD (r = -0.35, p = 0.015) but did not correlate with NID, Ach, or SNp. When age, BMI, and sex were included in the model, total bilirubin levels still negatively correlated with FMD (r = -0.37, p = 0.017).
In all individuals, no significant correlations were observed between bilirubin and NID (r = -0.060, p = 0.333) and SNp iontophoresis (r = -0.100, p = 0.137). A weak, non-significant, positive correlation was observed between the common carotid artery IMT and serum bilirubin levels (r = 0.139, p = 0.115). Similar results were observed when all diabetic participants were analyzed separately and when each diabetic group was analyzed separately (data not shown).
Discussion
The main findings of this study were that despite the published literature in non-diabetic patients, and the observation that bilirubin levels are elevated in diabetes, vascular function in patients with diabetes appears independent of total bilirubin levels. Bilirubin did not correlate with predictors of cardiovascular risk such as vascular reactivity, including both endothelium-dependent and independent vasodilation, and common carotid artery IMT. Thus, total bilirubin does not seem to have any beneficial effect on vascular reactivity in individuals with diabetes despite the fact that bilirubin levels were higher in these groups. This is a novel finding and contrary to published findings in the cardiovascular literature which suggest that bilirubin improves vascular reactivity and cardiovascular risk in people without diabetes.5,6,9
The exact mechanisms for how bilirubin protects against cardiovascular disease are still under investigation. However, previous studies have shown that bilirubin and biliverdin, an intermediate product in the metabolism of heme, prevent lipid peroxidation in vitro.2 As oxidation of LDL has been implicated in the pathogenesis of atherosclerosis,17 bilirubin’s antioxidant effects on LDL have been of particular interest. Thus, it is currently believed that bilirubin may be protective against atherosclerosis because it prevents or ameliorates oxidation of LDL and subsequent plaque formation.
The role of bilirubin in diabetes has not been clearly defined and the currently available data are limited and contradictory. In vitro studies have suggested that bilirubin may act as a pro-oxidant in endothelial cells exposed to glucose.18,19 Our results suggest that in diabetes, bilirubin may not have an antioxidant effect, contrary to the findings in the cardiovascular literature. The reasons for this discrepancy are not clear. Bilirubin may be induced by deleterious stressors and therefore may just be a marker for inflammation. Alternatively, it is possible that although bilirubin still exerts its antioxidant effect, the oxidative stress induced by diabetes outstrips the effects of bilirubin. However, the finding of an inverse correlation between bilirubin and endothelium-dependent vasodilation in both macro- and microcirculation and a positive, although non-significant, correlation with carotid IMT in univariate analysis raises the question of whether higher levels of bilirubin are associated with a deterioration in endothelial function in diabetes. Further studies will be needed to clarify the relationship between bilirubin and cardiovascular disease in people with diabetes.
Even within our control individuals, however, we found a negative correlation between bilirubin and FMD, which contradicts prior studies.9 The sample sizes for our subset analyses were small, which may account for the differences in our findings from the published literature. In addition, the older age of our cohort compared with prior studies9 may have also affected the outcome.
Bilirubin was higher in the T2 DM group when compared to both the control and the T1 DM groups. It is possible that non-alcoholic fatty liver disease that is related to T2 DM may have been the primary reason for these observed results, although we excluded clinical evidence of liver disease from our study. As our selection criteria excluded all participants with liver function tests that were twice or more than the normal limits for our lab, there were no differences in the liver function tests among all three groups. In addition, there were no indications of increased hemolysis, as best seen by the results of full blood count analysis where hematocrit, if anything, was higher in these two groups, probably the result of treatment with diuretics. Reduced renal excretion of bilirubin cannot also be the driving force, as patients with clinical renal failure were excluded and the creatinine levels in these two groups were similar to the control group and lower than that of T1 DM patients. In addition, of the 200-400 mg of bilirubin produced a day, only about 0-4 mg is excreted through the kidneys.20 Therefore, we believe that the above factors, namely increased heme metabolism related to increase red cell turnover and subclinical abnormalities in liver function, are probably not responsible for the observed results.
Bilirubin levels were measured only once in the present study and it is conceivable that a single measurement does not reflect the average bilirubin levels over long periods of time that are required for the development of cardiovascular disease. However, to our knowledge, there are no data available regarding fluctuation and changes in bilirubin levels. The current consensus is that in the general population, bilirubin levels remain stable over relatively long periods of time. We would also like to emphasize that our endpoints, especially the vascular reactivity measurements measuring vascular function, can change over short periods of time in response to changes to oxidative stress and therefore should have been affected by recent changes in bilirubin levels.21-23 As a result, we believe that despite its limitations, the current study has the ability to provide reliable results in an area that is grossly understudied and can provide the impetus for additional studies that will focus on these subjects in a more detailed way.
The present study has its limitations. As with any study of patients with disease, residual confounding may be present and unrecognized. For example, T2 DM may be a marker of an unfit population. However, as all of our research was conducted in our lab using the same methodology, we believe that the study design has not limited the extraction of reliable unbiased results. We also realize that we have included surrogate measurements of cardiovascular disease and not clinical outcomes and, as a result, it may be claimed that the observed associations between bilirubin and vascular reactivity may not predict cardiovascular outcomes in individuals with diabetes. Although this is a possibility, we would like to point out that FMD has been correlated with cardiovascular outcomes and that carotid IMT and microcirculation vascular reactivity measurements are currently considered as adequate surrogate measurements and are regularly employed as main endpoints in clinical research.21-24
In summary, in the present study, we did not find a relationship between bilirubin levels and measures of vascular reactivity in the macro- and microcirculation in individuals with diabetes. Vascular function in diabetes appears independent of bilirubin levels, although the underlying mechanisms require further study.
Acknowledgements
The present study was an investigator-initiated research protocol and was supported by clinical research grants to Aristidis Veves, MD from Parker Davis Inc., Pfizer, Inc., Novartis and the NIH (R01 HL75678) and to Atul Malhotra, MD from the NIH (R01-HL73146) and an Established Investigator Award from the American Heart Association. Additional support was also provided by the National Sleep Foundation’s Pickwick Fellowship to Susie Yim Yeh, MD and the NIH grant RR 01032 to the Beth Israel Deaconess Medical Center General Clinical Research Center.
Contributor Information
Susie Yim Yeh, Sleep Disorders Program, Brigham and Women’s Hospital, Harvard Medical School.
John Doupis, Joslin Diabetes Center.
Shilpa Rahangdale, Sleep Disorders Program, Brigham and Women’s Hospital, Harvard Medical School.
Samuel Horr, Microcirculation Laboratory, Beth Israel Deaconess Medical Center, Harvard Medical School.
Atul Malhotra, Sleep Disorders Program, Brigham and Women’s Hospital, Harvard Medical School.
Aristidis Veves, Microcirculation Laboratory, Beth Israel Deaconess Medical Center, Harvard Medical School.
References
- 1.Yim S, Malhotra A, Veves A. Antioxidants and CVD in diabetes: where do we stand now. Curr Diab Rep. 2007;7:8–13. doi: 10.1007/s11892-007-0003-9. [DOI] [PMC free article] [PubMed] [Google Scholar]
- 2.Stocker R, Yamamoto Y, McDonagh AF, Glazer AN, Ames BN. Bilirubin is an antioxidant of possible physiological importance. Science. 1987;235:1043–1046. doi: 10.1126/science.3029864. [DOI] [PubMed] [Google Scholar]
- 3.Wu TW, Fung KP, Wu J, Yang CC, Weisel RD. Antioxidation of human low density lipoprotein by unconjugated and conjugated bilirubins. Biochem Pharmacol. 1996;51:859–862. doi: 10.1016/0006-2952(95)02395-x. [DOI] [PubMed] [Google Scholar]
- 4.Wu TW, Fung KP, Yang CC. Unconjugated bilirubin inhibits the oxidation of human low density lipoprotein better than Trolox. Life Sci. 1994;54:477–481. doi: 10.1016/0024-3205(94)90140-6. [DOI] [PubMed] [Google Scholar]
- 5.Vitek L, Jirsa M, Brodanova M, et al. Gilbert syndrome and ischemic heart disease: a protective effect of elevated bilirubin levels. Atherosclerosis. 2002;160:449–456. doi: 10.1016/s0021-9150(01)00601-3. [DOI] [PubMed] [Google Scholar]
- 6.Djousse L, Levy D, Cupples LA, Evans JC, D’Agostino RB, Ellison RC. Total serum bilirubin and risk of cardiovascular disease in the Framingham offspring study. Am J Cardiol. 2001;87:1196–1200. A4, 7. doi: 10.1016/s0002-9149(01)01494-1. [DOI] [PubMed] [Google Scholar]
- 7.Lin JP, O’Donnell CJ, Schwaiger JP, et al. Association between the UGT1A1*28 allele, bilirubin levels, and coronary heart disease in the Framingham Heart Study. Circulation. 2006;114:1476–1481. doi: 10.1161/CIRCULATIONAHA.106.633206. [DOI] [PubMed] [Google Scholar]
- 8.Perlstein TS, Pande RL, Beckman JA, Creager MA. Serum total bilirubin level and prevalent lower-extremity peripheral arterial disease: National Health and Nutrition Examination Survey (NHANES) 1999 to 2004. Arterioscler Thromb Vasc Biol. 2008;28:166–172. doi: 10.1161/ATVBAHA.107.153262. [DOI] [PubMed] [Google Scholar]
- 9.Erdogan D, Gullu H, Yildirim E, et al. Low serum bilirubin levels are independently and inversely related to impaired flow-mediated vasodilation and increased carotid intimamedia thickness in both men and women. Atherosclerosis. 2006;184:431–437. doi: 10.1016/j.atherosclerosis.2005.05.011. [DOI] [PubMed] [Google Scholar]
- 10.American Diabetes Association Diagnosis and classification of diabetes mellitus. Diabetes Care. 2007;30(suppl 1):S42–S47. doi: 10.2337/dc07-S042. [DOI] [PubMed] [Google Scholar]
- 11.Economides PA, Caselli A, Tiani E, Khaodhiar L, Horton ES, Veves A. The effects of atorvastatin on endothelial function in diabetic patients and subjects at risk for type 2 diabetes. J Clin Endocrinol Metab. 2004;89:740–747. doi: 10.1210/jc.2003-031116. [DOI] [PubMed] [Google Scholar]
- 12.Veves A, Saouaf R, Donaghue VM, et al. Aerobic exercise capacity remains normal despite impaired endothelial function in the micro- and macrocirculation of physically active IDDM patients. Diabetes. 1997;46:1846–1852. doi: 10.2337/diab.46.11.1846. [DOI] [PubMed] [Google Scholar]
- 13.Caballero AE, Arora S, Saouaf R, et al. Microvascular and macrovascular reactivity is reduced in subjects at risk for type 2 diabetes. Diabetes. 1999;48:1856–1862. doi: 10.2337/diabetes.48.9.1856. [DOI] [PubMed] [Google Scholar]
- 14.Celermajer DS, Sorensen KE, Gooch VM, et al. Noninvasive detection of endothelial dysfunction in children and adults at risk of atherosclerosis. Lancet. 1992;340:1111–1115. doi: 10.1016/0140-6736(92)93147-f. [DOI] [PubMed] [Google Scholar]
- 15.Corretti MC, Anderson TJ, Benjamin EJ, et al. Guidelines for the ultrasound assessment of endothelial-dependent flow-mediated vasodilation of the brachial artery: a report of the International Brachial Artery Reactivity Task Force. J Am Coll Cardiol. 2002;39:257–265. doi: 10.1016/s0735-1097(01)01746-6. [DOI] [PubMed] [Google Scholar]
- 16.O’Leary DH, Polak JF, Wolfson SK, Jr, et al. CHS Collaborative Research Group Use of sonography to evaluate carotid atherosclerosis in the elderly. The Cardiovascular Health Study. Stroke. 1991;22:1155–1163. doi: 10.1161/01.str.22.9.1155. [DOI] [PubMed] [Google Scholar]
- 17.Berliner JA, Watson AD. A role for oxidized phospholipids in atherosclerosis. N Engl J Med. 2005;353:9–11. doi: 10.1056/NEJMp058118. [DOI] [PubMed] [Google Scholar]
- 18.Chen S, Khan ZA, Barbin Y, Chakrabarti S. Pro-oxidant role of heme oxygenase in mediating glucose-induced endothelial cell damage. Free Radic Res. 2004;38:1301–1310. doi: 10.1080/10715760400017228. [DOI] [PubMed] [Google Scholar]
- 19.Cohen G, Livovsky DM, Kapitulnik J, Sasson S. Bilirubin increases the expression of glucose transporter-1 and the rate of glucose uptake in vascular endothelial cells. Rev Diabet Stud. 2006;3:127–133. doi: 10.1900/RDS.2006.3.127. [DOI] [PMC free article] [PubMed] [Google Scholar]
- 20.Cameron JL, Pulaski EJ, Abei T, Iber FL. Metabolism and excretion of bilirubin-C14 in experimental obstructive jaundice. Ann Surg. 1966;163:330–338. doi: 10.1097/00000658-196603000-00002. [DOI] [PMC free article] [PubMed] [Google Scholar]
- 21.Gokce N, Keaney JF, Jr, Hunter LM, Watkins MT, Menzoian JO, Vita JA. Risk stratification for postoperative cardiovascular events via noninvasive assessment of endothelial function: a prospective study. Circulation. 2002;105:1567–1572. doi: 10.1161/01.cir.0000012543.55874.47. [DOI] [PubMed] [Google Scholar]
- 22.Gokce N, Keaney JF, Jr, Hunter LM, et al. Predictive value of noninvasively determined endothelial dysfunction for long-term cardiovascular events in patients with peripheral vascular disease. J Am Coll Cardiol. 2003;41:1769–1775. doi: 10.1016/s0735-1097(03)00333-4. [DOI] [PubMed] [Google Scholar]
- 23.Shimbo D, Grahame-Clarke C, Miyake Y, et al. The association between endothelial dysfunction and cardiovascular outcomes in a population-based multi-ethnic cohort. Atherosclerosis. 2007;192:197–203. doi: 10.1016/j.atherosclerosis.2006.05.005. [DOI] [PubMed] [Google Scholar]
- 24.Yeboah J, Crouse JR, Hsu FC, Burke GL, Herrington DM. Brachial flow-mediated dilation predicts incident cardiovascular events in older adults: the Cardiovascular Health Study. Circulation. 2007;115:2390–2397. doi: 10.1161/CIRCULATIONAHA.106.678276. [DOI] [PubMed] [Google Scholar]