Abstract
Objective
This study was designed to investigate automated pressure-controlled discography (APCD) findings, to calculate the elastance of intervertebral discs, and to assess the relationship between the calculated elastance and disc degeneration.
Methods
APCD was performed in 19 patients. There were a total of 49 intervertebral discs treated. Following intradiscal puncture, a dye was constantly injected and the intradiscal pressure was continuously measured. The elastance of the intervertebral disc was defined as unit change in intradiscal pressure per fractional change in injected dye volume. Disc degeneration was graded using a modified Dallas discogram scale.
Results
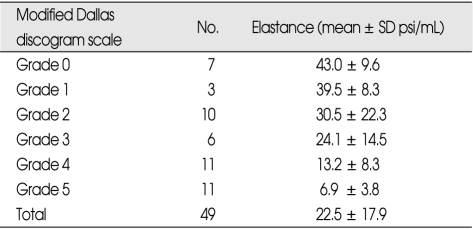
The mean elastance was 43.0 ± 9.6 psi/mL in Grade 0, 39.5 ± 8.3 psi/mL in Grade 1, 30.5 ± 22.3 psi/mL in Grade 2, 30.5 ± 22.3 psi/mL in Grade 3, 13.2 ± 8.3 psi/mL in Grade 4 and 6.9 ± 3.8 psi/mL in Grade 5. The elastance showed significant negative correlation with the degree of degeneration (R2 = 0.529, p = 0.000).
Conclusion
APCD liberates the examiner from the data acquisition process during discography. This will likely improve the quality of data and the reliability of discography. Elastance could be used as an indicator of disc degeneration.
Keywords: Low back pain, Spinal pain, Discography, Diagnosis, Medical device
INTRODUCTION
Discogenic pain is one of the most common sources of low back pain (LBP)1,17,18). However, its diagnosis is not straightforward due to symptomatic similarities to other somatic pain. Not all patients with discogenic pain present with the whole spectrum of clinical signs and symptoms helpful in differentiation from other sources of LBP. Recently, the advent of high resolution magnetic resonance imaging (MRI) and computerized tomography (CT) has enabled physicians to observe detailed morphological abnormalities inside the spinal canal, and to more easily create a pathophysiological hypothesis of the cause of spinal pain16,22). However, abnormal MRI findings are often inconsistent with symptoms, and disc herniation and extrusions are often observed in asymptomatic volunteers3). Furthermore, even high resolution MRI is technologically insufficient to visualize intradiscal derangements.
Despite a history of controversy, the use of discography has recently been highlighted in difficult cases when the sources of pain are suspected of being discogenic. Discography can provoke injection-related pain responses which are identical or similar to LBP symptoms. However, the utility is limited as these responses can be reproduced in asymptomatic subjects or selected patients without LBP, leading to false positive results7). Therefore, the validity and reliability of discography have been questioned6). As it is critical to avoid false positive results in LBP diagnosis, many factors have been studied in the interpretation of discography, including an abnormal psychometric test, low-pressure dye injection and the pain threshold5,9). However, the risk of false positive result remains similar. The current discography technique has inherent drawbacks, which may produce false results. For example, fast manual injection can evoke unwanted pain resulting in a false positive result19). Therefore, if injection speed is set slow and constant, false positive results may be reduced. The conventional technique demands a high amount of examiner labor in the injection of the dye, the collection of visual analog scale (VAS) scores, the recording of intradiscal pressure and the observation of fluoroscopic findings. In addition, due to manual recording, data can be unreliable between examiners. For these reasons, the authors refined pressure-controlled discography by automation of the injection control and the measurement of intradiscal pressure and pain response. The refined technique was named automated pressure-controlled discography (APCD). This study was designed to; 1) investigate APCD findings, 2) to calculate the elastance of intervertebral discs, and 3) to assess the relationship between the calculated elastance and disc degeneration.
MATERIALS AND METHODS
Patient population
A total of 49 intervertebral discs from 19 patients with clinically suspected discogenic pain were included in this study. Approval for this study was granted by the Institutional Review Board of Presbyterian Medical Center (Jeonju, Republic of Korea). There were 16 males and 3 females, ranging in age from 23 to 55 years, with a mean age of 39.6 years. All patients had more than six months of unremitting LBP or radicular pain despite appropriate conservative management. Symptom duration prior to discography ranged from 6 months to 10 years. Indications for APCD included; 1) other diagnostic tests have failed to reveal confirmation of a suspected disc as the source of pain, 2) recurrent herniated lumbar disc, 3) to determine the primary symptomatic disc in multi-level herniated lumbar disc, and 4) unremitting with normal MRI findings. Three patients showing normal MRI findings were included in this study because their pain pattern was very similar to discogenic pain. Informed consent was obtained from all patients. All patients underwent MRI within six months prior to APCD procedure.
APCD system
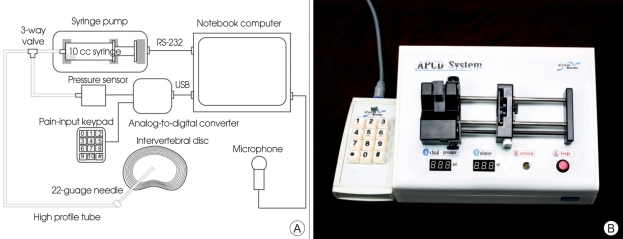
A conceptual overview of the APCD system is presented in Fig. 1. The system consists of a syringe pump, pressure sensor, pain-input keypad, microphone, analog-to-digital converter, data-processing software and notebook computer. The computer-controlled syringe pump (NE 510, New Era Pump Systems, Wantagh, NY, USA) can infuse at a pressure as high as 150 psi. The pressure sensor (Model 206, Setra, Boxborough, MA, USA) has a pressure range of 0 - 250 psi. The analog-to-digital converter (USB6009, National Instruments, Austin, TX, USA) digitalizes the analog signal from the pressure sensor. The patient's self-manipulating pain-input keypad records pain intensity in the VAS. Screaming sounds from sudden pain are collected by the microphone. The data-processing software was designed with a data logger program, (LabView 7, National Instruments, Austin, TX, USA) which processes data, controls the syringe pump, displays real-time information (Fig. 2A) and retrieves past data (Fig. 2B).
Fig. 1.
Schematic representation of the automated pressure-controlled discography system (A) and the device (B). The syringe pump, pressure sensor and needle are connected together by the high profile tube. The syringe pump is controlled by the computer via the RS-232 port. Data from the pressure sensor and the pain-input keypad are transmitted to the computer via the analog-to-digital converter. The voice signal is recorded by the microphone.
Fig. 2.
Snapshots of the software. A : Data acquisition screen. The volume-pressure curve (white curve), numerical rating scores (red curve) and sound curve (green curve) are shown together. The slope of the white curve is steep while a contrast material is filling the needle (a). After checking the static opening pressure (*), the slope becomes more gentle (b). In this case, a patient screamed from back pain at the point of 0.7cc injected. At this point the green curve fluctuates (c) and the red curve increases by 5 levels (d). Other control buttons are arranged in right side of the screen. Pr : intradiscal pressure, V : injected volume, VAS : visual analog scale, Po : static opening pressure, dP : pressure difference, dP = Pr-Ps, Snd : sound intensity. B : Data access screen. Saved data can be retrieved for review or analysis. Raw data which are used for data analysis are presented in right lower side.
APCD procedure
The needle insertion technique was identical to conventional discography. All patients were requested not to take pain medications on the day of the procedure. The patient was instructed to manipulate the pain-input keypad to report their pain intensity. After placing the patient prone on a radiolucent table, the lower back was prepared and draped in sterile fashion. A normal reference segment was targeted first. A fluoroscope (BV Pulsera, Phillips Medical Systems, Eindhoven, Netherlands) was adjusted to visualize the intervertebral space in antero-posterior view. It was then inclined until the superior articular process tip was placed at the center of the intervertebral space. A 22-guage, 6-inch needle was introduced just anterior to the process and parallel with fluoroscopic beam. The needle tip was finally secured in the exact center of the intervertebral space on the antero-posterior and lateral views. A 10-cc, luer-lock syringe was filled with a dye (Omnipaque, GE Healthcare, Oslo, Norway) and the syringe hub was then connected to the pressure sensor and the needle hub using a three-way stopcock (Fig. 1). Injection speed was set to 0.5 cc/min in all patients. Then intradiscal pressure (Pr) and injected volume (V) were measured in real time. When the first dye appeared at the needle tip on fluoroscopic imaging, the opening pressure button was pressed. Then, injection was temporarily stopped for measurement of the static opening pressure (Fig. 2A). When the intradiscal pressure declined to its plateau, the pressure was set as the static opening pressure (Po). The static opening pressure represents the inherent intradiscal pressure of an individual intervertebral disc. During the procedure, the intradiscal pressure and injected contrast material volume were plotted on a volume-pressure graph (Fig. 2A). The recorded voice signal and VAS were also observed concurrently with the volume-pressure graph (Fig. 2A). If the intradiscal pressure exceeded 50 psi above the static opening pressure, or if the volume exceeded 3.5 cc, an alarm bell rang and the injection sequence was automatically halted. The sequence could also be manually terminated for severe pain (VAS > 8). All data were automatically saved in a file. Following the APCD procedure, post-discography CT was performed in all patients. The mean time to perform APCD for each intervertebral disc was 15 minutes.
Pain response
Pain response was classified according to Derby et al.10) A positive response was defined as concordant or similar pain with pain intensity ≥ 6/10 on the VAS at pressures ≤ 50 psi above the static opening pressure and total injected volumes ≤ 3.5 mL. A negative response was assigned for no pain, discordant pain, pain with pain intensity ≤ 6/10 VAS or pain at pressures ≥ 50 psi above the static opening pressure.
Elastance of the intervertebral disc
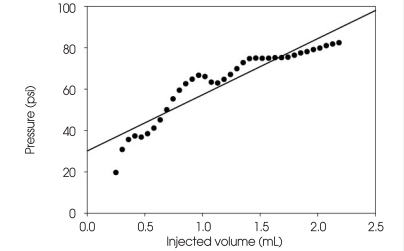
Elastance is defined as unit change in pressure per fractional change in volume. The elastance of an intervertebral disc was arbitrarily defined as unit change in intradiscal pressure per fractional change in injected contrast volume. This was calculated using linear regression analysis of a volume-pressure curve (Fig. 3).
Fig. 3.
The elastance of an intervertebral disc. In this graph the slope, which is calculated by a linear regression analysis, is 27.2. This is regarded as the elastance of the intervertebral disc (Y = 27.2X + 30.1, R2 = 0.871, p = 0.000).
Grade of disc degeneration
A post-discography CT was performed in all patients. Disc degeneration was graded using a modified Dallas discogram scale : Grade 0 : contrast medium confined to a normal nucleus pulposus; Grade 1 : radial tears confined to the inner third of the annulus fibrosis; Grade 2 : radial tears extending to the middle third of the annulus fibrosis; Grade 3 : a radial tear extending to the outer third of the annulus fibrosis; Grade 4 : a Grade 3 tear with dissection into the outer third of the annulus to involve more than 30 degrees of the disc circumference; Grade 5 : any full-thickness tear with extra-annular contrast leakage. Post-discography CT findings were reviewed by the corresponding author (DAS) and confirmed by the first author (HIK) blind to clinical information.
Treatment outcome
Patients who underwent surgery after discography were asked to choose one of four possible responses based on their satisfaction with surgical treatment : Excellent : no pain; Good : occasainoal back or leg pain, no change of work; Fair : frequent back or leg pain, some change of work; Poor : disabling pain, long-term medication.
Statistical analysis
To calculate the elastance of an intervertebral disc and to evaluate the relationship between the elastance and the modified Dallas discogram scale, statistical analysis was performed via linear regression analysis using SPSS 12.0 (SPSS, Chicago, IL, USA). Statistical significance was achieved if the calculated probability was less than 5%.
RESULTS
Pain response
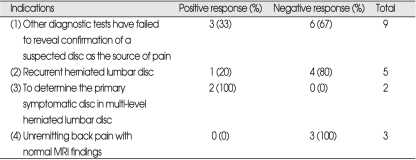
Pain responses are summarized in Table 1. Patients in whom other diagnostic tests have failed to reveal confirmation of a suspected disc as the source of pain showed negative responses in 67% of cases. Patients who had recurrent herniated lumbar discs showed negative responses in 80% of cases, while patients who had unremitting back pain with normal MRI findings showed negative responses in 100% of cases. On the other hand, positive responses were confirmed in 33% of patients who had an abnormal MRI with incongruent clinical patterns, 20% of patients with recurrent herniated lumbar discs, and 100% of patients with multi-level herniated lumbar discs.
Table 1.
Pain response by indication
Volume-pressure curve
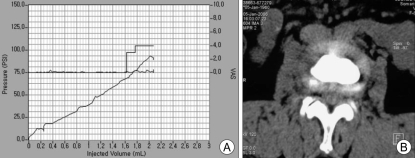
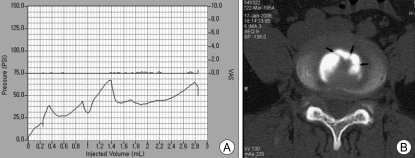
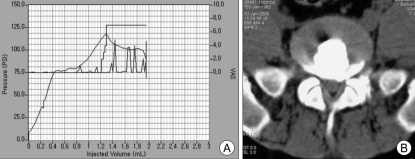
The volume-pressure curve consists of a steep phase, a drop phase and a more gentle phase that is dependent on the extent of degeneration (Fig. 2A). The intradiscal pressure increased steeply while dye filled the needle canal (steep phase). When the injection was held at the time of dye emergence at the needle tip, the intradiscal pressure dropped and then leveled off at the static opening pressure (drop phase). Following restarting the injection, the volume-pressure curves showed two different patterns (gentle phase), one uniform (n = 21) and the other irregular (n = 28). Uniform patterns showed linear volume-pressure curves (Fig. 4). Irregular patterns had bent volume-pressure curves (Fig. 5A). In one case a zigzagging volume-pressure curve was found in the evaluation of an intervertebral disc. Post-discography CT showed a septated nucleus pulposus (Fig. 5B). The zigzagging pattern was possibly due to the pressure dropping at each phase of passing the septa. In the case of an intervertebral disc with annular disruption, elevated intradiscal pressure dropped abruptly and severe back pain developed when contrast material leaked posteriorly through the annular fissure (Fig. 6).
Fig. 4.
Uniform pattern. A : The slope of volume-pressure curve was calculated to be 45.0 by linear regression analysis. B : Post-discography computerized tomography scan shows confined contrast medium in the nucleus pulposus.
Fig. 5.
Irregular pattern of an intervertebral disc with a multi-septated nucleus pulposus. A : The volume-pressure curve shows an irregular pattern. B : The post-discography computerized tomography scan shows septa (arrow) in the nucleus pulposus. The pressure likely dropped at each phase of passing through the septa.
Fig. 6.
Irregular pattern of an intervertebral disc with annular fissuring. A : The steep volume-pressure curve abruptly drops at the point of severe pain occurrence. At that time, dye leakage into the spinal canal was noticed on fluoroscopic imaging (not shown here). B : A post-discography computerized tomography scan shows annular disruption compatible with Grade 4 in the modified Dallas discogram scale.
Comparison of elastance with disc degeneration
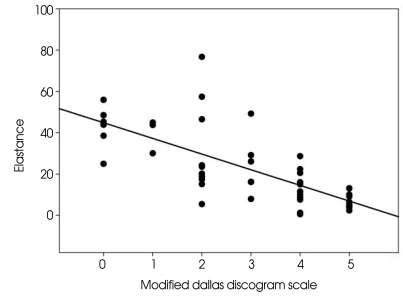
The relationship between the elastance and the modified Dallas discogram scale is summarized in Table 2. The elastance showed significant negative correlation with the modified Dallas discogram scale (Fig. 7). These results indicate that degenerated intervertebral discs are less elastic than normal discs.
Table 2.
Elastance and the modified Dallas discogram scale
Grade 0 : contrast medium confined to a normal nucleus pulposus; Grade 1 : radial tears confined to the inner third of the annulus fibrosis; Grade 2 : radial tears extending to the middle third of the annulus fibrosis; Grade 3 : a radial tear extending to the outer third of the annulus fibrosis; Grade 4 : a Grade 3 tear with dissection into the outer third of the annulus to involve more than 30 degrees of disc circumference; Grade 5 : any full-thickness tear with extra-annular contrast leakage
Fig. 7.
Elastance showed significant negative correlation with the modified Dallas discogram scale (Y = -7.583X + 44.8, R2 = 0.529, p = 0.000).
Treatment outcome
Among 5 patients with positive response, 3 patients underwent discectomy and 2 patients underwent lumbar fusion. All patients showed excellent results.
APCD-related complications
The procedure was performed without side effects in all patients. There were no episodes of infection or other complications.
DISCUSSION
Though discography was first introduced in the 1940s by Lindblom, its role has been controversial for many years11,13). Discography is often reported to be unreliable, however it has undergone many technical refinements in the past 30 years. Criteria for diagnosing a positive discogram have also been changed. In addition, discography has been used to demonstrate disc morphology such as herniation, extrusion and a nonspecific pain response. Currently, discography combined with CT (post-discography CT), has the ability to demonstrate changes in internal disc architecture2,21). Pain responses concordant with symptoms are regarded as positive regardless of morphological abnormalities shown in discograms or post-discography CT7,9,15). High resolution MRI or CT techniques are excellent for visualizing morphological changes in the spinal canal12,14). Still, they are insufficient in demonstrating the fine architecture of intervertebral discs or acquiring physiological pain responses. For these reasons, discography armed with pressure-controlled techniques was developed to refine the technique8,9,20).
Provocative discography can categorize pain responses based on discogenic pain mechanisms and decrease false positive results. However, the validity of provocative discography as a diagnostic test in chronic LBP remains unproven; several studies have demonstrated that false positive responses can be induced in selected patients without low back symptoms4). Therefore, it has been suggested that low pressure injection would effectively eliminate the risk of significant pain from injection in asymptomatic individuals9). Recently, Seo et al.19) reported that injection speed is a confounding factor in the misinterpretation of discography. High speed intradiscal injection appears to increase the peak dynamic pressure, leading to an increased false positive rate19). They suggest that injection speed should be controlled to increase accuracy19). Discography also demands a high amount of human labor in the asking and recording of VAS pain scores, concordance of pain and pressure changes. Moreover, because of manual recording, data cannot be retrieved after the procedure. Therefore, other techniques are required to complement current discography.
APCD can control injection speed from 0.3 to 1.0 cc/min at four stages. Once the speed is set, injection speed is constant. Therefore, APCD can provide constant fluid delivery to reduce differences between maximal peak and static opening pressures, and hence reduce false positive or negative pain responses. It also minimizes examiner variation by eliminating examiner partiality. APCD is designed not only to reduce error, but also to record critical data. Pain provocation and recording are vital. In APCD, pain provocation is checked by the patient's voice and VAS pain scores are directly input by the patient. Timing of pain provocation is also important in relation to changes in intradiscal pressure. After the procedure all data can be retrieved and analyzed to assess elastance and pressure curve patterns. We observed that the use of a computer does not require additional personnel.
Another contribution of APCD is that it can provide physiological data about disc degeneration. The angle of the pressure-volume curve statistically correlated to the degree of degeneration in our study. Elastance showed significant negative correlation with the modified Dallas discogram scale. Therefore, elastance, which shows the volume pressure relationship, can be easily measured with APCD. Furthermore, it can be meaningful to evaluate the degree of degeneration. When there are many confounding factors in morphological disc degeneration classification, elastance can clarify ambiguity, as it is unique physiological data.
Interestingly, we found the volume-pressure curve fluctuation comparable to dynamic or static opening pressure in 50% of the discs examined. These phenomena were more evident in Grade 2 or 3 disc disruptions, but not in Grade 5 disruptions. We assume that this phenomenon is attributable to the multi-layered annulus fibrosus. Once contrast media is injected, increased dye accumulation results in an intradiscal pressure rise. Subsequently, dye flow into the outer annulus layer can cause a temporary decrease in pain intensity. As further dye accumulates the pressure again increases until the flow can find a hole to break through. Once this happens, the pressure will decrease as dye drains into another outer layer. Similar mechanisms can act in multi-septated nucleus pulposus. Therefore, APCD can demonstrate contrast dye flow physiology in the disc.
The present study has several limitations. First, the measured intradiscal pressure is a dynamic pressure. Because the nucleus pulposus is a semi-solid material, the initially measured pressure decreases as the dye diffuses into the nucleus pulposus. However, static pressure cannot be measured continuously as the dye is infused. That is the reason why we used the dynamic pressure in this manuscript. Second, the intradiscal pressure was measured indirectly at one end of a three-way valve. This is identical to the intraluminal pressure of the syringe, but not exactly the same as the real intradiscal pressure. To measure the real pressure another puncture is needed. To avoid this we chose the indirect method. Third, the intradiscal pressure can vary with injection speed. Though the injection speed was set constant at 0.5 cc/mL, the best injection speed for APCD needs to be determined. Finally, although APCD is a useful tool to incorporate with current discography, it still requires revisions to become more user-friendly. For example, if a disc pressure sensor is designed and sized for implantation, it could record intradiscal pressure with movements or specific postures in real time. That data could provide a more precise understanding of disc biomechanics and exclude false positive responses. APCD still requires more research to reduce the probability of false responses.
CONCLUSION
APCD, featuring automated injection control and data measurement, sets a discographer free from data acquisition during discography. This will likely improve the quality of data and the reliability of discography. APCD well demonstrates real-time changes in pressure with contrast material injection, reflecting intradiscal status. APCD shows that volume-pressure curves are irregular in significant cases. The elastance defined as the slope of the volume-pressure curve might be used as an indicator of disc degeneration.
Acknowledgements
This study was supported by a grant of the Korea Healthcare technology R & D Project (A091220), Ministry for Health, Welfare & Family Affairs, Republic of Korea.
References
- 1.Bogduk N. Low back pain. In: Bogduk N, editor. Clinical anatomy of the lumbar spine and sacrum. London: Churchill Livingstone; 2002. pp. 187–213. [Google Scholar]
- 2.Bogduk N, Modic MT. Lumbar discography. Spine. 1996;21:402–404. doi: 10.1097/00007632-199602010-00031. [DOI] [PubMed] [Google Scholar]
- 3.Boos N, Rieder R, Schade V, Spratt KF, Semmer N, Aebi M. 1995 Volvo Award in clinical sciences. The diagnostic accuracy of magnetic resonance imaging, work perception, and psychosocial factors in identifying symptomatic disk herniations. Spine. 1995;20:2613–2625. doi: 10.1097/00007632-199512150-00002. [DOI] [PubMed] [Google Scholar]
- 4.Carragee EJ. Psychological and functional profiles in select subjects with low back pain. Spine J. 2001;1:198–204. doi: 10.1016/s1529-9430(01)00050-x. [DOI] [PubMed] [Google Scholar]
- 5.Carragee EJ, Alamin TF, Miller JL, Carragee JM. Discographic, MRI and psychosocial determinants of low back pain disability and remission : a prospective study in subjects with benign persistent back pain. Spine J. 2005;5:24–35. doi: 10.1016/j.spinee.2004.05.250. [DOI] [PubMed] [Google Scholar]
- 6.Carragee EJ, Lincoln T, Parmar VS, Alamin T. A gold standard evaluation of the "Discogenic pain" Diagnosis as determined by provocative discography. Spine. 2006;31:2115–2123. doi: 10.1097/01.brs.0000231436.30262.dd. [DOI] [PubMed] [Google Scholar]
- 7.Carragee EJ, Tanner CM, Khurana S, Hayward C, Welsh J, Date E, et al. The rates of false-positive lumbar discography in select patients without low back symptoms. Spine. 2000;25:1373–1380. doi: 10.1097/00007632-200006010-00009. discussion 1381. [DOI] [PubMed] [Google Scholar]
- 8.Carragee EJ, Tanner CM, Yang B, Brito JL, Truong T. False-positive findings on lumbar discography. Reliability of subjective concordance assessment during provocative disc injection. Spine. 1999;24:2542–2547. doi: 10.1097/00007632-199912010-00017. [DOI] [PubMed] [Google Scholar]
- 9.Derby R, Howard MW, Grant JM, Lettice JJ, Van Peteghem PK, Ryan DP. The ability of pressure-controlled discography to predict surgical and nonsurgical outcomes. Spine. 1999;24:364–371. doi: 10.1097/00007632-199902150-00014. discussion 371-372. [DOI] [PubMed] [Google Scholar]
- 10.Derby R, Lee SH, Kim BJ, Chen Y, Aprill C, Bogduk N. Pressure-controlled lumbar discography in volunteers without low back symptoms. Pain Med. 2005;6:213–221. doi: 10.1111/j.1526-4637.2005.05034.x. discussion 222-224. [DOI] [PubMed] [Google Scholar]
- 11.Holt EP., Jr The question of lumbar discography. J Bone Joint Surg Am. 1968;50:720–726. doi: 10.2106/00004623-196850040-00007. [DOI] [PubMed] [Google Scholar]
- 12.Lam KS, Carlin D, Mulholland RC. Lumbar disc high-intensity zone : the value and significance of provocative discography in the determination of the discogenic pain source. Eur Spine J. 2000;9:36–41. doi: 10.1007/s005860050006. [DOI] [PMC free article] [PubMed] [Google Scholar]
- 13.Lindblom K. Diagnostic punctire of intervertebral disks in sciatica. Acta Orthop Scand. 1948;17:231–239. doi: 10.3109/17453674808988943. [DOI] [PubMed] [Google Scholar]
- 14.Milette PC, Fontaine S, Lepanto L, Cardinal E, Breton G. Differentiating lumbar disc protrusions, disc bulges, and discs with normal contour but abnormal signal intensity. Magnetic resonance imaging with discographic correlations. Spine. 1999;24:44–53. doi: 10.1097/00007632-199901010-00011. [DOI] [PubMed] [Google Scholar]
- 15.O'Neill C, Kurgansky M. Subgroups of positive discs on discography. Spine. 2004;29:2134–2139. doi: 10.1097/01.brs.0000141169.15283.78. [DOI] [PubMed] [Google Scholar]
- 16.Ross JS, Modic MT, Masaryk TJ. Tears of the anulus fibrosus : assessment with Gd-DTPA-enhanced MR imaging. AJR Am J Roentgenol. 1990;154:159–162. doi: 10.2214/ajr.154.1.2136783. [DOI] [PubMed] [Google Scholar]
- 17.Saal JA. Natural history and nonoperative treatment of lumbar disc herniation. Spine. 1996;21:2S–9S. doi: 10.1097/00007632-199612151-00002. [DOI] [PubMed] [Google Scholar]
- 18.Schwarzer AC, Aprill CN, Derby R, Fortin J, Kine G, Bogduk N, et al. The prevalence and clinical features of internal disc disruption in patients with chronic back pain. Spine. 1995;20:1878–1883. doi: 10.1097/00007632-199509000-00007. [DOI] [PubMed] [Google Scholar]
- 19.Seo KS, Derby R, Date ES, Lee SH, Kim BJ, Lee CH. In vitro measurement of pressure differences using manometry at various injection speeds during discography. Spine J. 2007;7:68–73. doi: 10.1016/j.spinee.2006.05.013. [DOI] [PubMed] [Google Scholar]
- 20.Shin DA, HI K, Jung JH, Shin DG, JO L. Diagnostic relevance pof pressure-controlled discography. J Korean Med Sci. 2006;21:911–916. doi: 10.3346/jkms.2006.21.5.911. [DOI] [PMC free article] [PubMed] [Google Scholar]
- 21.Vanharanta H, Guyer RD, Ohnmeiss DD, Stith WJ, Sachs BL, Aprill C, et al. Disc deterioration in low-back syndromes. A prospective, multi-center CT/discography study. Spine. 1988;13:1349–1351. doi: 10.1097/00007632-198812000-00003. [DOI] [PubMed] [Google Scholar]
- 22.Yoshida H, Fujiwara A, Tamai K, Kobayashi N, Saiki K, Saotome K. Diagnosis of symptomatic disc by magnetic resonance imaging : T2-weighted and gadolinium-DTPA-enhanced T1-weighted magnetic resonance imaging. J Spinal Disord Tech. 2002;15:193–198. doi: 10.1097/00024720-200206000-00004. [DOI] [PubMed] [Google Scholar]


