

Abstract
Archived formalin-fixed, paraffin-embedded human tumors are widely available and represent a unique source of morphologically defined material. Formalin-fixed, paraffin-embedded tissue is known to contain a wealth of molecular information in the form of microRNAs (miRNAs), which could be correlated with clinical outcome for improved prognostication and/or treatment response. miRNAs are endogenous, noncoding RNAs (∼22 nucleotides) and may function as tumor suppressors or oncogenes. A reliable, robust methodology is needed to take full advantage of archived human cancers, especially for those where fresh-frozen tumor banks are unavailable, for example, malignant melanoma. To this end, we applied a simple-to-use protocol for extracting total RNA from various formalin-fixed, paraffin-embedded specimens (colon, liver, prostate, thyroid, uterus, and skin), optimized for small RNA recovery. Using a “poison primer” strategy (ie, primer silencing), we blocked the amplification of ribosomal RNA, enabling the successful sequencing of 17 novel and 53 known miRNAs (including small RNAs) from 10-year-old archived normal skin, cutaneous scalp melanoma, and sentinel lymph nodes (both negative and positive for metastasis) excised from a 52-year-old man. The cloning incidence provided an estimation of the level of specific miRNA expression, which was confirmed by Northern analysis and quantitative real-time polymerase chain reaction. This methodology can therefore be used to facilitate miRNA discovery from archived human cancers.
A vast archive of biopsy and excision specimens, processed for histological diagnosis, ie, formalin-fixed paraffin embedded (FFPE) material, exist in many departments of pathology worldwide. These specimens represent a unique source of morphologically defined and disease-specific samples, containing a wealth of molecular information that can be correlated with the clinical outcome to better predict cancer prognosis and/or treatment response. Although FFPE tumors are widely available, the use of these samples as the starting material for gene profiling experiments has significant limitations. Formalin fixation results in covalent modification of RNAs by adding a mono-methylol group to the bases, cross-linkage of nucleic acid to proteins and strand breakage, thereby making RNA extraction and quantification difficult.1,2,3,4,5 Even though, it is possible to measure mRNA levels in FFPE specimen,2,6,7,8,9 there is extensive degradation (often <300 bases in length) making gene expression analysis difficult.
In contrast to mRNAs, microRNAs (miRNAs) and other small RNAs are thought to be more stable in FFPE specimens.10,11 miRNAs are endogenous ∼22 nucleotide noncoding RNAs, which can play important regulatory roles in animals and plants by pairing to the mRNAs of target genes and specifying mRNA cleavage or repression of protein synthesis.12 Evidence is emerging that particular miRNAs may function as tumor suppressors and oncogenes13,14,15,16; suggesting that abnormal expression levels of certain miRNAs may play a role in human cancer pathogenesis. Accumulating evidence shows that changes in miRNA levels may accompany dysregulated growth and apoptosis in some cancers. For example, reductions in expression of miR-15a and miR-16, let-7a, or miR-143 and miR-145 have been reported in chronic lymphocytic leukemia,17 lung cancer,18 and colorectal neoplasia,19 respectively. Furthermore, miRNAs are amenable to be profiled in search of prognostic biomarkers,15,17,18,20,21 which can be identified by using microarray hybridization11,22 or size-fractioned cDNA library sequencing.23,24 The latter approach provides an opportunity for indentifying novel miRNAs21 or other small RNAs. Currently studies on miRNA expression profiles have used either cultured cells or fresh frozen tumors; no published methodology is available to sequence small RNAs directly from FFPE specimens. Devising such a protocol will be invaluable for cancers whose fresh frozen material is either unavailable or cancers that are too small, where most of the tissue sample is needed for the histological evaluation.
We devised and validated a robust, simple to use protocol for extracting total RNA from various FFPE specimens, optimized for small RNA recovery. To prove this concept, using our methodology, we characterized 53 known miRNAs and 17 novel miRNAs and other small RNAs. These miRNAs are well preserved in 10-year-old archived specimens and are differentially expressed according to disease progression in a patient with primary cutaneous melanoma.
Materials and Methods
Clinical Samples and Histological Analysis
We examined the efficiency of total RNA extraction from only FFPE specimens pertaining to the “normal,” tissue, ie, uninvolved by the tumor, derived from following excision specimens: hemicolectomy for adenocarcinoma (n = 2), partial liver resection for metastatic colon adenocarcinoma (n = 2), radical prostatectomy for adenocarcinoma (n = 2), hemithyroidectomy for Hurthle cell adenocarcinoma and multinodular goiter (n = 2), hysterectomy for leiomyomata (n = 2), and sentinel lymph node (SLN) biopsy (n = 2). Therefore, the epithelial source of the tissue types included colon, liver, prostate, thyroid, endometrium, skin and negative sentinel lymph node. The histological analysis was made by the diagnosing pathologist and then re-confirmed by a second pathologist (S.S.D.). For small RNA sequencing analysis, we used FFPE material pertaining to a melanoma wide local excision from the scalp of a 52-year-old man with sentinel lymph node biopsy performed in 1997; these specimens included “normal,” uninvolved skin, cutaneous melanoma, SLN negative and positive for metastasis. All of the tissue samples were from Stanford University, Medical Center Pathology archives, which were fixed and paraffin-embedded using standard procedures. This protocol was approved by the Institutional Review Board of the Stanford University Medical Center.
Small RNA Isolation and Cloning
Using a microtome (Leica RM2255, Leica Microsystems, Wetzlar, Germany), slices 10, 20, 40, 60, and 80 μm thick were obtained and transferred to 1.5-ml siliconized tubes, where the slices were twice incubated in 1 ml of xylene at 50°C for 5 minutes followed by centrifugation at 13,000 rpm. The pellets were washed twice in 1 ml of 100% ethanol and air-dried at room temperature. The dried pellets were incubated in 150 μl of 1X proteinase K digestion buffer (20 mmol/L Tris-HCl, pH 8.0; 1 mmol/L CaCl2, 0.5% sodium dodecyl sulfate), containing 400 μg/ml proteinase K at 55°C for 3 hours. Total RNA was extracted using the 1 ml TRIzol (Invitrogen, Carlsbad, CA) method according to the manufacturer's instructions and was precipitated by adding 10 μg of glycogen to 0.6 ml of isopropyl alcohol per sample, followed by incubation at −20°C for at least 1 hour and centrifugation at 12,000 × g for 10 minutes at 2–8°C. The pellet was washed in 1 ml of 100% ethanol, air-dried at room temperature, and dissolved in RNase-free water. The yield and quality [260/280 optical density (OD) ratios[of RNA product were measured by a spectrophotometer (Nanophotometer, Implen, Germany). Total RNA was also extracted using RecoverAll total nucleic acid isolation kit according to the instructions provided by manufacturer (Ambion, Austin, TX).
The cloning protocol was performed as described,21,23 with some modifications as described herein. Purified small RNAs were incubated with 10 μmol/L pre-adenylylated 3′-adaptor oligonucleotide (Linker-1, IDT Inc., Coralville, IA), 1X adenylate ligation buffer (ATP-free), 10% dimethyl sulfoxide, and 1 U of T4 RNA ligase (New England Biolabs, Ipswich, MA) at 37°C for 1 hour. The ligated product was purified on a 12% denaturing polyacrylamide gel, followed by a second ligase reaction with a 5′ adapter oligonucleotide, 5′-ACGGAATTCCTCACTaaa-3′ (uppercase, DNA; lowercase, RNA; ChemGenes Corporation, Wilmington, MA) and another gel purification. The doubly ligated purified RNA was reverse transcribed using 150 U of Superscript II (Invitrogen, Carlsbad, CA) and RT primer, 5′-ATTGATGGTGCCTACAG-3′. To block the synthesis of spurious ribosomal RNA, another oligo, 5′-/Bio/GGTGGTATGGCCGTAGAC/InvdT/-3′(poison primer), was added simultaneously to interfere with the synthesis of the most abundant ribosomal RNA degradation fragment (rGrTrCrTrArCrGrGrCrCrArTrArCrCrArCrC). Using the RT primer and a forward primer 5′-CAGCCAACGGAATTCCTCACTAAA-3, the cDNA was amplified in a polymerase chain reaction (PCR). A second PCR was performed using the RT primer and a second forward primer, 5′-GAGCCAACAGGCACCGAATTCCTCACTAAA-3′. The PCR product was gel-purified, phenol-extracted, ethanol-precipitated, and then digested with BanI (New England Biolabs). After further phenol extraction and ethanol precipitation, the digested products were concatemerized with T4 DNA ligase (New England Biolabs). Concatamers ranging from 600 to 1000 bp were isolated from a low melting point agarose gel, processed with Taq polymerase, and cloned into the pCR4-TOPO vector using the TOPO TA cloning kit (Invitrogen, Carlsbad, CA). Colony PCR was performed using the M13 forward and reverse primers, and the PCR products were purified using shrimp alkaline phosphatase and exonuclease I (USB Corporation, Cleveland, OH) and sequenced using T7 primer (MCLAB, South San Francisco, CA).
Sequence Analysis
Small RNAs obtained by cloning were compared with functionally annotated sequences using BLAST (blastn: http://www.ncbi.nlm.nih.gov/blast/ (As of April 1, 2009)), BLAT from the University of California at Santa Cruz (http://genome.ucsc.edu (As of April 1, 2009)), miRBase (http://microrna.sanger.ac.uk/sequences/search.shtml (As of April 1, 2009)), as well as standard text-matching routines. To assign a functional category, we used the best alignment for a functionally annotated sequence (not more than one error) for each small RNA (as of April 1, 09). The fold-back precursor structure of candidate miRNAs was predicted by mfold software.25
Northern Analysis
Four-microgram aliquots of total RNA were fractionated on denaturing 15% polyacrylamide gels followed by staining with ethidium bromide to determine RNA integrity. Overall RNA levels also served as internal loading controls. Gels were then destained, transferred to Hybond-N+ membranes (Amersham Biosciences, Piscataway, NJ) using semidry transfer (Hoefer Scientific Instruments, San Francisco, CA), and fixed by ultraviolet cross-linking at 1200 μJ and baking at 80°C for 1 hour. Membranes were hybridized overnight at 50°C in PerfectHyb Plus hybridization buffer (Sigma-Aldrich, St. Louis, MO), together with a LNA-modified oligonucleotide probe complementary to the mature hsa-let-7a (5′-AACTATACAACCTACTACCTCA-3′; bold, LNA; IDT) which was labeled with terminal transferase (NEB) and biotin-16-dUTP (Roche Diagnostics, Indianapolis, IN). Subsequently, the blots were washed at 50°C for 15 minutes each in 2X standard saline citrate/0.1% sodium dodecyl sulfate and 0.2X standard saline citrate/0.1% sodium dodecyl sulfate, followed by an incubation in blocking solution (1X phosphate-buffered saline, pH 7.4/0.05% Tween 20/0.1% sodium dodecyl sulfate/0.5% blocking reagent; Roche Diagnostics, Indianapolis, IN) for 1 hour and then in streptavidin-alkaline phosphatase conjugate (USB Corporation, Cleveland, OH) for 1 hour. After incubation, the blots were washed three times in buffer A (1X phosphate-buffered saline, pH 7.4/0.05% Tween 20/0.1% sodium dodecyl sulfate) and then three times in buffer B (0.1 mol/L Tris-HCl, pH 9.5; 0.1 mol/L NaCl). The blots were then incubated with chemiluminescent substrate CDP-Star (GE Health Care, Piscataway, NJ) and exposed to Kodak BioMax XAR film.
TaqMan miRNA Assay
The expression profile of hsa-let-7a, hsa-let-7e, and hsa-let-7i mature miRNA was measured in skin, cutaneous melanoma, SLN negative and SLN positive for metastasis using stem-loop primers for reverse transcription followed by real-time PCR (TaqMan microRNA assays; Applied Biosystems, Foster City, CA) in a 7500 fast sequence detection system (Applied Biosystems). RNA input was normalized using U6 snRNA.26 For each sample, 10 ng of total RNA were used for reverse transcription and 1.33 μl of 15 μl reverse transcription product was used for each quantitative real-time RT-PCR. All reactions were performed in triplicate.
Results
Optimizing Extraction Methodology for Small RNAs from Archival Specimens
We have modified a widely used total RNA extraction protocol27 for recovery of small RNAs from FFPE specimens. Critical step for effective small RNA recovery include two cycles of deparaffinization and the use of siliconized (in lieu of plastic) tubes throughout the process. If regular plastic tubes are used, small RNAs adhere to the sidewalls and are lost after each purification step (data not shown). Using the same FFPE lymph node, we examined the effects of homogenization (a tissue grinder) proteinase K preincubation before adding the TRIzol solution and RNA extraction (Figure 1A). Tissue slices at 20 μm and 40 μm were homogenized, preincubated in proteinase K, or both. The use of TRIzol and homogenization, without proteinase K preincubation, released no detectable RNA (Figure 1A, lanes 1 and 4). However, a combination of TRIzol with proteinase K preincubation was sufficient to release 5.04 and 11.36 μg of total RNA (Figure 1A, lanes 2 and 5), using 20 or 40 μm, respectively. Total RNA 260/280 OD ratios were consistently between 1.80 and 1.85, indicating high sample purity. In contrast, the samples extracted without proteinase K preincubation were of poorer quality (260/280 OD ratios between 1.20 and 1.37). Homogenization (lanes 3 and 6) did not significantly enhance the RNA yield, a step that can be omitted. Overall, proteinase K preincubation is necessary to release RNA from FFPE specimen.
Figure 1.
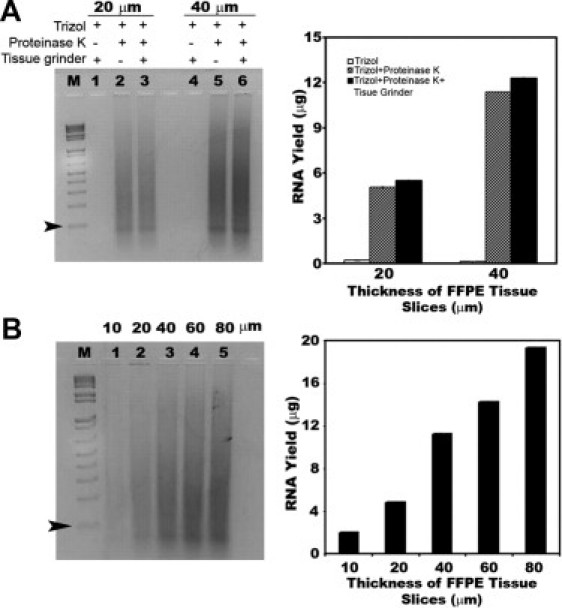
A method to yield a sufficient amount of total RNA from a FFPE lymph node. A: To compare different means of RNA extraction, the same lymph node paraffin block was tested with RNA from 20-μm (lanes 1–3) and 40-μm (lanes 4–6) slices resolved on 2% agarose gel electrophoresis, and the total RNA yield was quantified (adjacent graph). The use of TRIzol and tissue grinder, without proteinase K preincubation, released no detectable RNA (lanes 1 and 4). A combination of TRIzol with proteinase K preincubation was sufficient to release 5.04 and 11.36 μg of total RNA (lanes 2 and 5), using 20 or 40 μm, respectively. Additional use of the tissue grinder did not significantly enhance the RNA yield (lanes 3 and 6). B: When a range of thickness from the paraffin blocks (lanes 1–5 and adjacent graph) was tested using TRIzol with proteinase K preincubation, the 20-μm-thick section was sufficient to yield 4.76 μg of total RNA (lane 2). Each lane contains 50% of the total extracted RNA in A and 25% in B. Lane M represents a 1 kb plus DNA ladder (0.9 μg/lane). The smallest DNA fragment is 100 bp (arrowheads).
To define the capacity of the starting tissue thickness, a broad range of tissue slices (from 10 to 80 μm) were tested from the same lymph node block (Figure 1B). The RNA yield showed a linear relationship with the tissue slice. The 260/280 OD ratios were consistently in 1.80 to 1.85 range. A 20-μm slice was sufficient to obtain 4.8 μg of total RNA; however, thicker slices can be used in the same reaction volumes up to 80 μm without compromising the quantity or quality of the RNA.
In addition to lymph node, we examined the suitability of our methodology to extract RNA from a variety of tissue types: colon, liver, prostate, thyroid, endometrium, and skin (Figure 2, A and B). Since the specimens were of variable sizes, we normalized for the amount of tissue slice from the block before RNA isolation. Despite the comparable size, the RNA yield was somewhat variable, ranging from 2.5 to 27.1 μg; however, RNA quality was consistently high (Table 1). The histology of these blocks revealed that the amount of RNA extracted directly correlated with the amount of epithelial cells (data not shown). For example, the histology of both liver samples consisted of highly cellular sections of hepatic lobules, which resulted in the highest RNA yield compared with a thin layer of epidermal keratinocytes.
Figure 2.
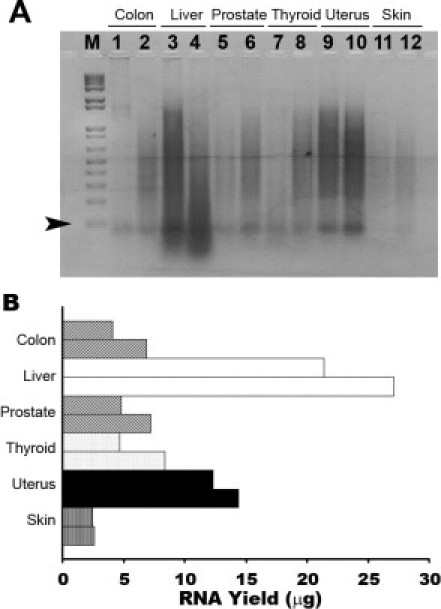
Total RNA can be efficiently released from a variety of FFPE organs. A: Two independent samples were tested with 20-μm slices from each organ: colon, liver, prostate, thyroid, uterus, and skin. Fifty percent of the total extracted RNA was loaded in each lane and resolved by 2% agarose gel electrophoresis. The M lane represents a 1 kb plus DNA ladder (0.9 μg/lane). The smallest DNA fragment is 100 bp (arrowhead). B: The RNA yield from each organ was variable but consistent within the organ.
Table 1.
Summary of Total RNA Yield and Quality Extracted from Various Tissues (n = 12)
| Tissue type (1 × 20 μm) | Yield (μg) | A260/A280 |
|---|---|---|
| Colon-1 | 4.1 | 1.6 |
| Colon-2 | 6.9 | 1.7 |
| Liver-1 | 27.1 | 1.8 |
| Liver-2 | 21.4 | 1.8 |
| Prostate-1 | 4.7 | 1.7 |
| Prostate-2 | 8.4 | 1.8 |
| Thyroid-1 | 4.8 | 1.6 |
| Thyroid-2 | 7.2 | 1.8 |
| Endometrium-1 | 12.3 | 1.8 |
| Endometrium-2 | 14.4 | 1.9 |
| Skin-1 | 2.6 | 1.6 |
| Skin-2 | 2.5 | 1.5 |
Comparison between RNA Extraction Methods
To compare the yield of total RNA released, we compared our method with a commercial kit (RecoverAll total nucleic acid isolation, Ambion, Austin, TX) using a sentinel lymph node FFPE block. Both gel electrophoresis and RNA quantification showed that our method resulted in three-fold higher yield compared with the commercial kit (Figure 3, A and B). RNA from both methods showed comparable quality. The 260/280 OD ratios of our method (OM)-1, OM-2, kit-1, and kit-2 are 1.86, 1.86, 2.00, and 1.90 respectively). To examine the relative fraction of small RNAs recovered by both methods, we measured the level of let-7a, and U6 (a 42-nucleotide small nuclear RNA) using quantitative real-time RT-PCR (Figure 3, C and D). Both let-7a and U6 showed very similar expression levels from both methods using equal amounts of total RNA. Given that our methodology obtained a threefold higher total RNA, it can recover a higher fraction of small RNAs.
Figure 3.
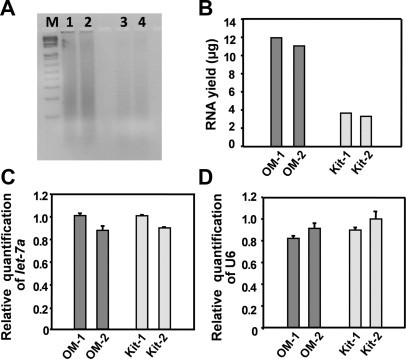
Comparison of reproducibility and yield of the new method with a commercial kit. A: A lymph node paraffin block was tested with RNA extracted from 20-μm slices using both our method and a commercial kit (RecoverAll, Ambion). Each experiment was performed in duplicate, and final RNA products were resolved by 2% agarose gel electrophoresis (1/3 of total product). Our method released significantly more total RNA (lanes 1 and 2) than a commercial kit (lanes 3 and 4). B: Our methodology (OM-1 and OM-2) resulted in an approximately three-fold higher yield of total RNA than the commercial method (Kit-1 and Kit-2). C: Quantitative real-time RT-PCR demonstrated a similar proportion of let-7a in total RNA by both RNA extraction methods. D: Similar results were demonstrated for U6 snRNA. Each PCR reaction was performed in triplicate. The error bars show standard deviations.
Feasibility of FFPE-Derived Small RNAs for Discovery and Expression Profiling
To analyze the small RNAs directly, we chose four blocks from the same individual: a 52-year old man with scalp primary cutaneous melanoma (PCM), Breslow's depth of 4.0 mm and Clark's level IV, who underwent a wide local excision and SLN biopsy in 1997. To evaluate the small RNAs involved in melanoma progression, the specimens included uninvolved skin >2.0 cm away from the primary tumor, residual PCM containing a piece of skeletal muscle, SLN negative (−SLN) for metastasis and positive (+SLN) for metastasis (Figure 4, A–D). Gel electrophoresis demonstrated significant RNA degradation (Figures 1 and 2), as expected. We prepared RNA libraries from the 18- to 25-nucleotide size range isolated from the +SLN block (Figure 4D). Sequence data analysis from such a library (n = 307) revealed significantly degraded ribosomal RNAs (rRNAs) and transfer RNAs (tRNAs) making up 83.5% of the RNA pool; the remainder 16.5% consisted of different classes of previously identified miRNAs and unknown small RNAs (Figure 5A). Sequence data consistently demonstrated the same unique rRNA fragment (5′-GUCUACGGCCAUACCACC-3′) accounting for 64.8% of all sequences (88.9% of rRNA sequences).
Figure 4.
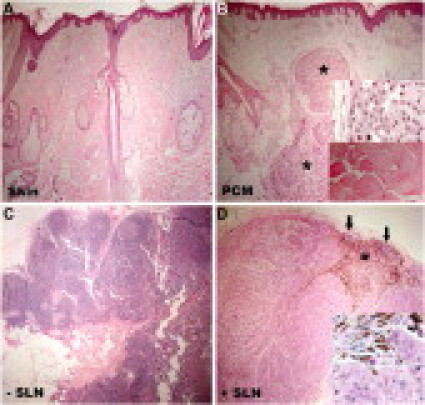
Histology of FFPE specimens evaluated for their small RNA profile. Samples were derived from a 52-year-old man with PCM, 4.0 mm and level IV, on the scalp and his sentinel nodes. A: Uninvolved skin >2.0 cm away from the primary tumor in a wide local excision. B: Residual primary melanoma (asterisks) in the wide local excision. The upper inset shows a high magnification of tumor cells and the lower inset shows a segment of skeletal muscle, identified on the slide, correlating with the expression of miR-1. C: SLN negative for metastasis. D: SLN positive for metastasis. A rim of nodal tissue remains (arrows) as the large metastatic tumor replaced the nodal architecture. A large focus of melanin pigment was identified (asterisk). The inset shows a high magnification of tumor cells. Original magnification: A–D, ×40; insets in B and D, ×400.
Figure 5.
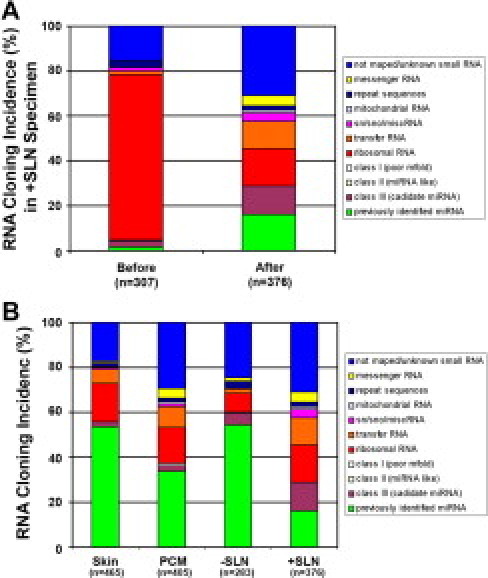
Illustration of small RNA cloning incidence in FFPE specimens. A: RNA cloning incidence of the sequenced fragments showed a high fraction (∼80%) of rRNA (red bar in +SLN, before) before adding a complimentary oligonucleotide sequence. Using this sequence, the synthesis of the rRNA fraction (∼20%) was reduced (red bar in +SLN, after) fourfold. This strategy uncovered a higher fraction of small RNAs for analysis. B: A summary of all RNA species is depicted in all four specimens: skin, PCM, −SLN, and +SLN.
To filter out this fragment before sequencing, complementary DNA oligonucleotide sequence was designed with blocking modification at both ends (5′ biotin and 3′ invert dT). Adding this oligonucleotide to the reverse transcription step together with the RT primer blocked the reverse transcription of this specific rRNA species. Using the +SLN block, we cloned and sequenced the small RNA library again to show a 4.5-fold reduction (from 73.9% to 16.6%) of rRNA incidence (Figure 5A, red bar) and a 9.8-fold enhancement (from 1.63% to 16.07%) of miRNAs (Figure 5A, green bar). Using the “poison primer” blocking strategy, we cloned and sequenced small RNA libraries from the remaining three FFPE specimens from the same patient: skin, PCM, and −SLN (Figure 5B).
From the four specimens, we obtained a total of 594 small RNA sequences, which represented 53 different previously known miRNAs (Table 2). The relative abundance (cloning incidence) demonstrated some unexpected findings for several miRNAs. Although miR-1 is exclusively expressed in skeletal muscle,28 it was cloned nine times (actual incidence) only from the PCM, while absent from skin, −SLN, and +SLN. Histological examination of the tumor specimen demonstrated a large piece of skeletal muscle serving as an unexpected but valuable internal positive control (Figure 4B, lower inset). In addition to the high incidence of miR-15a, miR-15b, and miR-16, the let-7 family members were present in abundance (Table 2). For example, the actual incidence of let-7a was 38, 27, 50 and 10 in skin, PCM, −SLN, and +SLN, respectively, corresponding to 8.2%, 6.6%, 17.7%, and 2.7% of the total small RNAs sequenced. All other let-7 family members demonstrated a down-regulated trend in cancer samples (PCM and +SLN), except for let-7e and let-7i (Table 2). Since let-7 family members are the predominant miRNA with differential cloning incidence in all four samples, we confirmed the tissue expression using Northern blot analysis. The Northern analysis revealed a consistent down-regulation of let-7a expression in PCM and +SLN when compared with tissues devoid of tumor, ie, skin and −SLN (Figure 6, A and B). Furthermore, qRT-PCR confirmed the down-regulation of let-7a in PCM and +SLN compared with skin and −SLN (Figure 6C). Cloning incidence suggested that let-7e and let-7i are up-regulated (Table 2), which is again corroborated by qRT-PCR (Figure 6D; data not shown for let-7e).
Table 2.
Summarized Incidence of Known miRNAs (n = 53) Cloned from a Melanoma Patient According to Specimen
| miRNA | Skin (n = 248) | PCM (n = 136) | −SLN (n = 154) | +SLN (n = 59) |
|---|---|---|---|---|
| let-7a | 38 (15.3) | 27 (20.0) | 50 (32.5) | 10 (16.9) |
| let-7b | 63 (25.4) | 26 (19.3) | 24 (15.6) | 1 (1.7) |
| let-7c | 30 (12.1) | 9 (6.7) | 5 (3.2) | 2 (3.4) |
| let-7e | 5 (2.0) | 8 (5.9) | 3 (5.1) | |
| let-7f | 17 (6.9) | 14 (10.4) | 25 (16.2) | 10 (16.9) |
| let-7g | 9 (3.6) | 1 (0.7) | 22 (14.3) | 5 (8.5) |
| let-7i | 5 (2.0) | 6 (4.4) | 2 (1.3) | 4 (6.8) |
| miR-1 | 9 (6.7) | |||
| miR-125a | 1 (0.4) | 1 (0.7) | 1 (0.6) | |
| miR-125b | 5 (2.0) | 1 (0.6) | 2 (3.4) | |
| miR-126 | 5 (2.0) | 6 (4.4) | 2 (1.3) | |
| miR-133a | 1 (0.7) | |||
| miR-127 | 1 (0.4) | |||
| miR-142 | 1 (0.7) | 2 (1.3) | ||
| miR-143 | 1 (0.4) | |||
| miR-144 | 1 (1.7) | |||
| miR-145 | 1 (0.4) | 1 (0.6) | ||
| miR-146a | 1 (0.6) | |||
| miR-151 | 5 (2.0) | 1 (0.7) | 1 (0.6) | 3 (5.1) |
| miR-191 | 1 (0.6) | |||
| miR-199a | 1 (0.6) | |||
| miR-15a | 2 (0.8) | |||
| miR-15b | 3 (2.2) | |||
| miR-16 | 2 (0.8) | |||
| miR-181b | 1 (0.4) | |||
| miR-199a | 4 (1.6) | |||
| miR-199b | 2 (0.8) | 1 (0.7) | ||
| miR-200b | 3 (1.2) | |||
| miR-200C | 6 (2.4) | 1 (0.7) | ||
| miR-203 | 3 (1.2) | |||
| miR-205 | 13 (5.2) | 4 (3.0) | ||
| miR-21 | 6 (2.4) | 3 (2.2) | 1 (0.6) | 9 (15.3) |
| miR-211 | 1 (1.7) | |||
| miR-223 | 1 (0.6) | |||
| miR-23a | 4 (1.6) | 2 (1.5) | 1 (0.6) | 1 (1.7) |
| miR-23b | 2 (0.8) | |||
| miR-26a | 2 (0.8) | 1 (0.7) | 6 (3.9) | 1 (1.7) |
| miR-26b | 1 (0.6) | |||
| miR-27a | 1 (0.4) | 2 (1.5) | 1 (1.7) | |
| miR-27b | 1 (0.7) | |||
| miR-29a | 1 (0.4) | 3 (2.2) | 1 (0.6) | |
| miR-29b | 3 (5.1) | |||
| miR-29c | 2 | |||
| miR-30c | 1 (0.7) | 1 | ||
| miR-30 days | 1 (1.7) | |||
| miR-335 | 1 (0.4) | |||
| miR-429 | 1 (0.7) | |||
| miR-451 | 5 (2.0) | 2 (1.5) | ||
| miR-486 | 2 (0.8) | |||
| miR-652 | 1 (0.4) | |||
| miR-92 | 1 | |||
| miR-98 | 1 (0.4) | |||
| miR-532 | 1 (1.7) |
Numbers represent the actual incidence of each miRNA; its percentage per total known miRNAs is shown in parentheses.
Figure 6.
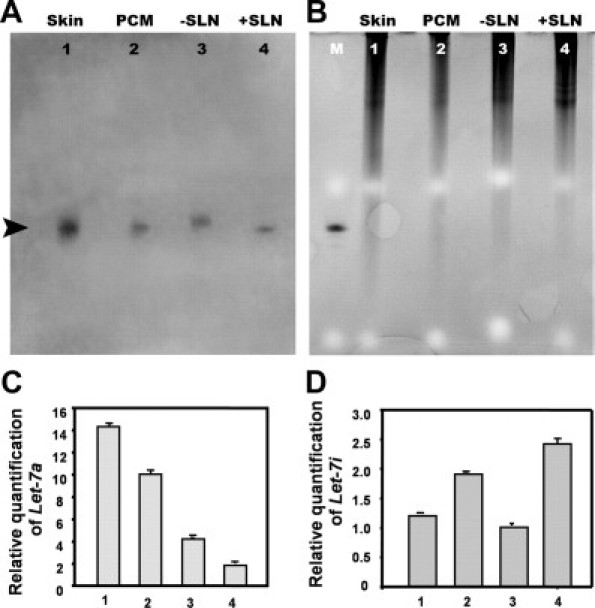
miRNAs were well-preserved in 10-year-old formalin-fixed FFPE specimens. A: Northern blot analysis shows the expression of the human let-7a in all samples from a 52-year-old man with scalp melanoma, corresponding to the histology shown in Figure 4: skin, PCM, −SLN, and +SLN. Each sample (4 μg/lane) was loaded and resolved on a denaturing 15% polyacrylamide gel. A 21/22-bp band is identified (arrowhead) corresponding to the size of lin-4 in B. B: For loading control, the 15% polyacrylamide gel for Northern blot was stained by EtBr before transferring to membrane. Lane M lane represents synthetic Caenorhabditis elegans miRNA, lin-4 loaded for size comparison. C: Quantitative real-time RT-PCR demonstrated down-regulation of let-7a expression in PCM and +SLN, when compared with normal skin and −SLN. D: The opposite effect, up-regulation, was demonstrated for let-7i expression in PCM and +SLN, when compared with normal skin and −SLN. The amount of miRNA was normalized using U6. Each reaction was performed in triplicate; error bars show standard deviations.
Discovery of Novel miRNAs and Other Classes of Novel Small RNAs
When annotating cloned small RNAs, some of these sequences could be aligned to human genome sequences but others did not correspond to any previously known RNA species. Several of these small RNA clones were designated as candidate novel miRNAs and categorized as class III based on the following criteria (Table 3 and Figure 5): 1)complete containment of the cDNA sequence within one arm of a hairpin, 2) at least 16 nucleotides of the cDNA sequence involved in base pairing, and 3) identification as the lowest free energy structure by mfold. The class II clones were miRNA-like, as they fulfilled criteria 1 and 3 but had somewhat fewer duplex base pairs in the hairpin region (Table 4 and Figure 5).21 The class I clones demonstrated poor secondary fold-back hairpin structure predicted by mfold and did not fulfill any of the criteria listed above (Table 5 and Figure 5). In addition, there were other small RNAs that fulfilled the three class criteria but had shorter length (less than 16, analyzed by adding flank sequence according to their genomic location) and hence were counted as novel small RNAs and calculated in our statistical analysis (Figure 5) but were not shown in the list (Tables 3–5). Overall, these results proved that small RNAs are stable and amenable to sequence-based profiling in FFPE specimens even after 10 years. This methodology can facilitate the discovery of novel and known small RNAs from FFPE specimens.
Table 3.
Novel Candidate miRNAs Identified from FFPE Samples of a Melanoma Patient
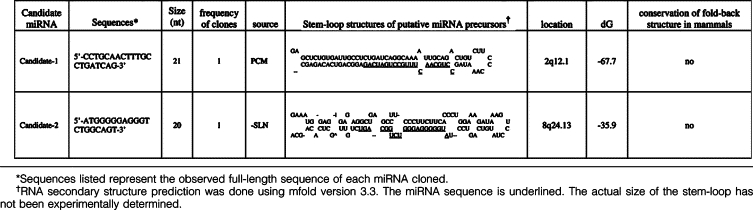 |
Table 4.
Novel Small RNAs with Noncanonical Hairpin Identified from FFPE Samples of a Melanoma Patient
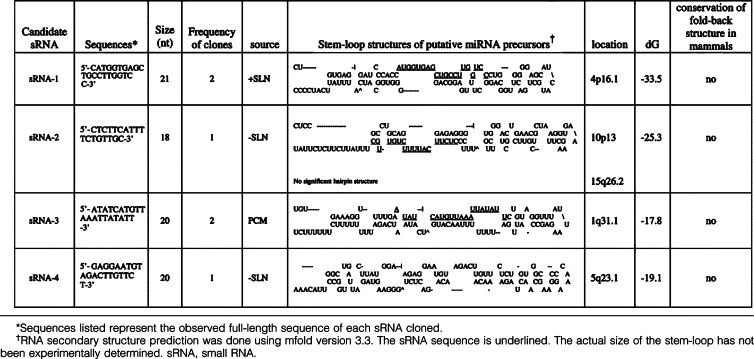 |
Table 5.
Novel Small RNAs without Significant Hairpin Identified from FFPE Samples of a Melanoma Patient
| Candidate sRNA | Sequences (5′−3′) | Size (nucleotides) | Total clones | Source | Location | Gene/intergenic exon/intron/UTR (S/AS) |
|---|---|---|---|---|---|---|
| sRNA-1 | 5′-CATGGTGAGCTGCCTTGGTCC-3′ | 21 | 1 | +SLN | 4p16.1 | Intergenic |
| sRNA-2 | 5′-CAGGAAGATCATGAATTCCCC-3′ | 21 | 1 | PCM | 10p15.1 | ASB13, intron (S) |
| sRNA-3 | 5′-CTGTTGGAGCTTTCTAGCCACATGTT-3′ | 26 | 1 | PCM | 10q25.3 | TRUB1, intron (S) |
| sRNA-4 | 5′-CTATACAGGTAGTTATGCAAG-3′ | 21 | 2 | +SLN | 11p11.12 | Intergenic |
| sRNA-5 | 5′-AATAGGAATTCACTGTATCT-3′ | 20 | 1 | −SLN | 11q23.3 | GRIK4, intron (S) |
| sRNA-6 | 5′-ATTTTGGGTGGAAAACTGT-3′ | 19 | 2 | −SLN | 12q21.31 | TMTC2, intron (AS) |
| sRNA-7 | 5′-AATGTTTAAAATGGGAAGAGA-3′ | 21 | 2 | +SLN | 13q31.3 | Intergenic |
| sRNA-8 | 5′-AAGACTTTTTCTCTGACC-3′ | 18 | 1 | +SLN | 17p13.1 | Intergenic |
| sRNA-9 | 5′-CTCTAGGCATGTGGCAGATATTA-3′ | 23 | 2 | −SLN | 1p21.2 | AGL, intron (AS) |
| sRNA-10 | 5′-TTCTGCATTTCTTTCCTGT-3′ | 19 | 1 | +SLN | 3q27.3 | AK057297, intron (S) |
| sRNA-11 | 5′-TTTCAGAAAGGGATGATC-3′ | 18 | 1 | −SLN | 4q12 | Intergenic |
Sequences listed represent the observed full-length sequence of each sRNA cloned. S, sense; AS, antisense; sRNA, small RNA.
Discussion
Our knowledge of gene regulation in cancer biology has mainly relied on differential expression of mRNAs isolated from fresh frozen tumor samples or immortalized cancer cell lines. mRNAs are usually degraded in archived specimens making these samples an unsuitable source of gene expression profiling. Accumulating evidence provided herein and in other published results10,29 shows that small RNAs are stable in FFPE specimens for up to 10 years. The ability to tap into the vast archive of human tissues provides several advantages: 1) a morphologically defined, disease-specific specimen can provide a clinical platform for small RNA discovery; 2) if coupled with clinical outcome data and disease-specific survival, the discovered small RNAs will have clinical and functional significance; and 3) they are suitable for relatively common but small cancers not amenable for freezing (eg, cutaneous melanoma).
Results show that our reproducible and robust methodology can release sufficient amount of high-quality total RNA from various FFPE specimens optimized for small RNA discovery. We examined a variety of organs (colon, liver, thyroid, uterus, lymph node, and skin) commonly available to most surgical pathologists. The total RNA yield was dependent on the amount of epithelium present in the specimen. For example, liver resulted in the highest amount of total RNA (20–25 μg), in contrast to skin, yielding in a significantly lower total RNA (2–3 μg). This discrepancy is dependent on the amount of epithelial cells and can be demonstrated using light microscopy, where liver has hepatic lobules packed with numerous hepatocytes, in contrast to skin that has only thin layers of epidermal keratinocytes.
To demonstrate the feasibility of sequencing directly from archived specimens, we chose four different samples from the same patient, thereby reducing individual genetic variation, while focusing on changes in the small RNAs associated with melanoma progression, ie, from normal skin, primary tumor, negative SLN to positive SLN. Given that FFPE specimen usually contains a significant fraction of degraded rRNA, we blocked the synthesis of rRNA derived cDNAs before sequencing using a “poison primer” strategy. This primer silencing dramatically reduced the spurious rRNA (4.5-fold) while enhancing the miRNA fraction (9.8-fold), thereby providing more access to higher fraction of small RNAs for analysis and discovery.
Cloning strategy has the advantage of not only discovering novel and known miRNA sequence identity but also providing an estimate of relative expression level. For example, the incidence of sequences provided an estimate for the relative abundance of 53 different known miRNAs. Interestingly, let-7 family was among the most abundant miRNAs, whose members demonstrated a down-regulated trend except for let-7e and let-7i, where an up-regulated trend was exhibited from skin to tumor and negative to positive SLN. Given the abundance of let-7a, we verified the down-regulation trend using both Northern blot analysis and quantitative RT-PCR and the up-regulation trend of let-7e and let-7i using quantitative RT-PCR. Our finding is corroborated by a recent study that also demonstrated down-regulation of let-7 family members in primary cutaneous melanoma when compared with benign nevi.30 Moreover, let-7a negatively regulates integrin β3, which is involved in melanoma progression and invasion in cultured melanoma cells.31 All together, our data presented herein and others signify an important role of let7 family in melanoma progression.
Overall, our results show that it is feasible to profile small RNAs in FFPE specimens by cloning and sequencing, which provides the advantages of discovery of new small RNAs and profiles previously identified miRNAs in low abundance. Our current methodology coupled with high throughput sequencing technology such as 454 method32 can provide a more robust strategy to obtain an accurate expression profile for novel and/or previously characterized small RNAs from clinically defined FFPE tumor specimens, thereby facilitating the discovery of “oncomirs” as biomarkers.
Footnotes
Supported in part by a 2007 Dermatology Foundation dermatopathology research grant (to S.S.D.) Melanoma Research Foundation and Department of Pathology research funds at Stanford University Medical Center.
References
- 1.Inoue T, Nabeshima K, Kataoka H, Koono M. Feasibility of archival non-buffered formalin-fixed and paraffin-embedded tissues for PCR amplification: an analysis of resected gastric carcinoma. Pathol Int. 1996;46:997–1004. doi: 10.1111/j.1440-1827.1996.tb03580.x. [DOI] [PubMed] [Google Scholar]
- 2.Cronin M, Pho M, Dutta D, Stephans JC, Shak S, Kiefer MC, Esteban JM, Baker JB. Measurement of gene expression in archival paraffin-embedded tissues: development and performance of a 92-gene reverse transcriptase-polymerase chain reaction assay. Am J Pathol. 2004;164:35–42. doi: 10.1016/S0002-9440(10)63093-3. [DOI] [PMC free article] [PubMed] [Google Scholar]
- 3.Masuda N, Ohnishi T, Kawamoto S, Monden M, Okubo K. Analysis of chemical modification of RNA from formalin-fixed samples and optimization of molecular biology applications for such samples. Nucleic Acids Res. 1999;27:4436–4443. doi: 10.1093/nar/27.22.4436. [DOI] [PMC free article] [PubMed] [Google Scholar]
- 4.Finke J, Fritzen R, Ternes P, Lange W, Dolken G. An improved strategy and a useful housekeeping gene for RNA analysis from formalin-fixed, paraffin-embedded tissues by PCR. Biotechniques. 1993;14:448–453. [PubMed] [Google Scholar]
- 5.Krafft AE, Duncan BW, Bijwaard KE, Taubenberger JK, Lichy JH. Optimization of the isolation and amplification of RNA from formalin-fixed. paraffin-embedded tissue: the Armed Forces Institute of Pathology experience and literature review. Mol Diagn. 1997;2:217–230. doi: 10.1054/MODI00200217. [DOI] [PubMed] [Google Scholar]
- 6.Ma XJ, Patel R, Wang X, Salunga R, Murage J, Desai R, Tuggle JT, Wang W, Chu S, Stecker K, Raja R, Robin H, Moore M, Baunoch D, Sgroi D, Erlander M. Molecular classification of human cancers using a 92-gene real-time quantitative polymerase chain reaction assay. Arch Pathol Lab Med. 2006;130:465–473. doi: 10.5858/2006-130-465-MCOHCU. [DOI] [PubMed] [Google Scholar]
- 7.Byers R, Roebuck J, Sakhinia E, Hoyland J. PolyA PCR amplification of cDNA from RNA extracted from formalin-fixed paraffin-embedded tissue. Diagn Mol Pathol. 2004;13:144–150. doi: 10.1097/01.pdm.0000133154.73846.66. [DOI] [PubMed] [Google Scholar]
- 8.Lehmann U, Kreipe H. Real-time PCR analysis of DNA and RNA extracted from formalin-fixed and paraffin-embedded biopsies. Methods. 2001;25:409–418. doi: 10.1006/meth.2001.1263. [DOI] [PubMed] [Google Scholar]
- 9.Antonov J, Goldstein DR, Oberli A, Baltzer A, Pirotta M, Fleischmann A, Altermatt HJ, Jaggi R. Reliable gene expression measurements from degraded RNA by quantitative real-time PCR depend on short amplicons and a proper normalization. Lab Invest. 2005;85:1040–1050. doi: 10.1038/labinvest.3700303. [DOI] [PubMed] [Google Scholar]
- 10.Doleshal M, Magotra AA, Choudhury B, Cannon BD, Labourier E, Szafranska AE. Evaluation and validation of total RNA extraction methods for microRNA expression analyses in formalin-fixed, paraffin-embedded tissues. J Mol Diagn. 2008;10:203–211. doi: 10.2353/jmoldx.2008.070153. [DOI] [PMC free article] [PubMed] [Google Scholar]
- 11.Nelson PT, Baldwin DA, Scearce LM, Oberholtzer JC, Tobias JW, Mourelatos Z. Microarray-based, high-throughput gene expression profiling of microRNAs. Nat Methods. 2004;1:155–161. doi: 10.1038/nmeth717. [DOI] [PubMed] [Google Scholar]
- 12.Bartel DP. MicroRNAs: genomics, biogenesis, mechanism, and function. Cell. 2004;116:281–297. doi: 10.1016/s0092-8674(04)00045-5. [DOI] [PubMed] [Google Scholar]
- 13.Esquela-Kerscher A, Slack FJ. Oncomirs—microRNAs with a role in cancer. Nat Rev Cancer. 2006;6:259–269. doi: 10.1038/nrc1840. [DOI] [PubMed] [Google Scholar]
- 14.Calin GA, Dumitru CD, Shimizu M, Bichi R, Zupo S, Noch E, Aldler H, Rattan S, Keating M, Rai K, Rassenti L, Kipps T, Negrini M, Bullrich F, Croce CM. Frequent deletions and down-regulation of micro- RNA genes miR15 and miR16 at 13q14 in chronic lymphocytic leukemia. Proc Natl Acad Sci USA. 2002;99:15524–15529. doi: 10.1073/pnas.242606799. [DOI] [PMC free article] [PubMed] [Google Scholar]
- 15.Calin GA, Ferracin M, Cimmino A, Di Leva G, Shimizu M, Wojcik SE, Iorio MV, Visone R, Sever NI, Fabbri M, Iuliano R, Palumbo T, Pichiorri F, Roldo C, Garzon R, Sevignani C, Rassenti L, Alder H, Volinia S, Liu CG, Kipps TJ, Negrini M, Croce CM. A MicroRNA signature associated with prognosis and progression in chronic lymphocytic leukemia. N Engl J Med. 2005;353:1793–1801. doi: 10.1056/NEJMoa050995. [DOI] [PubMed] [Google Scholar]
- 16.Kluiver J, Poppema S, de Jong D, Blokzijl T, Harms G, Jacobs S, Kroesen BJ, van den Berg A. BIC and miR-155 are highly expressed in Hodgkin, primary mediastinal and diffuse large B cell lymphomas. J Pathol. 2005;207:243–249. doi: 10.1002/path.1825. [DOI] [PubMed] [Google Scholar]
- 17.Calin GA, Liu CG, Sevignani C, Ferracin M, Felli N, Dumitru CD, Shimizu M, Cimmino A, Zupo S, Dono M, Dell'Aquila ML, Alder H, Rassenti L, Kipps TJ, Bullrich F, Negrini M, Croce CM. MicroRNA profiling reveals distinct signatures in B cell chronic lymphocytic leukemias. Proc Natl Acad Sci USA. 2004;101:11755–11760. doi: 10.1073/pnas.0404432101. [DOI] [PMC free article] [PubMed] [Google Scholar]
- 18.Takamizawa J, Konishi H, Yanagisawa K, Tomida S, Osada H, Endoh H, Harano T, Yatabe Y, Nagino M, Nimura Y, Mitsudomi T, Takahashi T. Reduced expression of the let-7 microRNAs in human lung cancers in association with shortened postoperative survival. Cancer Res. 2004;64:3753–3756. doi: 10.1158/0008-5472.CAN-04-0637. [DOI] [PubMed] [Google Scholar]
- 19.Michael MZ, SM OC, van Holst Pellekaan NG, Young GP, James RJ. Reduced accumulation of specific microRNAs in colorectal neoplasia. Mol Cancer Res. 2003;1:882–891. [PubMed] [Google Scholar]
- 20.Chan JA, Krichevsky AM, Kosik KS. MicroRNA-21 is an antiapoptotic factor in human glioblastoma cells. Cancer Res. 2005;65:6029–6033. doi: 10.1158/0008-5472.CAN-05-0137. [DOI] [PubMed] [Google Scholar]
- 21.Lui WO, Pourmand N, Patterson BK, Fire A. Patterns of known and novel small RNAs in human cervical cancer. Cancer Res. 2007;67:6031–6043. doi: 10.1158/0008-5472.CAN-06-0561. [DOI] [PubMed] [Google Scholar]
- 22.Glud M, Klausen M, Gniadecki R, Rossing M, Hastrup N, Nielsen FC, Drzewiecki KT. MicroRNA expression in melanocytic nevi: the usefulness of formalin-fixed, paraffin-embedded material for miRNA microarray profiling. J Invest Dermatol. 2009;129:1219–1224. doi: 10.1038/jid.2008.347. [DOI] [PubMed] [Google Scholar]
- 23.Lau NC, Lim LP, Weinstein EG, Bartel DP. An abundant class of tiny RNAs with probable regulatory roles in Caenorhabditis elegans. Science. 2001;294:858–862. doi: 10.1126/science.1065062. [DOI] [PubMed] [Google Scholar]
- 24.Berezikov E, Cuppen E, Plasterk RH. Approaches to microRNA discovery. Nat Genet. 2006;38(Suppl):S2–S7. doi: 10.1038/ng1794. [DOI] [PubMed] [Google Scholar]
- 25.Zuker M. Mfold web server for nucleic acid folding and hybridization prediction. Nucleic Acids Res. 2003;31:3406–3415. doi: 10.1093/nar/gkg595. [DOI] [PMC free article] [PubMed] [Google Scholar]
- 26.Choong ML, Yang HH, McNiece I. MicroRNA expression profiling during human cord blood-derived CD34 cell erythropoiesis. Exp Hematol. 2007;35:551–564. doi: 10.1016/j.exphem.2006.12.002. [DOI] [PubMed] [Google Scholar]
- 27.Chomczynski P, Sacchi N. Single-step method of RNA isolation by acid guanidinium thiocyanate-phenol-chloroform extraction. Anal Biochem. 1987;162:156–159. doi: 10.1006/abio.1987.9999. [DOI] [PubMed] [Google Scholar]
- 28.Lagos-Quintana M, Rauhut R, Yalcin A, Meyer J, Lendeckel W, Tuschl T. Identification of tissue-specific microRNAs from mouse. Curr Biol. 2002;12:735–739. doi: 10.1016/s0960-9822(02)00809-6. [DOI] [PubMed] [Google Scholar]
- 29.Li J, Smyth P, Flavin R, Cahill S, Denning K, Aherne S, Guenther SM, O'Leary JJ, Sheils O. Comparison of miRNA expression patterns using total RNA extracted from matched samples of formalin-fixed paraffin-embedded (FFPE) cells and snap frozen cells. BMC Biotechnol. 2007;7:36. doi: 10.1186/1472-6750-7-36. [DOI] [PMC free article] [PubMed] [Google Scholar]
- 30.Schultz J, Lorenz P, Gross G, Ibrahim S, Kunz M. MicroRNA let-7b targets important cell cycle molecules in malignant melanoma cells and interferes with anchorage-independent growth. Cell Res. 2008;18:549–557. doi: 10.1038/cr.2008.45. [DOI] [PubMed] [Google Scholar]
- 31.Muller DW, Bosserhoff AK. Integrin beta 3 expression is regulated by let-7a miRNA in malignant melanoma. Oncogene. 2008;27:6698–6706. doi: 10.1038/onc.2008.282. [DOI] [PubMed] [Google Scholar]
- 32.Parameswaran P, Jalili R, Tao L, Shokralla S, Gharizadeh B, Ronaghi M, Fire AZ. A pyrosequencing-tailored nucleotide barcode design unveils opportunities for large-scale sample multiplexing. Nucleic Acids Res. 2007;35:e130. doi: 10.1093/nar/gkm760. [DOI] [PMC free article] [PubMed] [Google Scholar]