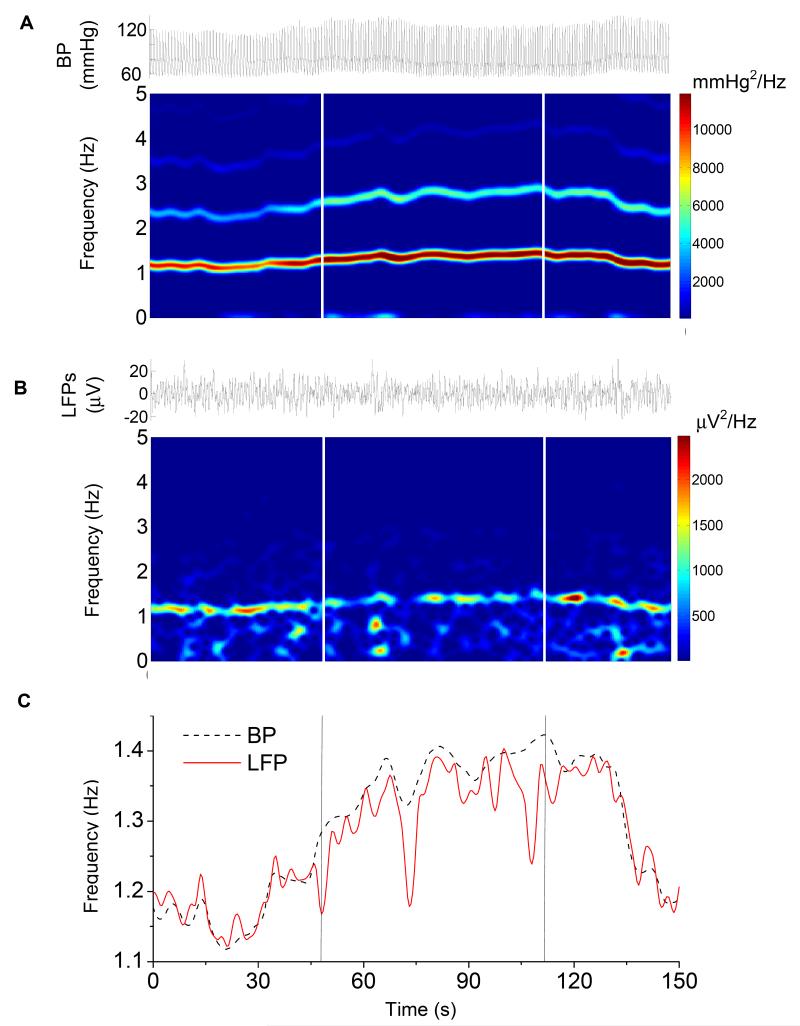
Figure 2.
A representative example of simultaneously recorded BP (A) and LFP (B) signals and their spectrograms over a period of mild exercise. The frequency change in BP signal induced by exercise significantly correlated with the changes in the frequency change in the electrode potential (C) over time. The onset and offset of the exercise are indicated by the vertical lines.

