Abstract
We report on the nanofabrication of patterned silver particle arrays using electron-beam lithography and the evaluation of their optical properties using backscattering and fluorescence spectroscopy. The silver particles varied in size from 100 to 250 nm and were in the shape of circles, squares, and triangles. Three inter-particle separations, 40, 65, and 90 nm as measured from the side of one particle to the side of the next particle, were used. We observed distinctive patterns of backscattering and fluorescence intensity depending on the particle size, inter-particle spacing, and excitation/emission wavelength used. Our approach allows for a study of the correlation between the backscattering intensities and fluorescence enhancement of silver particle arrays, which can be used to optimize the arrays for multi-fluorophore configuration for advanced sensing designs.
Index Headings: Fluorescence, Surface plasmon resonance, SPR: Metallic nanoparticles, Electron beam lithography, EBL, Fluorescence spectroscopy, Plasmonics, Nano-optics
INTRODUCTION
At present, there is a strong interest in the unique optical properties of metallic nanostructures. Metallic nanoparticles have the ability to couple light to resonance plasmon oscillations, resulting in strong local field enhancements. Many theoretical and experimental studies of the optical properties of noble metal particles have been carried out, particularly relating to field enhancement and the possibility of tuning the plasmon resonance wavelength. Studies have been reported on single particles,1–8 nanoparticle clusters,7–10 metallic nanoshells,11 nanocavities,12 and two-dimensional arrays.13–17 It has been demonstrated that the wavelength position and amplitude of plasmon extinction spectra depend strongly on the geometrical configuration of the particles. An increase in the size of the nanoparticle results in a red-shift and broadening of the extinction spectra.5,7,8,13,14,17 Decreasing the inter-particle separation causes the collective properties of the particle ensemble to result in a blue-shift as well as in a red-shift, compared to the single particle plasmon spectrum.7,9,10 The direction of the wavelength shift is dependent on the orientation of the polarization of the incident light relative to the particle configuration.7,8,15,21
An important field for the application of optical properties of metallic nanostructures is using them with fluorescent probes for surface-enhanced spectroscopy and biosensing. There are many experimental reports on large fluorescence enhancements due to surface plasmon resonance (SPR).18–30 Most of the experiments on surface-enhanced fluorescence have been performed using roughened metallic surfaces fabricated by wet chemical deposition of silver islands, with a plurality of particle sizes and various surface densities. While such metallic surfaces displayed substantial fluorescence enhancement, there is no clear, conclusive data that correlates the geometrical properties of metallic particles with the spectral properties of the fluorophores. It has been shown that fluorescence enhancement can be obtained in the spectral range from the ultraviolet (UV) to the near infrared (NIR) with silver islands.22–24 While the silver islands or colloids can be easily fabricated and readily applied to biosensing applications, there is a lack of information on the optimal conditions for the best enhancement with particular fluorophores. More recently, advanced lithographic techniques were used that allowed precise control of the particle shape and size, as well as inter-particle separation. Nanosphere lithography (NSL) has successfully been used to fabricate tetrahedron-shaped silver particles of various sizes and with various aspect ratios.14,31 In the NSL technique, a monolayer of polystyrene spheres coated on a substrate acts as a deposition mask. Although NSL is an efficient method for patterning large areas, it is limited in the design of a variety of particle shapes and the fine-tuning of inter-particle separation. Electron-beam (e-beam) lithography (EBL) has become the method of choice for fabricating single or periodic arrays of metal nanoparticles in desired shapes, sizes, and periodicities.9,13,15,17,28 EBL is versatile and provides high resolution and precise control over the geometry and separation of nanostructures; structures of approximately 20 nm are routinely generated. The EBL technique provides the means to fabricate an array of Ag particles with diameters and inter-particle separations as small as 50 nm and 15 nm, respectively.28
The theoretical work on the characterization of optical properties of metallic particles and experimental data on two-dimensional arrays motivated us to fabricate metallic arrays and evaluate them with fluorescence probes in a sensing format typically used in surface-based immunoassays and DNA microarrays. This real-world configuration for fluorometric sensing includes metallic particles deposited on a dielectric substrate (glass) coated with biomolecules labeled with fluorophores and embedded in aqueous buffer. We are aware that the theoretical explanation of our approach is more complex than those cases provided in current theoretical calculations. The complexity of potential calculations includes several additional parameters such as properties of fluorescent probes that are known to change their spectral properties when near a metallic surface,18,22–26 a dielectric non-homogeneous environment, particle–particle interactions, and distance from the metal surface. The important aspect of our work is to incorporate fluorescence probes into plasmonic nanostructures with collective optical phenomena. We believe that our approach, using many geometrical configurations of particles and two distinct wavelengths, provides data that will stimulate theoretical as well as experimental work and will provide a better understanding of the effects of plasmon resonance on fluorescence. In addition, this approach will lead to an optimal and rational design of nanoscale plasmonic devices for fluorescence-based sensing.
In this report we investigate metal-enhanced fluorescence (MEF) using silver particle arrays fabricated by e-beam lithography. It is widely thought that the maximum fluorescence enhancement will be obtained if the fluorophore’s spectral properties overlap with a particle plasmon spectrum. The EBL technique allowed us to fabricate a wide range of geometrical configurations to be investigated in a wide range of excitation/emission wavelengths. We have chosen to deposit silver particles of sizes between 100 and 250 nm, expecting effective plasmon resonance in the wavelength range of 400–800 nm.17 This spectral range is widely used in fluorescence sensing. Additional motivation for depositing large sized nanoparticles is driven by the interest in using fluorescence enhancement in the NIR wavelength range with laser excitation of 635 nm and above. A previous report on Ag arrays, including fluorescence probes,28 indicated that closely spaced particles, 40 to 140 nm (side to side), resulted in the highest fluorescence enhancements. In this respect, closely spaced silver particles were fabricated with expanded particle sizes of up to 250 nm in three shapes, squares, circles, and triangles. In our case, the particle arrays were covered with a uniform sub-monolayer of biomolecules labeled with fluorophores.
METHODS
Preparation of Particle Arrays
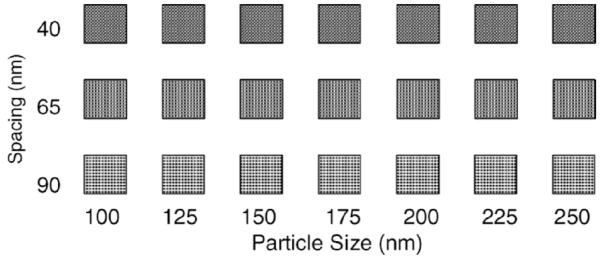
Arrays of different shapes and geometrical patterns of Ag nanoparticles were fabricated with e-beam lithography at Penn State Nanofabrication Facility. The bi-layer resist PMMA/P(MMA-MAA) (poly methyl-methacrylate)/poly methylmethacrylate-co methacrylate acid) was spin-coated on a glass coverslip and then exposed to the e-beam. After the development of the resist, Ag was deposited with an effective thickness of 75 nm in a high-vacuum Kurt Lesker thin film vapor deposition system. After this, the remaining silver was removed by the lift-off procedure, giving an array of Ag nanoparticles. We have prepared arrays that consist of a large number of combinations of particle sizes and inter-particle separations (sub-arrays). The patterns made consisted of sub-arrays, each with an area of 5 μm × 5 μm, with a specific combination of particle shapes, sizes, and inter-particle separations. The resulting silver nanoparticles varied in size from 100 nm to 250 nm and the inter-particle distances were 40, 65, and 90 nm as measured from side to side. Figure 1 shows a schematic of the geometry of a Ag array with 21 sub-arrays. Three particle shapes were fabricated, square, circular, and triangular, with thicknesses of 75 nm.
Fig. 1.
Geometry of a silver array with three inter-particle separations (40, 65, and 90 nm from side to side) and seven particle sizes from 100 to 250 nm. The particle thickness was 75 nm.
Scanning Electron Microscopy Measurements
The geometrical morphologies of the silver nanoparticle arrays were then examined with a Leo 1530 field emission scanning electron microscope (FE-SEM). To avoid the charging effects of imaging on glass, two identical sets of Ag particle arrays were fabricated on each coverslip, then one part of the substrate (having one of the two identical Ag arrays) was coated with a 10 nm layer of aluminum prior to SEM imaging. This aluminum layer helped us obtain high resolution images because it dissipated the charge that builds up during imaging on insulating surfaces such as glass. Figure 2 shows the SEM images of the selected whole sub-arrays and high magnification of triangular and square particles. Detailed parameters of the design and fabrication output determined from SEM are summarized in Table I and indicate a high precision of e-beam lithography for fabrication of metallic nanostructures.
Fig. 2.
SEM images of entire sub-arrays of Ag particles of (A) circular and (B) triangular shapes at a magnification of 10.00K×. See Table I for details on particle size and spacing. (C, D) High magnification of 70K× shows that the shapes of particles are well defined.
TABLE I.
Nanofabrication parameters of selected Ag sub-arrays.
| Image | Circles (A) | Triangles (B) | Triangles (C) | Squares (D) |
|---|---|---|---|---|
| Designed: size/separation, nm | 200/65 | 200/65 | 175/90 | 175/90 |
| Obtained: size/separation, nm | 195/67 | 193/80 | 171/91–101 | 179/83 |
Substrate Preparation with Biochemicals
Two IgG conjugates with fluorescein isothiocyanate (FITC) and with Cy5 were used for enhanced fluorescence studies. The goat anti-mouse IgG-FITC and IgG-Cy5 were purchased from Southern Biotech (Birmingham, AL). Silver arrays were incubated with an equimolar aqueous mixture of IgG conjugates providing a monolayer of protein adsorbed on the surface of the glass and silver arrays. The unbound IgG conjugates were removed with gentle dilution with phosphate buffer, pH 7.4.
Spectroscopic Measurements
Backscattering (reflectance) and fluorescence images were acquired using confocal laser scanning microscopy (CLSM 510 Zeiss, Gottingen, Germany). A high magnification objective of 100×, NA 0.95 (Olympus, LMPlanFl) was used. An air-cooled argon ion laser was used for the excitation of IgG-FITC with a wavelength of 488 nm. A HeNe laser with a wavelength of 633 nm was used for excitation of IgG-Cy5. The estimated microscope spatial resolution (0.61 λ/NA) is estimated as 313 nm for 488 nm and about 406 nm for 633 nm. Based on these resolutions, we estimated the number of particles that were illuminated at one time during the scanning for two representative sub-arrays. For the sub-arrays consisting of particles with a size of 100 nm and inter-particle spacing of 40 nm, approximately five and ten particles were illuminated at one time with excitation of 488 and 633 nm, respectively. For sub-arrays with a particle size of 250 nm and inter-particle spacing of 90 nm, approximately one and two particles were illuminated at wavelengths of 488 and 633 nm, respectively. The excitation laser beam passed through the glass substrate to induce the particle plasmon resonance and to excite the fluorophores.
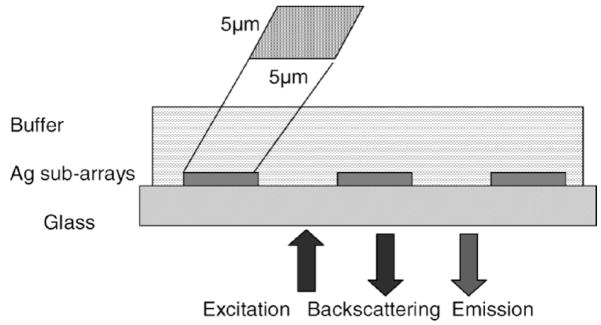
Backscattering images were collected at attenuated excitation intensity (laser powers less than 0.5 mW) to avoid potential photobleaching of the dyes. Measurements of fluorescence images were taken at the appropriate wavelength ranges for the selected dyes. Emission of the FITC was observed through a bandpass filter of 500–550 nm, and Cy5 emission was observed through a long-pass filter above 660 nm. Dichroic mirrors were used to eliminate the excitation light from the detector. Fluorescence images were acquired at higher laser powers (10–50 mW) tuned with an acousto-optical filter. The estimated dwell time during laser scanning was about 230 μs per pixel and no appreciable photobleaching was observed up to five scans. Figure 3 illustrates the geometrical configuration of the experimental setup. This excitation and observation geometry is dictated by our interest in biotechnology applications of plasmonic structures.
Fig. 3.
Experimental configuration for measurement of the backscattering and fluorescence images. The excitation/emission conditions are 488/500–550 nm for FITC and 633/>660 nm for Cy5. The layer of proteins labeled with FITC and Cy 5 is not shown.
RESULTS AND DISCUSSION
Optical Properties of Silver Arrays Using Backscattering Measurements
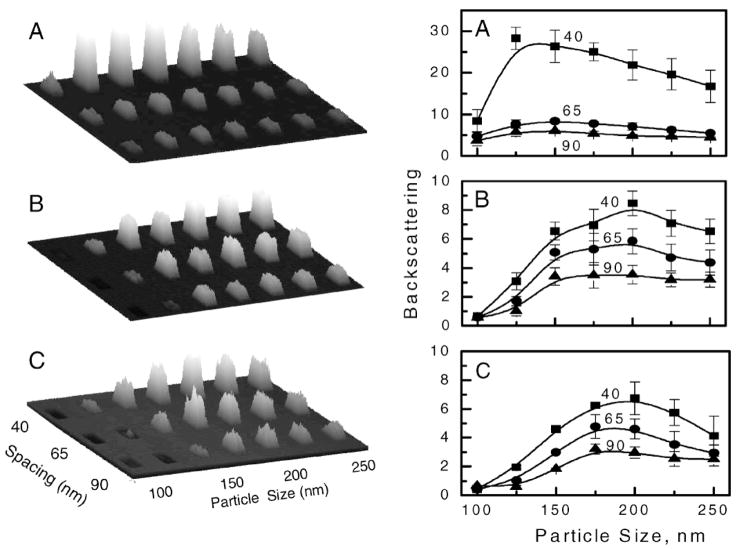
Figure 4 shows the images of the backscattered incident light (left) and a detailed analysis of the backscattering light of each Ag sub-array (right). The intensity of backscattered light was calculated using data from three replicates of each Ag sub-array relative to that from the glass area (area between the sub-arrays). As expected, the amount of light backscattered from the particular sub-array is dependent on the size of the particles and the inter-particle separations. The backscattering is larger if particles are closer together; a spacing of 40 nm results in consistently higher backscattering than spacing of 65 and 90 nm. More complex dependence of backscattering is observed due to the variation of particle size. A maximum of backscattering is observed at specific sizes and shapes of the particles, indicating that backscattered light is attributed to first coupling into a localized particle plasmon and then re-radiating back. The other component that contributes to the observed backscattered light is specularly reflected light. Square particles scatter light substantially more than circular and triangular shapes. This can be explained by at least two reasons: (1) the fact that the surface area (as well as the particle volume) is larger for squares compared to the other shapes, and (2) the effective inter-particle distance is less for square particles than for circular and triangular particles of the same size. Theoretical calculations predict that metal particles of larger size scatter light more efficiently and close proximity between particles causes their strong interaction, generating highly enhanced local fields. Both these effects are manifested in high scattering for square particles with a separation distance of 40 nm.
Fig. 4.
(Left) Measured backscattered images of Ag periodic arrays with three particle shapes, (A) square, (B) circular, and (C) triangular at an incident light wavelength of 488 nm. (Right) Relative backscattering calculated versus glass substrate for particle spacing of 40, 65, and 90 nm. The error bars represent the standard deviation calculated from average values of three sub-arrays with identical particle geometrical configurations. The solid lines are drawn as guides.
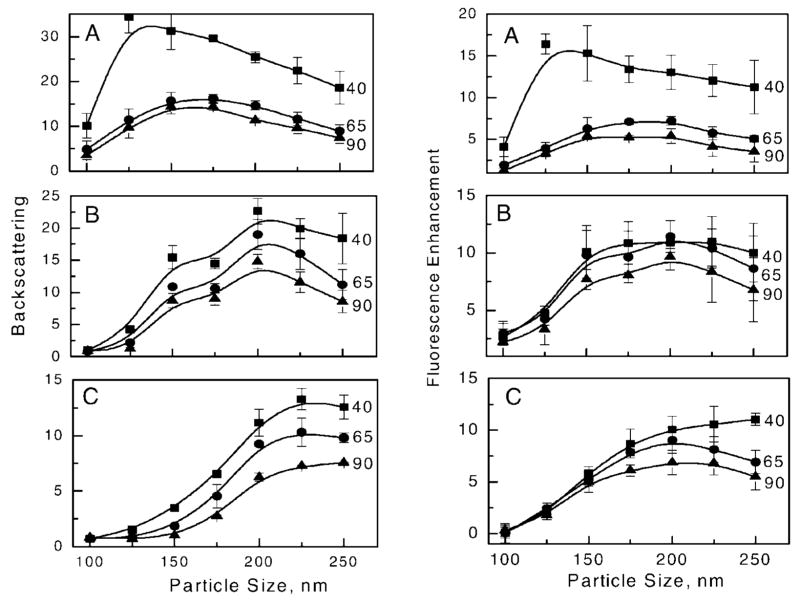
The backscattering at 633 nm (Fig. 6, left) displays similar patterns as that for 488 nm but with stronger relative scattering and a shift in maxima towards longer wavelengths. The visible difference is seen in the triangular particle size, where maxima are shifted towards larger particle sizes, from the size of 200 nm at 488 nm (Fig. 4) to 225 to 250 nm at 633 nm (Fig. 6). Interestingly, areas of small triangular particles (100–125 nm) display absorptive properties as shown in the images by darker areas. We questioned whether the sub-arrays with small particles were damaged during the biochemistry with buffer and proteins, due to limited adherence to the glass substrate. However, we believe that it was important to perform studies using environmental conditions that are similar to those expected in real biological samples, and rendering the metallic particles to the biological environment has a practical value. Our observations imply that the practical application of metallic arrays to practical biosensing will require additional studies of particle adherence to substrate surfaces when exposed to various chemical compositions of biological samples. Such studies are beyond the scope of this report.
Fig. 6.
(Left) Backscattering of incident light of 633 nm on Ag particle arrays. (Right) Fluorescence enhancement of Cy5 on Ag particle arrays; (A) square, (B) circular, (C) triangular. The solid lines are drawn as guides.
We did not observe the effect of periodicity on scattering, which is likely due to the large numerical aperture of the objective and illumination of a small number of particles at one time. The large angle of light acceptance of about 72° (NA 0.95, air) will wash out the potential angle-dependent radiation pattern. Such periodicity effects have been reported for fluorescence above metallic periodic gratings29 and sub-wavelength nanoholes30,31 as a diffraction pattern in fluorescence and transmission light.
Fluorescence Enhancement Using Silver Periodic Arrays
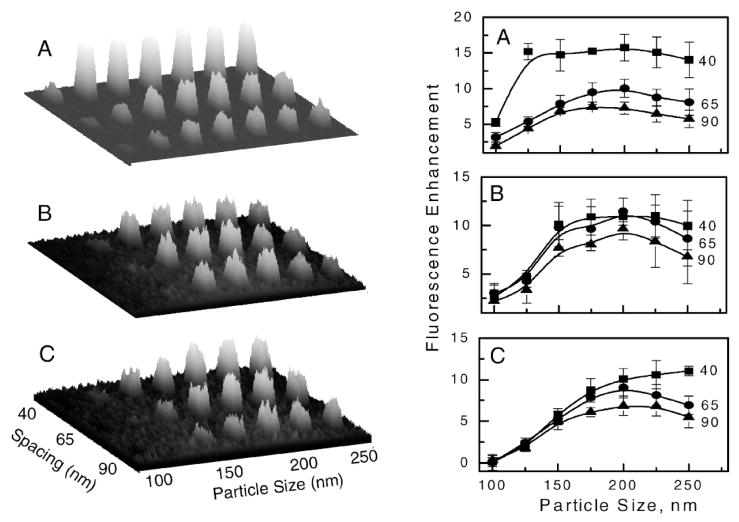
The enhanced fluorescence was calculated as a ratio of the average signal of the sub-arrays (using three sub-array replicates) to the average signal on the glass substrate (area between sub-arrays). Figure 5 shows the size-dependent and inter-particle-separation-dependent fluorescence enhancements for the three particle shapes. One would imagine that high backscattering should result in less fluorescence because of inefficient excitation of fluorophores through the Ag particles (Fig. 3). This would be observed if the backscattered light originated from back-reflected excitation light; however, backscattering observed for Ag sub-arrays is related to the scattering efficiency of the silver particle plasmon resonance, which effectively enhances fluorescence and couples it back to the glass substrate. Therefore, due to the interaction of the fluorophores and plasmon, we observe a strong correlation between backscattering and fluorescence enhancement for both spectral windows; blue (Figs. 4 and 5) and red (Fig. 6). The longer excitation wavelength (633 nm) resulted in a maximum of backscattered light and a shift in the fluorescence enhancement toward the larger particle size, which is in agreement with theoretical calculations.
Fig. 5.
(Left) Fluorescence images of FITC on Ag periodic arrays with three particle shapes, (A) square, (B) circular, and (C) triangular. (Right) Enhanced fluorescence of FITC (versus signal on glass substrate) calculated as average values from images. The solid lines are drawn as guides.
The observed maximum enhancements are about 15 fold for closely spaced square nanoparticles at a separation of 40 nm. The maximum enhancement decreases for larger separations between particles to about 7 to 11 fold. The calculated enhancements are most likely underestimated because the observation was performed through the glass. The energy radiated by emitting molecules in the direction of the glass is higher than in buffer. For randomly oriented molecules positioned close to the glass surface, the energy partition is about 70% into the glass and 30% into water.32
From our observation of MEF using silver islands, we usually observed similar fluorescence intensities from both directions (through the glass and above the silver islands). In this regard, we can estimate that our enhancement values are about 1.4-fold lower than would be observed at equal partitioning of energy in the directions of the buffer and glass. Nonetheless, the enhancement values are in the range of other reports on silver and gold arrays. Fluorescence of rhodamine 6G was enhanced by a factor of 2.5 and 8.0 on silver ellipsoids excited along the long and short axes, respectively.21 Fluorescence enhancements in the range from 21 to 33 were observed for CdSe/ZnS nanocrystals on gold particle arrays with triangular prisms and cylinders.33 Similar enhancements were obtained for single silver nanoprisms34 and gold nanoshells35 where the displayed plasmon spectra overlap with the spectra of fluorophores in a visible and near-infrared wavelength range, respectively. The fluorescence of silicon quantum dots was also enhanced 7 fold in the presence of silver arrays.36
The similar enhancements observed for FITC and Cy5 are likely due to the broad surface plasmon spectra, as has been reported for similar silver arrays.3,32 This can be regarded as beneficial for multiplexed assays in which several spectrally different fluorophores can be used simultaneously with the single particle array, resulting in similar enhancement factors. The high density of silver particles provides conditions for near-field effects that enhance excitation light and alter radiative and nonradiative decay rates of nearby fluorophores. The simultaneous illumination of several particles with polarized laser light generates the local field enhancements where the light is confined effectively in the gaps between particles. In the case of an array, high local fields appear between particle pairs in vertical and horizontal orientations relative to the polarized light.37 This means that high local field enhancement can be effectively generated, which causes the fluorescence of both dyes to be enhanced by the high absorption rates at excitation wavelengths. The largest enhancements of local fields (E) are generated at the particle tips. Previous models have shown that the field intensity enhancements (|E|2) for triangular prisms, rods, and spheroids are on the order of 3000 to 5000 times larger than the applied field.5,8,12 However, our fluorescence data showed lower intensity enhancement for triangular particles as opposed to circular and square particles. The discrepancy between the expected high electric field enhancement of triangular particles and the lower average fluorescence enhancements can be explained in a few ways. First, the average area occupied by a triangular particle is less than half that of the same lateral size square particle (e.g., for a size of 200 nm, the triangular area is 1.73 × 10⁴ nm2 compared with 4 × 10⁴ nm2 for a square), so the non-enhanced fluorescence from the glass substrate (between particles) contributes to the calculated average signal. Secondly, the enhanced field from sharp triangular corners decays faster with distance than the enhanced field from less sharp surfaces.3,5 Finally, the plasmon resonance spectra for triangular particles can be shifted towards longer wavelengths beyond the excitation and emission wavelengths used for FITC and Cy5. The shift in fluorescence enhancement towards larger particle size (Figs. 5 and 6) suggests this hypothesis. To maximize fluorescence enhancement with triangular particles, it is likely that a higher density of particles is required with tipto-tip orientation, as has been modeled for particle dimers.8
The second effect of the enhanced fluorescence is due to the interaction of excited fluorophores with particle surface plasmons, which leads to increased radiative rates, coupling to metal surface plasmons, and scattering into the far field. Highly effective scattering of metallic particles results in high fluorescence enhancement, as is demonstrated in Figs. 4 through 6. The observed maxima in the fluorescence enhancement at specific particle sizes illustrate the tradeoff between the high local field around the surface of the particles and their ability to scatter light into the far field. Previous models have shown that the smaller particles generate higher local fields but have lower scattering efficiencies than the larger particles.8
The interaction of excited fluorophores with plasmons also results in an increased nonradiative decay rate, which dominates at very small distances and can be observed as fluorescence quenching. In our case, such a quenching effect of metallic particles is minimized because the average distance between the fluorophores and the surface is defined by the IgG size, which can be estimated as about 5 nm for randomly labeled fluorophores within the IgG.
CONCLUSION
We have studied the optical properties of Ag arrays and their effects on fluorescence enhancement. The average fluorescence enhancement strongly depends on the size and inter-particle spacing and less on the excitation/emission wavelength. The current study demonstrates a strong correlation between the backscattering of light from two-dimensional silver particle arrays and fluorescence enhancement of probes deposited on the surface of the arrays. The most promising geometrical configurations that produce the largest enhancements are densely packed square-shaped particles that display highly scattering properties. Our studies confirm that the scattering properties of plasmons are dominant factors in obtaining efficient fluorescence enhancement. Similar conclusions on the relationship between the scattering properties of plasmonic structures and fluorescence enhancement were obtained using gold nanoshells with tunable plasmon spectra.34 Thus, studies of scattering properties of metallic nanostructures provide direct insights into potential fluorescence enhancements that can lead to the design of desired plasmonic materials for fluorescence applications.
Acknowledgments
This research was financially supported by National Institute of Health, NIBIB EB-00682, NIBIB EB-006521, NHGRI HG-002655, and by NIH 1R43 RR021785-01 (LiCOR, Inc.). This research was also supported by Pennsylvania State University Materials Research Institute Nano Fabrication Network and the National Science Foundation Cooperative Agreement No. 0335765, National Nanotechnology Infrastructure Network, with Cornell University (J.C. and K.E.).
References
- 1.Gersten J, Nitzan A. J Chem Phys. 1981;75:1139. [Google Scholar]
- 2.Das P, Metiu H. J Phys Chem. 1985;89:4680. [Google Scholar]
- 3.Kottmann JP, Martin OJF, Smith DR, Schultz S. Phys Rev B. 2001;64:235402. [Google Scholar]
- 4.Micic M, Klymyshyn N, Suh YD, Lu PH. J Phys Chem B. 2003;107:1574. [Google Scholar]
- 5.Kelly KL, Coronado E, Zhao LL, Schatz GC. J Phys Chem B. 2003;107:668. [Google Scholar]
- 6.Lévêque G, Martin OJF. Opt Lett. 2006;31:2750. doi: 10.1364/ol.31.002750. [DOI] [PubMed] [Google Scholar]
- 7.Tamaru H, Kuwata TH, Miyazaki H, Miyano K. Appl Phys Lett. 2002;80:1826. [Google Scholar]
- 8.Hao E, Schatz GC. J Chem Phys. 2004;120:357. doi: 10.1063/1.1629280. [DOI] [PubMed] [Google Scholar]
- 9.Atay T, Song JH, Nurmikko AV. Nano Lett. 2004;4:1627. [Google Scholar]
- 10.Romero I, Aizpurua J, Bryant GW, Garcia de Abajo FJ. Opt Exp. 2006;14:9988. doi: 10.1364/oe.14.009988. [DOI] [PubMed] [Google Scholar]
- 11.Jackson JB, Halas NJ. J Phys Chem B. 2001;105:2743. [Google Scholar]
- 12.Kim J, Liu GL, Lu Y, Lee LP. Opt Exp. 2005;13:8322. [Google Scholar]
- 13.Gotschy W, Vonmetz K, Leitner A, Aussenegg FR. Appl Phys B. 1996;63:381. doi: 10.1364/ol.21.001099. [DOI] [PubMed] [Google Scholar]
- 14.Jensen RR, Duval Malinsky M, Haynes CL, Van Duyne RP. J Phys Chem B. 2000;104:10549. [Google Scholar]
- 15.Schider G, Krenn JR, Gotschy W, Lamprecht B, Ditlbacher H, Leitner A, Aussenegg FR. J Appl Phys. 2001;90:3825. [Google Scholar]
- 16.Zhao LL, Kelly KL, Schatz GC. J Phys Chem B. 2003;107:7343. [Google Scholar]
- 17.Haynes CL, McFarland AD, Zhao LL, Van Duyne RP, Schatz GC, Gunnarsson L, Prikulis J, Kasemo B, Käll M. J Phys Chem B. 2003;107:7337. [Google Scholar]
- 18.Weitz DA, Garoff S, Gersten JI, Nitzan A. J Chem Phys. 1983;78:5324. [Google Scholar]
- 19.Aroca R, Kovacs GJ, Jennings CA, Loutfy RO, Vincett PS. Langmuir. 1988;4:518. [Google Scholar]
- 20.Mohamed MB, Volkov V, Link S, El-Sayed MA. Chem Phys Lett. 2000;317:517. [Google Scholar]
- 21.Dietlbacher H, Felidj N, Krenn JR, Lamprecht B, Leitner A, Aussenegg FR. Appl Phys B. 2001;73:373. [Google Scholar]
- 22.Lakowicz JR, Shen B, Gryczynski Z, D’Auria S, Gryczynski I. Biochem Biophys Res Commun. 2001;286:875. doi: 10.1006/bbrc.2001.5445. [DOI] [PMC free article] [PubMed] [Google Scholar]
- 23.Maliwal BP, Malicka J, Gryczynski Z, Gryczynski I, Lakowicz JR. Biopolym (Biospectrosc) 2003;70:585. doi: 10.1002/bip.10501. [DOI] [PMC free article] [PubMed] [Google Scholar]
- 24.Geddes CD, Cao H, Lakowicz JR. Spectrochim Acta, Part A. 2003;59:2611. doi: 10.1016/s1386-1425(03)00015-5. [DOI] [PMC free article] [PubMed] [Google Scholar]
- 25.Lakowicz JR, Shen Y, Auria SD, Malicka J, Fang J, Gryczynski Z, Gryczynski I. Anal Biochem. 2002;301:261. doi: 10.1006/abio.2001.5503. [DOI] [PMC free article] [PubMed] [Google Scholar]
- 26.Zhang J, Malicka J, Gryczynski I, Lakowicz JR. J Phys Chem B. 2005;109:7643. doi: 10.1021/jp0490103. [DOI] [PMC free article] [PubMed] [Google Scholar]
- 27.Liu Y, Mahdavi F, Blair S. IEEE J Select Topics Quant Electron. 2005;11:778. [Google Scholar]
- 28.Corrigan TD, Guo S, Phaneuf J, Szmacinski H. J Fluorescence. 2005;15:777. doi: 10.1007/s10895-005-2987-3. [DOI] [PubMed] [Google Scholar]
- 29.Ebbesen TW, Lezec HJ, Ghaemi HF, Thio T, Wolff PA. Nature (London) 1998;391:667. [Google Scholar]
- 30.Andrew P, Barnes WL. Phys Rev B. 2001;64:125405. [Google Scholar]
- 31.Coe VC, Williams SM, Rodriguez KR, Teeters-Kennedy S, Sudnitsyn A, Hrovat F. Anal Chem. 2006;78:1384. doi: 10.1021/ac069371+. [DOI] [PubMed] [Google Scholar]
- 32.Enderlein J, Ruckstuhl T. Opt Exp. 2005;13:8855. doi: 10.1364/opex.13.008855. [DOI] [PubMed] [Google Scholar]
- 33.Pompa PP, Martiradonna L, Della Torre A, Della Sala F, Manna L, De Vittorio M, Calabi F, Cingolani R, Rinaldi R. Nature Nanotechnol. 2006;1:126. doi: 10.1038/nnano.2006.93. [DOI] [PubMed] [Google Scholar]
- 34.Chen Y, Munechika K, Ginger DS. Nano Lett. 2007;7:690. doi: 10.1021/nl062795z. [DOI] [PubMed] [Google Scholar]
- 35.Tam F, Goodrich GP, Johnson BR, Halas NJ. Nano Lett. 2007;7:496. doi: 10.1021/nl062901x. [DOI] [PubMed] [Google Scholar]
- 36.Biteen JS, Lewis NS, Atwater HA, Martens H, Polman A. Appl Phys Lett. 2006;88:131109. [Google Scholar]
- 37.Ng MY, Liu WC. Appl Phys A. 2007;89:391. [Google Scholar]


