Abstract
Bays and Husain (Reports, 8 August 2008, p. 851) reported that human working memory, the limited information currently in mind, reflects resources distributed across all items in an array. In an alternative interpretation, memory is limited to several well-represented items. We argue that this item-limit model fits the extant data better than the distributed-resources model and is more interpretable theoretically.
Human working memory temporarily represents limited information, but the nature of the information limit remains controversial. Previous research (1, 2) supported a model in which working memory is limited to a fixed number of items, typically three or four. Bays and Husain (3) argued that, instead, working memory resources are distributed among all items, as sparsely as is necessary. We argue that Bays and Husain incorrectly assessed the item-limit model and that the evidence favors it over the distributed-resources model. Bays and Husain (3) presented haphazard arrays of items, each followed by a probe item displaced from an array item. The task was to indicate the direction of probe displacement. In their model, distribution of memory resources among all items results in greater variance with increasing array size, diminishing the resources available for each item (see Fig. 1A). The probability of indicating one displacement direction (in one condition, outward as opposed to inward) is
| (1) |
where i indexes the number of array items (array size), j indexes the level of displacement of the probe, Φ is the standard normal cumulative distribution function, dj is the displacement of the probe, µi is a shift parameter, Ni is the array size, σ0 is the standard deviation for Ni = 1, and r is a power constant.
Fig. 1.
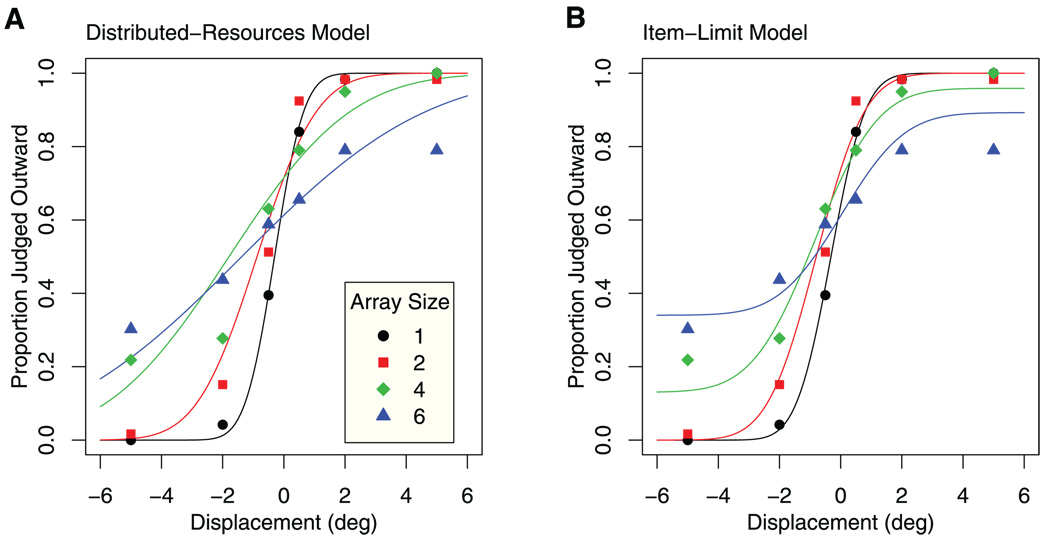
Two models of performance in an array-item displacement judgment task in which gaze remained at fixation (3). Data points in each panel are the proportions of trials in which the displacement was judged to be outward, as a function of the displacement in degrees of visual angle. The graph parameter indicated by point shapes is array size. To fit the models, the function SSE = ∑i,j[sin−1(p̂ij 0.5) − sin−1(pij 0.5)]2 was minimized, where the arcsin-square-root transform stabilizes variance across the range of proportions. Root mean square error was higher for the distributed-resources model (0.092) than for the item-limit model (0.078). (A) Lines represent the best-fitting distributed-resources model of Bays and Husain (3). Best-fitting parameters were σ0 = 0.75, r = 1.03, and µi = (0.30, 0.88, 1.79, and 1.38) degrees for the four array sizes, respectively. (B) Lines represent the best-fitting item-limit model. Best-fitting parameters were σ0=1.62, k=3.31, g=0.76, and µi = (0.32, 0.80, 0.84, and −0.04) degrees for the four array sizes, respectively. The model asymptotes at greater than zero on the low end and less than one on the high end.
Bays and Husain (3) claimed their model outperformed the item-limit model of Zhang and Luck (1), but the comparison was unfair. The latter model holds that a fixed number of working memory slots is available, each representing a single item to fixed precision. When there are too few slots and the probed array item is not represented, the participant guesses randomly; consequently,
| (2) |
where g is the probability of guessing outward. What Bays and Husain overlooked was another postulate of the model. If the number of available slots, k, exceeds the number of array items, Ni, more than one slot represents an item concurrently. (Note that slots doubling up on an item like this may help to exclude distractions by protecting the extra slot.) Consequently,
| (3) |
The item-limit model makes predictions much like the distributed-resources model, given a moderate range of probe displacement (see Fig. 1B). The best fit for this model was with k = 3.31 items, in the expected range (1, 2, 4). The increase in response variance across array sizes for N < k is due to the doubling up of slots, contradicting the claim that “The item-limit model of visual working memory predicts that discrimination performance will begin to decline only once the limiting number of items is exceeded” (3). The continued increases in variance for N > k are due to increased guessing.
The item-limit model slightly bested the distributed-resources model for three of the four conditions in (3) and tied in the fourth (displacement judgments with eye movements). The two models diverge in predictions when the displacements are extreme (beyond about 4σ0, or about 3 degrees according to our model shown in Fig. 1A) and the array size is large (≥4). Although there is relatively little evidence in this range, the available evidence does not favor the distributed-resources model, as one can see from figure 3D and supplementary figure S2 in (3). The item-limit model, in contrast, fit extremes in a study requiring item reproduction (1).
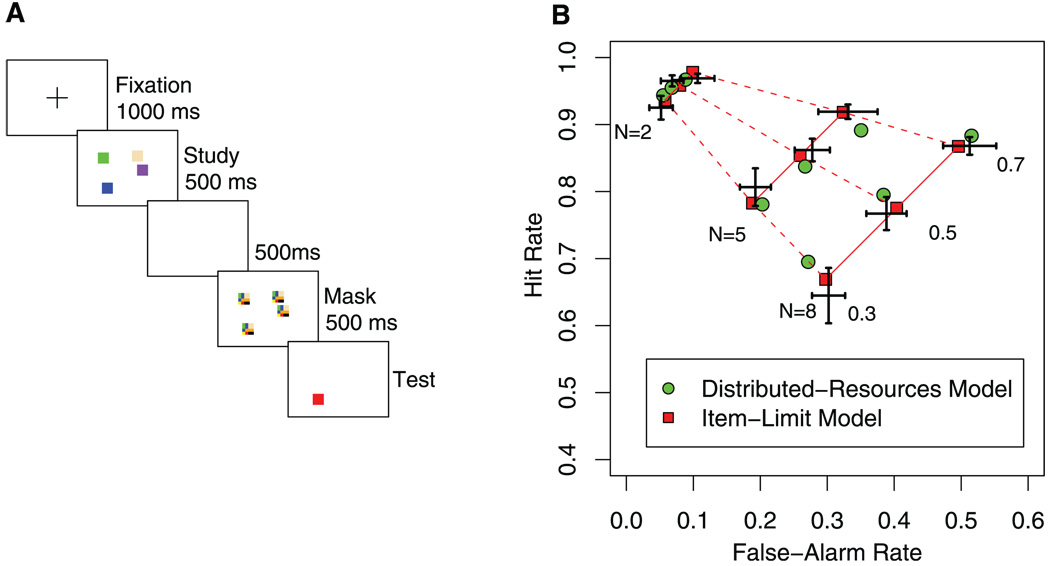
The models can also be compared in another paradigm (2). In the task (Fig. 2A), participants decided whether the probe’s color was the same as the corresponding array item at study or differed categorically from all items in the array. A key manipulation was base rate, the proportion of trials in which color changed. There were three base rates (0.3, 0.5, and 0.7) in different blocks of trials, with the rate always known to the participant. If working memory has discrete slots and one slot per item suffices for categorical colors, then base-rate information can affect guessing processes only when the probed item has no slot. The predictions from this paradigm are expressed in terms of hits, the probability that changed-color probes are identified as such, and false alarms, the probability that unchanged-color probes are identified as changed. A receiver operating characteristic plot of these measures is shown in Fig. 2B. Hit and false-alarm rates for the item-limit model, denoted Him and Fim, where m is the base-rate level, are
| (4) |
| (5) |
Fig. 2.
Procedure and data from Rouder et al. (2), with model fits from the item-limit and distributed-resources models. (A) On each trial, an array of differently colored squares was followed by a blank interval and then a post-perceptual mask. This mask was followed by a single-item probe, which the participants classified as the same as or different from the corresponding study square. The number of squares in the study array was 2, 5, or 8, and the base rate for a change (altered across trial blocks and known to participants) was 0.3, 0.5, or 0.7. Drawing is not to scale. (B) Receiver operating characteristics. Group results from (2) and averaged predictions for two models. Crosses reflect the data ± SEM on both axes. The averaged predictions of the item-limit model are denoted by the red squares. In this model, the predictions for each array size fall along a different solid line (with slope 1), and the predictions for each base rate fall along a different dashed line. The averaged predictions of the distributed-resources model results are denoted by the green circles. With five parameters per model, the results favored the item-limit model, −2 log-likelihood difference = 7.05.
Ni is the array size, a is the probability the array was attended, k is item capacity, and gm is the rate of guessing that there was a change (2). The slope of the receiver operating characteristic lines in Fig. 2B is 1.0, with an intercept dependent only on set size (solid lines), whereas the placement of points on these lines reflects only base rates (dashed lines). We implemented the distributed-resources model for this paradigm in a signal detection framework in which the participant perceives an amount of apparent change along a linear dimension and must judge whether this amount arose from one normal distribution, for no-change trials, or from another shifted rightward by a unit amount, for color-change trials. The standard deviation of the distributions depends on the array size: . Hit and false alarm rates are
| (6) |
| (7) |
where d’i = 1/σi. For the experiment in which three base rates were crossed with three array sizes (2), the item-limit and distributed-resource models each have five free parameters. Figure 2B shows that the item-limit model outperformed the distributed-resources model. The models were fit to individuals and a difference in summed deviance (−2 log-likelihood) of 7.05 favored the item-limit model, fitting the means closely.
Extant evidence favors item-limit models (1, 2, 4–10). Moreover, advocates of the distributed-resources model (3) left unstated a psychological or neural interpretation of their power law. Item limits apparently hold regardless of item precision (6), have known neural bases (7), and may occur because of a limited time for items to be reactivated in succession within a processing cycle (8) without confusion between features of different items (9).
Footnotes
Information about obtaining reprints of this article or about obtaining permission to reproduce this article in whole or in part can be found at: http://www.sciencemag.org/about/permissions.dtl
References and Notes
- 1.Zhang W, Luck SJ. Nature. 2008;453:233. doi: 10.1038/nature06860. [DOI] [PMC free article] [PubMed] [Google Scholar]
- 2.Rouder JN, et al. Proc. Natl. Acad. Sci. U.S.A. 2008;105:5975. doi: 10.1073/pnas.0711295105. [DOI] [PMC free article] [PubMed] [Google Scholar]
- 3.Bays PM, Husain M. Science. 2008;321:851. doi: 10.1126/science.1158023. [DOI] [PMC free article] [PubMed] [Google Scholar]
- 4.Cowan N. Behav. Brain Sci. 2001;24:87. doi: 10.1017/s0140525x01003922. [DOI] [PubMed] [Google Scholar]
- 5.Jonides J, et al. Annu. Rev. Psychol. 2008;59:193. doi: 10.1146/annurev.psych.59.103006.093615. [DOI] [PMC free article] [PubMed] [Google Scholar]
- 6.Awh E, Barton B, Vogel EK. Psychol. Sci. 2007;18:622. doi: 10.1111/j.1467-9280.2007.01949.x. [DOI] [PubMed] [Google Scholar]
- 7.Xu Y, Chun MM. Nature. 2006;440:91. doi: 10.1038/nature04262. [DOI] [PubMed] [Google Scholar]
- 8.Lisman JE, Idiart MAP. Science. 1995;267:1512. doi: 10.1126/science.7878473. [DOI] [PubMed] [Google Scholar]
- 9.Luck SJ, Vogel EK. Trends Cogn. Sci. 1998;2:78. doi: 10.1016/s1364-6613(98)01143-7. [DOI] [PubMed] [Google Scholar]
- 10.Cowan N. Working Memory Capacity. New York: Psychology Press; 2005. [Google Scholar]
- 11.This research was supported by NIH grants R01 HD-21338 and R01-MH071418 and National Science Foundation grant SES-035-1523. The authors contributed equally to the article.


