

Summary
Twenty cognitively normal (CN), 17 amnestic mild cognitive impairment (aMCI), and 8 subjects with probable Alzheimer's disease (AD) were imaged with both magnetic resonance imaging (MRI) and the amyloid labeling ligand 11C Pittsburgh Compound B (PiB). PiB retention was quantified as the ratio of uptake in cortical regions of interest (ROIs) to the uptake in the cerebellar ROI in images acquired 40-60 minute post injection. A global cortical PiB retention summary measure was derived from six cortical ROIs. Statistical parametric mapping (SPM) and voxel-based morphometry (VBM) were used to evaluate PiB retention and grey matter loss on a 3D voxel-wise basis.
AD subjects had high global cortical PiB retention and low hippocampal volume; most CN subjects had low PiB retention and high hippocampal volume; and on average aMCI subjects were intermediate on both PiB and hippocampal volume. A target-to-cerebellar ratio of 1.5 was used to designate subjects as high vs. low PiB cortical retention. All AD subjects fell above this ratio as did 6/20 CN subjects and 9/17 MCI subjects, indicating bi-modal PiB retention in CN and aMCI. Interestingly, we found no consistent differences in learning and memory performance between high vs. low PiB CN subjects or high vs. low aMCI subjects.
The SPM/VBM voxel-wise comparisons of AD vs. CN subjects provided complementary information in that clear and meaningful similarities and differences in topographic distribution of amyloid deposition and grey matter loss were shown. The frontal lobes had high PiB retention with little grey matter loss. Anteromedial temporal areas had low PiB retention with significant grey matter loss. Lateral temporoparietal association cortex displayed both significant PiB retention and grey matter loss.
A voxel-wise SPM conjunction analysis of PiB uptake revealed that subjects with high PiB retention (high CN, high aMCI, and AD) shared a common PiB retention topographic pattern regardless of clinical category, and this PiB topographic pattern matched that of amyloid plaque distribution that has been established in autopsy studies of AD.
Both global cortical PiB retention and hippocampal volumes demonstrated significant correlation in the expected direction with cognitive testing performance; however, correlations were stronger with MRI than PiB. Pair-wise inter-group diagnostic separation was significant for all group-wise pairs for both PiB and hippocampal volume with the exception of CN vs. aMCI which was not significant for PiB. PiB and MRI provided complementary information such that clinical diagnostic classification with both, in combination, was superior to either alone.
Keywords: Alzheimer's disease, Mild Cognitive Impairment, Pittsburgh Compound B, amyloid imaging, Magnetic Resonance Imaging, hippocampus
Introduction
The pathologic hallmarks of Alzheimer's disease (AD) are amyloid plaques and neurofibrillary tangles. Other pathologic changes associated with AD are loss of neurons, loss of synapses, and dendritic dearborization. Although these latter neuronal changes are less amenable to assessment by standard pathologic techniques, neuronal changes, particularly synapse loss, have been identified as the most proximate histological substrate of the observed clinical symptoms in AD (Terry et al., 1991).
The most significant advance in dementia imaging in recent years has been the development of in vivo amyloid plaque labeling compounds (Klunk et al., 2004; Small et al., 2006; Verhoeff et al., 2004). The most widely studied in vivo amyloid labeling tracer at this point is the PET ligand {N-methyl-11C}2-(4'-methylaminophenyl)-6-hydroxybenzothiazole also know as Pittsburgh Compound B or PiB (Klunk et al., 2004). In vivo PiB studies demonstrate a roughly two-fold increase in tracer retention in AD patients compared to most cognitively normal elderly subjects (Klunk et al., 2004). Moreover, the topographic distribution of PiB retention matches that expected on the basis of autopsy studies of regional fibrillar plaque distribution (Braak and Braak, 1991; Rowe et al., 2007). Greatest retention values are seen in prefrontal and lateral temporoparietal cortex, posterior cingulate/precuneus, and striatum (Edison et al., 2007; Engler et al., 2006; Forsberg et al., 2007; Kemppainen et al., 2006; Klunk et al., 2004; Mintun et al., 2006). Occipital lobe and thalamus display lower uptake values. The lowest uptake values are seen in the medial temporal lobe and primary visual and sensory motor cortical areas. In short, the topographic pattern of PiB binding corresponds to Braak and Braak plaque stage C in most cases of clinically established AD (Braak and Braak, 1991; Rowe et al., 2007). PiB binds to fibrillar amyloid primarily in neuritic and diffuse plaques although in the only imaging-autopsy study published to date, PiB binding correlated to both plaques and vascular amyloid (amyloid angiopathy) (Bacskai et al., 2007). Uptake in cerebellar grey matter does not differ between AD and cognitively normal (CN) subjects as would be predicted because few, if any, fibrillar plaques are typically found in the cerebellum in AD at autopsy (Rowe et al., 2007). Nearly all clinically diagnosed AD subjects reported to date have PiB retention, while the majority of CN do not. However, approximately 30% of CN subjects demonstrate amyloid retention levels in cortex which are in the typical range for AD (Mintun et al., 2006). This is consistent with autopsy studies which find pathology consistent with a pathological diagnosis of AD in up to 30% of clinically asymptomatic subjects (Crystal et al., 1993; Hulette and Welsh-Bohmer, 1998; Katzman et al., 1988; Knopman, Parisi and Salviati, 2003; Morris and Price, 2001; Price and Morris, 1999; Riley, Snowdon and Markesbery, 2002; Schmitt, Davis and Wekstein, 2000). PiB studies which have included patients with amnestic mild cognitive impairment (aMCI) typically find that on average, the MCI group lies in an intermediate position between CN and AD subjects. However, approximately two-thirds of aMCI subjects cluster in the AD range with a topographic PiB distribution pattern that is indistinguishable from AD, while 1/3 of MCI subjects cluster in the CN range (Kemppainen et al., 2007; Lopresti et al., 2005; Rowe et al., 2007). Cortical PiB and CSF A□ 42 levels are inversely correlated in both demented and non-demented subjects (Fagan et al., 2006). Cortical PiB binding is typically present in patients with dementia with Lewy bodies, but at lower levels than in patients with AD (Rowe et al., 2007). PiB binding is absent in the majority of clinically diagnosed patients with frontotemporal dementia and when present could represent either coexistent AD and FTLD pathology or clinical misdiagnosis (Rabinovici et al., 2007; Rowe et al., 2007). Strong spatial correlation exists between the topography of PiB deposition and default mode functional MRI patterns (Buckner et al., 2005). Rates of brain atrophy from serial MRI studies are greater in AD patients with higher PiB retention (Archer et al., 2006).
Structural magnetic resonance imaging (MRI) has been employed to study AD for over a decade and a half. Initial structural MRI (sMRI) studies aimed at early diagnosis focused on medial temporal lobe anatomy, particularly the hippocampus, due to the well established topographic progression of neurofibrillary pathology which begins in the medial temporal lobe structures and progresses from there to paralimbic, basal temporal, and other neocortical association areas (Braak and Braak, 1991; de Leon, George, Stylopoulos, Smith and Miller, 1989; Jack, Petersen, O'Brien and Tangalos, 1992; Killiany et al., 1993; Laakso et al., 1998). Hippocampal volumes measured from antemortem MRI scans correlate with Braak neurofibrillary tangle pathologic staging in both demented and non-demented subjects (Gosche, Mortimer, Smith, Markesbery and Snowdon, 2002; Jack et al., 2002). Antemortem hippocampal volume from MRI correlates with hippocampal neurofibrillary tangle density (Csernansky et al., 2004; Silbert et al., 2003) at autopsy and antemortem brain volume on MRI correlates with hippocampal plaque density (Csernansky et al., 2004). Antemortem rates of brain atrophy correlate with neurofibrillary tangle density and rates of ventricular expansion correlate with both plaque and tangle density at autopsy (Silbert et al., 2003). Excellent correlation is found between hippocampal volume measures obtained on either antemortem MRI (Zarow et al., 2005) or post mortem MRI (Bobinski et al., 2000) and hippocampal neuron cell counts in autopsy specimens. On the basis of these imaging-to-pathologic correlation studies, quantitative measures from structural MRI, such as hippocampal volume, are inferred to represent an approximate surrogate of the stage/severity of neuronal pathology - neuron loss, neuron shrinkage, and synapse loss - that occurs in AD. Voxel-wise studies of grey matter loss in both AD and aMCI demonstrate that the topographic distribution of grey matter loss closely mirrors the spatial distribution of neurofibrillary pathology described by Braak and Braak (Baron et al., 2001; Chetelat et al., 2002; Frisoni et al., 2002; Rombouts, Barkhof, Witter and Scheltens, 2000; Senjem, Gunter, Shiung, Petersen and Jack, 2005; Whitwell et al., 2007a; Whitwell et al., 2007b).
To date, most diagnostic imaging comparisons between amyloid labeling ligands and other imaging modalities have been between PiB and FDG-PET (Edison et al., 2007; Engler et al., 2006; Forsberg et al., 2007). Our objectives in the present study were two-fold. First to compare cognitive performance and diagnostic group-wise discrimination in CN, aMCI, and AD subjects with MRI-based measures of hippocampal volume and PiB retention. Our second objective was to evaluate the topographic distribution of PiB retention and grey matter loss using 3D voxel-wise methods.
Methods
Subjects
All subjects were recruited from the Mayo Alzheimer's Disease Research Center (ADRC) or Alzheimer's Disease Patient Registry (ADPR) (Petersen, Kokmen, Tangalos, Ivnik and Kurland, 1990). These are longitudinal studies of aging and dementia which include serial MRI, clinical and cognitive assessments. At baseline, all subjects met criteria for CN or aMCI or AD. Categorization into diagnostic groups was made on a clinical basis at consensus conferences including neurologists, neuropsychologists, a neuropsychiatrist, and study coordinators. CN subjects were asymptomatic cognitively normal volunteers. Criteria for the categorization of CN were: 1) no active neurological or psychiatric disorders, 2) some subjects may have had ongoing medical problems, yet the illnesses or their treatments did not interfere with cognitive function, 3) normal neurological exam, 4) were independently functioning community dwellers. Criteria for the diagnosis of aMCI were those of Petersen et al (Petersen et al., 2001): 1) memory complaint documented by the patient and collateral source, 2) relatively normal general cognition, 3) normal activities of daily living, 4) not demented (DSM-IV), 5) memory impaired for age and education. In general, the aMCI determination is made when the memory measures fall −1.0 to −1.5 standard deviations below the means for age and education appropriate individuals in our community. Rigid cutoffs on psychometric scores were however not used to establish the diagnosis of aMCI which was made on clinical grounds. The diagnosis of dementia was made using DSM-IV criteria (1994), and the diagnosis of AD was made using established criteria (McKhann et al., 1984). The Clinical Dementia Rating scale - sum of boxes (CDR-SB) was used to assess functional performance (Morris, 1993). A 38 item test, the Short Test of Mental Status (STMS) (Kokmen, Smith, Petersen, Tangalos and Ivnik, 1991), was used to assess global cognitive performance. Because this test, while sensitive to differences between CN and MCI, is not widely used, we converted STMS scores to Mini Mental State Exam (MMSE) (Folstein, Folstein and McHugh, 1975) scores using an algorithm developed at our center (Tang-Wai et al., 2003). STMS values transformed to MMSE scores are reported as MMSE* throughout the manuscript. Learning and memory performance was assessed with the Wechsler Memory Scale-Revised (WMS-R) visual reproduction II, WMS-R logical memory II, Auditory Verbal Learning test (AVLT) delayed recall, and AVLT sum of learning trials 1-5 (Rey, 1964; Wechsler, 1987).
The ADPR and ADRC studies have included serial MRI examinations for a number of years. The capacity to perform PiB studies at our institution was brought online within the past year. Subjects included in this study represent all CN, aMCI, and AD subjects recruited to date (20 CN, 17 aMCI, and 8 AD) who volunteered to participate in both MRI and PiB. No other criteria were used to select the subjects in this analysis. One potential AD subject that did undergo PiB imaging was excluded from this analysis because of elevated PiB retention in cerebellar cortex. In the absence of an accepted physiological explanation, this unexpected finding is under independent investigation.
MRI Methods
All MRI studies were performed with a standardized imaging protocol. Forty one of these subjects were imaged at 3T with a 3D magnetization prepared rapid acquisition gradient echo (MPRAGE) imaging sequence developed for the Alzheimer's Disease Neuroimaging Initiative study (Jack et al., 2007) . Parameters were: TR/TE/T1, 2300/3/900 msec; flip angle 8 degrees, 26 cm field of view (FOV); 256 × 256 in-plane matrix with a phase FOV of .94, and slice thickness of 1.2 mm. Four subjects were studied at 1.5T with a coronal volumetric SPGR sequence: 124 contiguous partitions, 1.6 mm slice thickness, 24 × 18.5 cm FOV, minimum full TE, TR 23 ms, and 25 degree flip angle. All scanners undergo a standardized quality control calibration procedure every morning which monitors geometric fidelity over a 200 mm volume along all three cardinal axes, signal-to-noise ratio, and transmit gain.
All scans underwent correction for gradient non-linearity (gradwarp) and intensity non-uniformity (Jack et al., 2007). MRI processing steps were performed by a research technician (MMS) who was blinded to all clinical information. The borders of the left and right hippocampi were traced sequentially from posterior to anterior using anatomic landmarks that have been previously published (Jack et al., 1989). Test re-test reproducibility expressed as coefficient of variation for hippocampal volume measurements has been previously measured at 0.28% (Jack et al., 1998). Because four subjects were scanned at 1.5T, we performed internal quality assurance testing comparing hippocampal tracing results in 10 healthy elderly volunteer subjects who underwent MRI exams at both 1.5T and 3T on the same day. The median hippocampal volume difference between the two field strengths was 3.3 mm3 (or 0.1%). The intra-class correlation between hippocampal volume measurements at the two field strengths was 0.99. Therefore, we find no systematic difference between field strengths on this measure.
Total intracranial volume was determined by tracing the margins of the inner table of the skull on contiguous images of the T1-weighted spin echo sagittal MR scan (Jack et al., 1989). Raw hippocampal volumes were adjusted for age, gender, and total intracranial volume using a W score method (Jack et al., 1997). Hippocampal W scores can be considered age, gender, and head size adjusted Z scores with 0 mean and SD 1 among normal elderly subjects. Negative W scores, therefore, indicate adjusted volumes below the expected mean for cognitively normal elderly. W scores of −1.65 and 1.65 correspond to the 5th and 95th percentiles in our normal elderly reference population (O'Brien and Dyck, 1995).
Voxel-based morphometry (VBM), within the statistical parametric mapping (SPM5) suite (Ashburner and Friston, 2000), was used to evaluate brain morphometry on a voxel-wise basis. A custom template and tissue probability maps (TPMs) were created in SPM5 using the T1-weighted 3D MRI scans from all 45 subjects in the study. The custom template and TPMs were created by first normalizing and segmenting the 45 scans using the unified segmentation model in SPM5 with the standard MNI template and TPMs, followed by a clean up step which uses a hidden markov random field (HMRF) model to increase the accuracy of the individual subject TPMs, and finally averaging the normalized subject TPMs. All subject images were then normalized and segmented using the unified segmentation model and the custom TPMs, followed by the HMRF clean up step. Jacobian modulation was applied to compensate for the effect of spatial normalization and to restore the original absolute grey matter density in the segmented grey matter images. These modulated images were then smoothed with an 8 mm FWHM smoothing kernel. Grey matter differences between groups were assessed using a two-sided T-test within the general linear model framework of SPM.
PiB Imaging
Production of PiB and radio labeling with 11C was performed as outlined by Mathis (Mathis et al., 2003). The mean administered activity was 628 MBq (range 385 to 723 MBq). At 25 minutes, a helical CT image was obtained for attenuation correction. The PET acquisition consisted of 5 minute dynamic frames from 40-60 minutes post injection. PET sinograms were iteratively reconstructed into a 256 mm FOV. The pixel size was 1.0 mm and the slice thickness 3.3 mm. Individual frames of the PiB dynamic series were realigned if motion was detected and then a mean image was created, referred to from here on as the late uptake image.
PiB Image Processing and Atlas-based Brain Parcellation for Quantitative PiB ROI Analysis
The automated anatomic labeling (AAL) atlas (Tzourio-Mazoyer et al., 2002) was modified in-house to contain the following labeled regions of interest (ROI): right and left parietal, temporal, prefrontal, thalamus, striatum, primary sensory -motor, orbito frontal, anterior cingulate, posterior cingulate/precuneus, occipital excluding primary visual, and primary visual. The high resolution T1 weighted single subject brain image (Tzourio-Mazoyer et al., 2002) with atlas labels was normalized to the custom template described above in the VBM section using the unified segmentation method in SPM5 (Ashburner and Friston, 2005), giving a discrete cosine transformation (DCT), say F, which normalizes the atlas brain to custom template space. The late uptake PiB image volume of each subject was co-registered to his/her own T1-weighted MRI scan, using a 12 DOF affine registration with mutual information cost function. Each subject MRI scan was then spatially normalized to the custom template using the unified segmentation model of SPM5 (Ashburner and Friston, 2005), giving a DCT transformation, say Gi, which normalizes the MRI of subject i to the custom template. Then for each subject, the composite transformation Gi−1(F(.)) was applied to the atlas in order to warp the atlas to the subject's native anatomical space. Atlas-based parcellation of PiB images into ROIs was therefore performed in subject space. For each subject, the native-space segmented grey matter probability map generated from the unified segmentation routine was thresholded at a value of 0 to create a binary grey matter mask. Each subject's grey matter mask was then multiplied by the subject-specific warped atlas, to generate a custom grey matter atlas for each subject, parcellated into the aforementioned ROIs. This step was performed in order to minimize inclusion of both CSF and white matter (and thus non-specific white matter PiB retention) in statistics of all ROIs, including the cerebellar ROI, which was used as an input reference (Meltzer et al., 1999; Sun et al., 2007). Statistics on image voxel values were extracted from each labeled cortical ROI in the atlas. PiB ratio images were calculated by dividing the median value in each target cortical ROI value by the median value in the cerebellar grey matter ROI of the atlas. A global cortical PiB retention summary measure was formed by combining the prefrontal, orbitofrontal, parietal, temporal, anterior cingulate, and posterior cingulate/precuneus ratio values for each subject, with equal weighting of the individual values in computing the summary measure.
SPM5 (Ashburner and Friston, 2005) was used to evaluate PiB retention on a voxel-wise basis. Spatial normalization of individual late uptake PiB images to custom template space was performed using the DCT normalization parameters obtained from the co-registered MRI described above. All voxels in the normalized late uptake PiB images were divided by the median PiB uptake of the cerebellar grey matter ROI in each subject to form uptake ratio images. Voxel-wise PiB uptake differences between groups were assessed in SPM5 using a multiple regression model, with indicator vectors to specify diagnostic group and either “low” or “high” global PiB retention based on a threshold ratio of 1.5. The rationale for selecting this cutoff value is described in the results section. Statistical maps displaying group differences were displayed at a significance value of p<0.01, corrected for multiple comparisons over the whole brain using the False Discovery Rate correction method (Genovese, Lazar and Nichols, 2002).
Statistical Methods
We compared the proportion of women in each group using a chi-squared test and compared the median age and education across groups using a Kruskal-Wallis test. Differences in performance on the STMS and CDR-SB between the aMCI and AD groups were tested using a two-sided Wilcoxon rank-sum test. Pair-wise group differences on global PiB retention and hippocampal W score are reported as differences in medians with 95% confidence intervals and tested using two-sided Wilcoxon rank-sum tests. These non-parametric methods were used due to skewness in the demographic, functional, and imaging measures.
We evaluated the ability of these imaging measures to discriminate between groups by calculating the area under the receiver operating characteristic (ROC) curve and 95% confidence intervals. We summarize how well the imaging variables discriminate or predict among clinical groups using the concordance statistic, a generalization of the area under the ROC curve, and RN2, a generalization of the coefficient of determination from a linear regression model (Harrell, 2001). The concordance statistic can be interpreted as the proportion of times a pair of randomly selected patients can be correctly ordered on their clinical group using only the predictors in the model while RN2 can be interpreted as the proportion of the data log likelihood accounted for by the model relative to a “perfect fitting” or saturated model, taking into account model complexity.
We estimated the relationship between imaging measures and clinical group using proportional odds logistic regression (POLR) (Harrell, 2001; McCullagh, 1980). POLR is a generalization of binary logistic regression that can be used when there are more than two groups and there is a natural ordering to the groups. In our approach, we assume that on the cognitive impairment spectrum we have the ordering CN < aMCI < AD. Our POLR models have a single coefficient that characterizes the effect of a predictor on the outcome variable. In the models we fit, the coefficients for the imaging predictors represent the log odds of a more impaired diagnosis, in other words the log odds of moving from CN to aMCI or AD, or moving from aMCI to AD. One advantage of having a single coefficient describe the relationship between imaging predictors and clinical group is model parsimony. Another is that the model can be considered as a regression model in which the dependent variable (clinical group) can be interpreted as a discretized or coarsened version of an underlying continuous cognitive impairment spectrum. We fit and report on four POLR models: a model with global cortical PiB retention only, a model with hippocampal W score only, an additive model with both these terms, and a model with both terms and an interaction. We compared the predictive ability of models with more versus fewer predictors using likelihood ratio tests.
Results
Demographics
The 20 CN, 17 aMCI, and 8 AD subjects in this study did not differ significantly on gender, age, or education (Table 1). Performance on the STMS and CDR-SB was best in the CN, intermediate in the aMCI, and worst in the AD group. Four of the 17 aMCI and 7/8 AD subjects were being treated with cholinesterase inhibitors. Fourteen of the 17 aMCI subjects were classified as single domain (i.e. memory only impairment), and the remaining 3 aMCI were multi-domain – i.e. predominate memory impairment with lesser impairments in other domains.
Table 1.
Patient characteristics
| Characteristic | CN (n=20) | aMCI (n=17) | AD (n=8) | P-value |
|---|---|---|---|---|
| No. of women (%) | 8 (40.0) | 5 (29.4) | 5 (62.5) | 0.31 a |
| Median (range) age, y | 76 (72, 90) | 79 (56, 87) | 70 (54, 91) | 0.17 b |
| Median (range) education, y | 14 (12, 20) | 15 (8, 20) | 14 (12, 18) | 0.84 b |
| Median (range) CDR-SB | 0 (0, 0.5) | 1.5 (0, 4.5) | 5.25 (3.5, 9.0) | <0.001 c |
| Median (range) MMSE* | 28 (24, 30) | 27 (21, 28) | 18 (11, 25) | <0.001 c |
Transformed from the Short Test of Mental Status
CN vs. aMCI vs. AD using Fisher exact
CN vs. aMCI vs. AD using Kruskal-Wallis
aMCI vs. AD using Wilcoxon rank-sum
PiB Region of Interest Analysis
Right- and left-sided homologous PiB ROI's demonstrated high within subject intra-class correlation, typically above 0.90 and ranging from 0.79 for the temporal ROI to 0.99 for prefrontal. Therefore, the right and left sides were combined for quantitative analyses. Raw cerebellar PiB uptake values on late sum images did not differ by group (p= 0.46). This is consistent with the literature and supports use of this ROI as a reference input for normalizing raw cortical PiB retention in this study (Lopresti et al., 2005). Figures 1 and 2 illustrate PiB uptake ratios by group for different ROI's. All ROI's examined except medial temporal were different among the three groups. For data reduction purposes, we combined the six cortical ROIs in Figure 1 into a global cortical retention ratio value. The rationale for combining these six ROI's into a single global cortical ratio value was several-fold, 1) these cortical areas have been shown on autopsy studies to have high amyloid deposition in AD (Braak and Braak, 1991), 2) published reports have consistently shown high PiB uptake in these cortical areas (Edison et al., 2007; Engler et al., 2006; Forsberg et al., 2007; Kemppainen et al., 2006; Klunk et al., 2004; Mintun et al., 2006), and 3) as shown in Supplemental Figure E1, these six cortical PiB ROI ratios are highly inter-correlated, having an intra-class correlation of 0.91.
Figure 1. Regions of interest that constitute the global cortical PiB retention value.
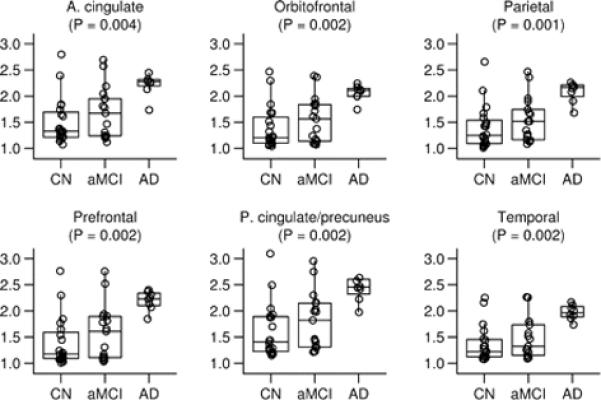
Box plots with individual data points superimposed. The horizontal lines in the box plots represent the 25th, 50th, and 75th percentiles. The vertical line extending from the box reaches the most extreme data point within 1.5 inter-quartile ranges. Individual data points represent the subject's median target-to-cerebellar ratio over all voxels in the region of interest. The p-value shown is based on the three-sample Kruskal-Wallis test.
Figure 2. Regions of interest not part of the global cortical PiB retention value.
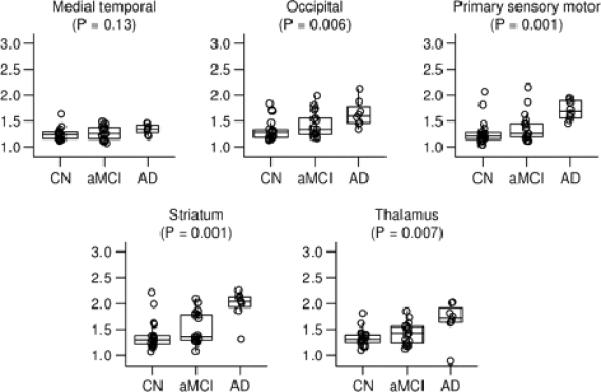
Box plots with individual data points superimposed. The horizontal lines in the box plots represent the 25th, 50th, and 75th percentiles. The vertical line extending from the box reaches the most extreme data point within 1.5 inter-quartile ranges. Individual data points represent the subject's median target-to-cerebellar ratio over all voxels in the region of interest. The p-value shown is based on the three-sample Kruskal-Wallis test.
Table 2 lists summary global cortical PiB retention ratio, hippocampal volume in mm3, and hippocampal volume W score values by clinical group. Box plots with individual data points for all subjects in each of the three clinical groups are illustrated in Figure 3 for global cortical PiB and hippocampal W score. These plots illustrate that on AD subjects are characterized by high PiB and low hippocampal W score; most CN subjects are characterized by low PiB and high hippocampal W score; and group averages for aMCI subjects are intermediate on both PiB and hippocampal W score. However, there are important individual deviations from this pattern. With the exception of one CN subject with an extremely low hippocampal W score (labeled subject B in Figures 3, 5 and 6), the AD and CN hippocampal W score distributions do not overlap; and aMCI subjects are evenly distributed across the AD and CN range. In contrast, while all 8 AD subjects are tightly clustered in the high PiB retention range, both the CN and aMCI subjects segregate themselves into high and low PiB retention groups suggesting bi-modal PiB distribution. Using a ratio of 1.5 as a cut point derived from this data sample, 6/20 CN and 9/17 aMCI subjects can be categorized as high PiB retention subjects. Demographic, imaging and cognitive performance characteristics of CN and aMCI subjects broken out into those with high vs. low PiB retention are provided in Table 3. Among CN subjects, those with high PiB retention were slightly older and better educated. Overall, there were no consistent differences in cognitive performance between high and low PiB retention CN subjects. High PiB CN subjects performed slightly worse on the WMS-R visual reproduction II and WMS-R logical memory II; the same on AVLT delayed recall, CDR-SB and MMSE*; and better on AVLT sum of learning trials. Among aMCI subjects, those with high PiB retention were slightly younger and better educated. Overall, there were no consistent differences in cognitive performance between high and low PiB retention aMCI subjects. High PiB aMCI subjects performed slightly worse on the WMS-R visual reproduction II and CDR-SB; the same on AVLT delayed recall; and better on AVLT sum of trials, MMSE* and WMS-R logical memory II. The hippocampi were slightly more atrophic in high than low PiB CN and aMCI subjects, although the difference was minimal in aMCI subjects. One could criticize the dichotomization of CN and aMCI subjects into high and low PiB retention groups. However, unlike MRI where all subjects have hippocampi whose volume resides on a continuous scale; the notion that some subjects do and some do not have brain amyloidosis has face validity. The notion of diagnostically positive vs. negative PiB scans has been introduced previously (Rabinovici et al., 2007), as has the notion of using a specific cut point to segregate PiB scans into “AD-like” vs. normal (Pike et al., 2007). While the specific cut point of 1.5 may not apply to other samples, dividing subjects into those with and those without cortical PiB retention seems biologically sensible.
Table 2.
Imaging summary statistics
| Imaging measure | CN (n=20) | aMCI (n=17) | AD (n=8) |
|---|---|---|---|
| Global PiB | |||
| Median (IQR) | 1.2 (1.1, 1.6) | 1.6 (1.1, 1.8) | 2.2 (2.1, 2.2) |
| 95% CI for median | 1.2 to 1.6 | 1.3 to 1.8 | 2.0 to 2.2 |
| Range | 1.1 to 2.7 | 1.1 to 2.5 | 1.7 to 2.3 |
| Hippocampal vol., mm3 | |||
| Median (IQR) | 5401 (4621, 5967) | 4685 (4371, 5193) | 3912 (3531, 4586) |
| 95% CI for median | 4955 to 5731 | 4412 to 5145 | 3250 to 4724 |
| Range | 3453 to 6813 | 3895 to 5954 | 2867 to 4939 |
| Hippocampal W score | |||
| Median (IQR) | 0.1 (−0.2, 0.7) | −0.8 (−1.5, 0.1) | −2.6 (−2.6, −2.4) |
| 95% CI for median | −0.2 to 0.7 | −1.3 to −0.3 | −2.7 to −1.9 |
| Range | −2.6 to 2.0 | −2.6 to 0.9 | −2.7 to −1.2 |
Figure 3. Group-wise separation for global cortical PiB and hippocampal W score.
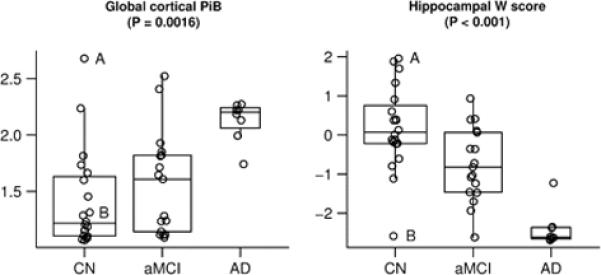
Box plots with individual data points superimposed. The horizontal lines in the box plots represent the 25th, 50th, and 75th percentiles. The vertical line extending from the box reaches the most extreme data point within 1.5 inter-quartile ranges. The p-value shown is based on the three-sample Kruskal-Wallis test. The CN subject with the largest PiB value is identified by the letter “A” and the CN subject with the smallest hippocampal W score is identified by the letter “B”. These two subjects are described in detail in the text.
Figure 5. Atypical findings in CN subjects.
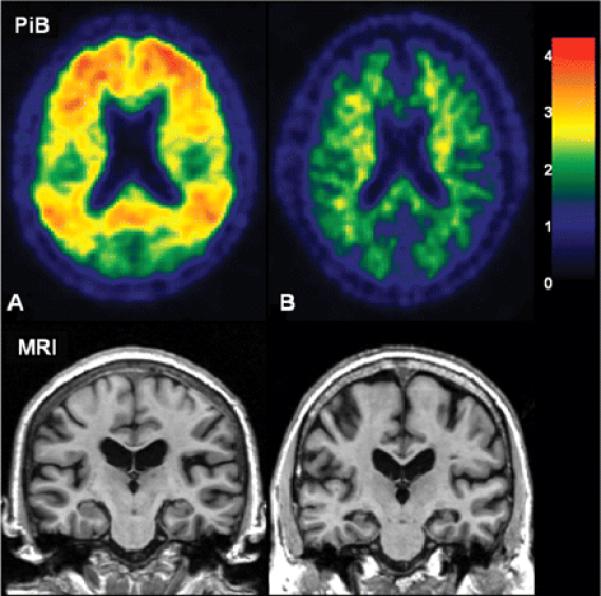
Subject A has the highest global PiB cortical retention ratio in the study but an above average hippocampal W score and normal cognitive function. Subject B has a low hippocampal W score but low PiB retention and normal cognitive function. The color scale bar represents cortical voxel-to-cerebellar retention ratio.
Figure 6. Scatter plot showing relationship between global cortical PiB retention and hippocampal W score.
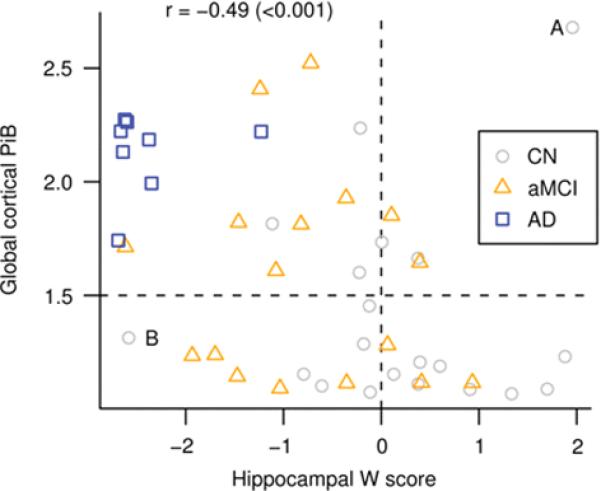
Spearman rank correlation (p-value) indicated in the top left. Reference lines at a W score of zero and a global cortical PiB of 1.5 have been added to the plot to segregate the data into quadrants. The CN subject with the largest PiB value is identified by the letter “A” and the CN subject with the smallest hippocampal W score is identified by the letter “B”.
Table 3.
Detailed characterization of low and high PiB: CN and aMCI
| CN | aMCI | |||
|---|---|---|---|---|
| Characteristic | PiB ≤ 1.5 | PiB > 1.5 | PiB ≤ 1.5 | PiB > 1.5 |
| No. of subjects | 14 | 6 | 8 | 9 |
| No. of women (%) | 6 (42.9) | 2 (33.3) | 1 (12.5) | 4 (44.4) |
| Median (range) age, y | 75 (72, 88) | 78 (73, 90) | 82 (76, 87) | 73 (56, 87) |
| Median (range) education, y | 14 (12, 20) | 16 (12, 20) | 12 (8, 20) | 16 (12, 20) |
| Median (range) MMSE* | 28 (24, 30) | 28 (25, 30) | 26 (21, 28) | 27 (25, 28) |
| Median (range) CDR-SB | 0 (0, 0.5) | 0 (0, 0.5) | 1.0 (0, 2.5) | 1.5 (0.5, 4.5) |
| Median (range) AVLT sum of trials | 36 (24, 52) | 38 (23, 61) | 25 (21, 37) | 29 (25, 35) |
| Median (range) AVLT delayed recall | 7 (2, 11) | 7 (0, 14) | 0 (0, 6) | 0 (0, 4) |
| Median (range) WMS-R logical memory II | 14 (4, 31) | 12 (5, 29) | 4 (0, 20) | 8 (0, 21) |
| Median (range) WMS-R visual reproduction II | 24 (6, 33) | 21(5,31) | 8 (0, 23) | 4 (0, 21) |
| Median (range) global cortical PiB | 1.2 (1.1, 1.5) | 1.8 (1.6, 2.7) | 1.1 (1.1, 1.3) | 1.8 (1.6, 2.5) |
| Median (range) hippocampal W score | 0.3 (−2.6, 1.9) | −0.1 (−1.1,2.0) | −0.7 (−1.9, 0.9) | −0.8 (−2.6, 0.4) |
Transformed from the Short Test of Mental Status
Note: Maximum scores: CDR-SB, 18; MMSE, 30; AVLT sum, 75; AVLT delayed recall, 15; WMS-R logical memory II, 50; WMS-R visual reproduction II, 41.
Quantitative PiB and MRI Comparisons
Representative images of PiB retention ratio by clinical group are found in Figure 4. The AD subject in Figure 4 is a 91 yo woman with a hippocampal W score of −2.6. The CN subject is a 77 yo man with hippocampal W score of 1.9. The low PiB aMCI subject is an 82 yo man with hippocampal W score of −1.7. The high PiB aMCI is an 87 yo woman with hippocampal W score of −0.7. Of interest are two CN subjects with atypical or outlier findings who are labeled subjects A and B in Figures 3, 5, and 6. PiB and MR images of these 2 atypical CN subjects are illustrated in Figure 5. Atypical subject A was an 80 yo woman with the highest global cortical PiB retention ratio (2.7) in the study but who had a hippocampal W score of 2.0 (i.e. non-atrophic) and was cognitively normal with MMSE*, 29; CDR-SB, 0.0; AVLT sum of trials, 53; AVLT delayed recall, 14 (the highest value in the study); WMS-R logical memory II, 19, and WMS-R visual reproduction II, 22. Atypical subject B had an extremely low hippocampal W score (-2.6) but had a low global cortical PiB retention ratio (1.3) and, while performing worse cognitively than atypical subject A, was also cognitively normal with MMSE*, 28; CDR-SB, 0.0; AVLT sum of trials, 30; AVLT delayed recall, 6; WMS-R logical memory II, 13, and WMS-R visual reproduction II, 11.
Figure 4. Typical PiB subjects.

The color scale bar represents cortical voxel-to-cerebellar retention ratio.
We correlated global cortical PiB retention ratio and hippocampal W score (separately) with the WMS-R visual reproduction II, WMS-R logical memory II, AVLT delayed recall, AVLT sum of learning trials, CDR-SB and MMSE* across all 45 subjects in the study. The imaging-cognitive correlations went in the expected directions and were significant at the 0.05 or greater level, except correlations between PiB and AVLT sum of learning trials (p= 0.08) and PiB and MMSE* (p=0.09) which neared significance. The magnitudes of the correlations were greater for hippocampal W score than global cortical PiB retention (Table 4). One could criticize our approach of using W score scaling of hippocampal volumes with no similar scaling of PiB data. The W score scales for inter-subject variation in head size, gender, and age. It is difficult to envision a scenario where PiB retention ratios reliably scale with the first two variables. And without a great deal of additional PiB data in cognitively normal elderly (which is not available yet), it is not clear how one would appropriately scale PiB retention for age.
Table 4.
Pair-wise Spearman rank correlation (p-value) between imaging and clinical functional measures among all subjects
| Global cortical PiB | Hippocampal W score | |
|---|---|---|
| CDR-SB | 0.54 (<0.001) | −0.71 (<0.001) |
| MMSE* | −0.25 (0.09) | 0.44 (0.002) |
| AVLT sum of trials | −0.27 (0.08) | 0.51 (<0.001) |
| AVLT delayed recall | −0.34 (0.03) | 0.47 (0.002) |
| WMS-R logical memory II | −0.36 (0.02) | 0.40 (0.01) |
| WMS-R visual reproduction II | −0.34 (0.03) | 0.56 (<0.001) |
Transformed from the Short Test of Mental Status
For each of three pair-wise diagnostic comparisons - CN vs. aMCI, CN vs. AD, and aMCI vs. AD - the ability of the global cortical PiB retention ratio and hippocampal W score to effect group-wise separation was highly significant (Table 5), with the exception of CN vs. aMCI discrimination by PiB (p = 0.17). Figure 6 is a scatter plot of global PiB vs. hippocampal W score with each subject in the study identified by clinical group membership. While the two modalities are negatively correlated (Spearman's rho = −0.48, p < 0.001) there is considerable scatter of individual points, suggesting that the two modalities do not contain entirely overlapping diagnostic information. Supplemental Table E1 is a numeric representation of the values in the quadrants of Figure 6 by clinical group.
Table 5.
Paired group-wise differences for imaging measures
| Marker | CN vs. aMCI | CN vs. AD | aMCI vs. AD |
|---|---|---|---|
| Global PiB | |||
| P-valuea | 0.17 | <0.001 | 0.004 |
| Difference in medians (95% CI) | −0.39 (−0.51 to 0.05) | −0.99 (−1.06 to −0.53) | −0.59 (−0.99 to −0.32) |
| AUC (95% CI) | 0.64 (0.45 to 0.82) | 0.91 (0.79 to 1.00) | 0.85 (0.69 to 1.00) |
| Hippocampal volume W score | |||
| P-valuea | 0.009 | <0.001 | <0.001 |
| Difference in medians (95% CI) | 0.89 (0.25 to 1.62) | 2.68 (2.06 to 3.11) | 1.79 (0.94 to 2.41) |
| AUC (95% CI) | 0.75 (0.59 to 0.91) | 0.98 (0.94 to 1.00) | 0.93 (0.83 to 1.00) |
AUC, area under the receiver operating characteristic (ROC) curve
Two-sided, two-sample Wilcoxon rank-sum
To evaluate the complementary diagnostic nature of PiB and hippocampal volume further, we used ordinal logistic regression models to assess the ability of global cortical PiB retention and hippocampal W score alone and in combination to diagnostically discriminate among members of the three patient groups. The results are presented in Table 6 and can be summarized as follows. Global PiB (p < 0.001) and hippocampal W score (p < 0.001) were each separately found to be significantly associated with clinical diagnosis. When a model is fit including both these predictors, both the hippocampal W score (p<0.001) and the global PiB term (p=0.04) remain significant.
Table 6.
Summaries of performance of proportional odds ordinal logistic regression models
| Model | Likelihood ratio chi-squared (p-value) a | Concordance/ generalized AUC b | Generalized R2c |
|---|---|---|---|
| Global cortical PiB only | 12.2 (<0.0001) | 0.75 | 0.27 |
| Hippocampal W score only | 29.2 (<0.0001) | 0.84 | 0.55 |
| Global PiB and W scored | 33.4 (<0.0001) | 0.86 | 0.60 |
Note: Due to skewness, global PiB was log transformed
Likelihood ratio test versus the null model
This can be interpreted as the probability of correctly identifying which is the more clinically impaired patient from a pair of patients having different diagnoses using only the imaging measure(s) in the model
This can be interpreted as the model likelihood divided by the likelihood from a saturated, or "perfect fitting" model, after adjusting for model complexity. In some sense, what proportion of the observed data is "explained" by the model
Significantly better than PiB only model (p<0.001) and hippocampal W score only model (p=0.040) by likelihood ratio test
There is evidence of an interaction between global PiB and hippocampal volume (p=0.009). Interpretation of the interaction model can be simplified by considering four possible scenarios: 1) for subjects with a low hippocampal W score, defined as the 25th percentile, there was strong evidence of increasing odds of a more-impaired diagnosis as PiB retention increases from the 25th to the 75th percentile (OR 23, 95% CI 2.2 to 229). This can be envisioned as moving vertically from the lower left to the upper left quadrant of Figure 6. 2) for subjects with a high hippocampal W score, defined as at the 75th percentile, there is no significant increase in the odds of a more-impaired diagnosis as PiB retention increases from the 25th to the 75th percentile (OR 0.66, 95% CI 0.08 to 5.2). This can be envisioned as moving vertically from the lower right to the upper right quadrant of Figure 6. 3) for subjects with a low PiB retention ratio, defined as the 25th percentile, the odds of a more-impaired diagnosis do not increase significantly for a subject with a hippocampal W score at the 25th percentile vs. one at the 75th percentile (OR 2.8, 95% CI 0.54 to 14). This can be envisioned as moving horizontally from the lower right to the lower left quadrant of Figure 6. 4) for a subject with a high PiB retention ratio, defined as the 75th percentile, the odds of a more-impaired diagnosis increase precipitously as hippocampal W score decreases from the 75th percentile to the 25th percentile (OR 95, 95% CI 6.9 to 1316). This can be envisioned as moving horizontally from the upper right to the upper left quadrant of Figure 6.
Voxel-wise PiB and MRI Analyses
We wished to compare the topographic distribution of PiB uptake and grey matter loss in subjects who occupied opposite poles of the clinical diagnostic continuum (CN and AD) using voxel-wise methods. We performed an SPM analysis of PiB uptake in all AD vs. all CN subjects, corrected for multiple comparisons (false discovery rate, FDR) and thresholded at p < 0.01 (Figure 7). We also performed a VBM analysis of grey matter loss between all AD and all CN subjects, uncorrected for multiple comparisons and thresholded at p < 0.01 (Figure 7). PiB uptake in AD was significantly greater than CN subjects in prefrontal, lateral temporal, lateral parietal, and posterior cingulate/precuneus regions. No significant differences in PiB uptake between AD and CN were found in the primary sensorimotor areas, visual cortex, or anteromedial temporal lobe. In contrast, grey matter loss in AD relative to CN subjects was significant in the lateral temporoparietal cortex, basal temporal, and medial temporal lobe.
Figure 7. AD vs. CN Voxel Mapping. PiB (left).
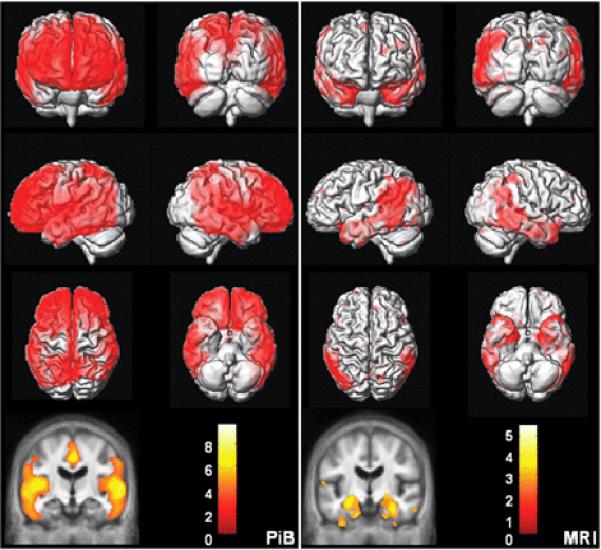
SPM of PiB retention ratio. Corrected for multiple comparisons (FDR) and thresholded at p < 0.01. MRI (right): VBM of MRI grey matter density. Uncorrected for multiple comparisons and thresholded at p < 0.01. The color bar values indicate the value of the T statistic in each display.
In Figure 8, we present a voxel-wise conjunction analysis (Nichols, Brett, Andersson, Wager and Poline, 2005) of PiB cortical-to-cerebellar retention ratio, corrected for multiple comparisons (FDR) and thresholded at p < 0.01. Our objective was to identify those areas in the brain where the topographic distribution of PiB was similar among all subjects who did display PiB retention – i.e., AD, high PiB CN, and high PiB aMCI. We took the PiB distribution in low PiB CN subjects as an appropriate topographic representation of little or no PiB retention. The figure illustrates all voxels where PiB retention in AD > low PiB CN, and high PiB aMCI > low PiB CN, and high PiB CN > low PiB CN. As illustrated in Figure 8, the set of voxels which meet the above criteria are located in the medial and lateral prefrontal, anterior and posterior cingulate/precuneus, and lateral temporal and parietal cortical areas.
Figure 8. PiB Conjunction analysis.
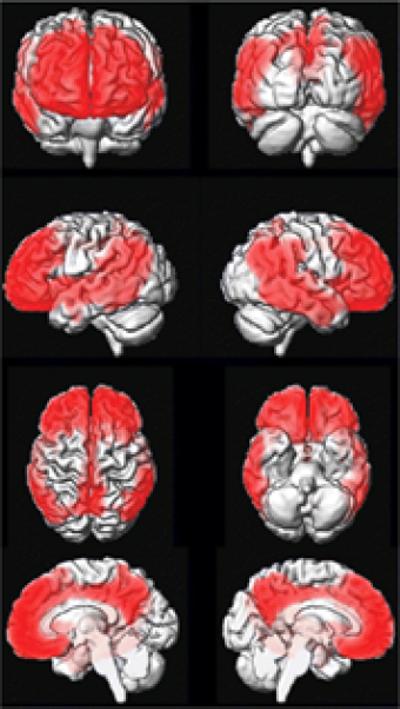
The figure illustrates all voxels where PiB retention in AD > low PiB CN, and high PiB aMCI > low PiB CN, and high PiB CN > low PiB CN. Corrected for multiple comparisons (FDR) and thresholded at p < 0.01.
Discussion
Major conclusions from this study fall into three different categories: group-wise diagnostic separation by PiB and MRI, correlations between imaging and cognitive performance, and conclusions related to the topographic distribution of amyloid deposition and grey matter tissue loss in subjects lying along the cognitive continuum from CN to aMCI to AD. Comparison of the topographic distribution of cerebral grey matter loss and amyloid deposition in subjects with AD vs. CN (Figure 7) reveals both areas of concordance and discordance between the two pathological processes associated with AD. Both grey matter loss and amyloid deposition were observed in the lateral temporal and parietal association cortices. Although the posterior cingulate/precuneus was not significant in our VBM comparison of grey matter loss between AD and CN, we attribute this to the small number of AD subjects in our study because this area has been found to be significant in other VBM studies with larger sample sizes (Baron et al., 2001; Chetelat et al., 2002; Frisoni et al., 2002; Rombouts, Barkhof, Witter and Scheltens, 2000; Senjem, Gunter, Shiung, Petersen and Jack, 2005; Whitwell et al., 2007a; Whitwell et al., 2007b). Neither amyloid deposition nor cerebral grey matter loss was present in the primary visual and sensorimotor cortices. There were also areas of the brain where inter-modality discordance was observed. In the frontal lobes, extensive PiB retention was observed in AD; however, grey matter loss was negligible. In the anteromedial temporal lobe, extensive grey matter loss was seen in AD, whereas PiB retention was negligible.
Comparison of the topographic distribution of findings in PiB and MRI support the notion that different brain regions have intrinsically different susceptibilities to different pathologic expressions of AD. The posterior cingulate/precuneus, and lateral temporoparietal association cortex seem to be susceptible to both plaque deposition and grey matter loss. Primary visual and sensorimotor cortical areas are susceptible to neither. The prefrontal cortex is susceptible to plaque deposition but not to grey matter loss. The medial and basal temporal lobe are highly susceptible to grey matter loss but not to plaque deposition. Similar findings of topographic concordance/discordance have also been observed when FDG-PET measures of regional glucose uptake are compared with PiB (Edison et al., 2007; Engler et al., 2006; Forsberg et al., 2007). Blomquist et al (Blomquist et al., 2005) have shown that PiB binding does not appear to be affected by variation in cerebral perfusion. Moreover, while we found some areas where PiB retention is low and atrophy is present (i.e. medial temporal lobe), we found other areas where both are present (i.e. temporal-partial association cortex). Therefore decreased cerebral blood flow and therefore 11C PiB delivery is an unlikely explanation for low amyloid deposition in areas of atrophy.
One could criticize the fact that we did not correct for multiple comparisons in the MRI VBM analysis (Figure 7), and also the fact that we compared two SPM maps in the same subjects (Figure 7) that were thresholded with different statistical criteria. The counter argument to that criticism is that comparing increases in PiB retention and decreases in grey matter density are not straightforward. The two pathologies (amyloid deposition and grey matter loss) are quite different. Fibrillar amyloid deposits are not present in the cortex of the majority of CN subjects whereas grey matter is present in all subjects. Moreover, while not correcting the VBM analysis for multiple comparisons can be criticized, the fact is that the resulting map comparing grey matter loss between AD and CN matches the known topographic distribution of neurofibrillary pathology and also matches the topographic distribution of grey matter loss in published VBM studies comparing AD vs. CN with larger samples of subjects (Baron et al., 2001; Braak and Braak, 1991; Chetelat et al., 2002; Frisoni et al., 2002; Rombouts, Barkhof, Witter and Scheltens, 2000; Senjem, Gunter, Shiung, Petersen and Jack, 2005; Whitwell et al., 2007a; Whitwell et al., 2007b). Therefore, the VBM map in Figure 7 while not corrected for multiple comparisons does have face validity both in terms of consistency with prior literature and concordance with known biology of AD.
The SPM conjunction analysis in Figure 8 illustrates the common topographic distribution of voxels in subjects with cortical PiB retention (AD, high PiB CN, and high PiB aMCI) compared to the low PiB CN group. The set of voxels which meet the above criteria are located in the medial and lateral prefrontal, anterior and posterior cingulate/precuneus, and lateral temporal and parietal cortical areas. This closely matches the expected distribution of fibrillar amyloid plaques from AD pathological studies and also matches the distribution of PiB retention in AD subjects from published PiB studies (Arnold, Hyman, Flory, Damasio and Van Hoesen, 1991; Braak and Braak, 1991; Edison et al., 2007; Engler et al., 2006; Forsberg et al., 2007; Kemppainen et al., 2006; Klunk et al., 2004; Mintun et al., 2006; Rowe et al., 2007; Thal, Rub, Orantes and Braak, 2002). Figure 8 illustrates a common topographic distribution of PiB retention across subjects of widely varying cognitive status - the high PiB CN group is cognitively normal, the high PiB aMCI group is mildly impaired, and the high PiB AD group is demented. In fact the subject with the highest levels of PiB uptake in our study was a CN subject who was cognitively completely intact (atypical subject A in Figures 3, 5 and 6), and in fact has an AVLT delayed recall score (14) as high as any subject in the study.
One way to explain this apparent dissociation between current cognitive performance and PiB retention in some CN subjects is to propose that amyloid deposition is an early event in the disease process ultimately leading to clinical AD. Others have proposed that high levels of amyloid and hence PiB retention are established in the clinically presymptomatic phase of AD (Engler et al., 2006; Mintun et al., 2006). Based on this proposed sequence of events, the findings illustrated in Figure 8 are logical, with the high PiB retention CN subjects representing individuals with high brain amyloid levels who are in the presymptomatic phase of the disease. Studies of plaque biology (Christie et al., 2001; Hyman, 1993) also suggest that amyloid deposition is an early event that reaches a state of dynamic balance. Once this state of dynamic balance is reached, while individual plaques may appear and disappear, overall plaque burden reaches a plateau. Longitudinal MRI studies have shown that brain atrophy precedes, by at least several years, declining cognitive performance in subjects who later progress to AD (Fox et al., 2001; Fox et al., 1996; Jack et al., 1999; Jack et al., 2005; Kaye, Swihart, Howieson and Dame, 1997; Killiany et al., 2002; Visser et al., 1999). A possible sequence of events that integrates PiB, MRI, and clinical findings is that amyloid deposition is an antecedent event that precedes clinical symptoms by many years. Neuronal pathology appears later and heralds impending cognitive decline. With the appearance of cognitive symptoms, the brain continues to atrophy on MRI while the patient declines clinically, but PiB retention remains relatively constant at a plateau level. In support of this proposed sequence of events, we found that the six high PiB retention and 14 low PiB retention CN subjects were very similar cognitively, the hippocampus on average was slightly, albeit not significantly, more atrophic in the high PiB than the low PiB CN subgroup, and the PiB uptake between subgroups was clearly separable (by definition). This is clearly a hypothesis and it will require longitudinal multi-modality studies for support.
A subtle but important point about the “PiB remains stable once amyloid load is established” hypothesis is that it does not imply that PiB deposition at the present time is not correlated with cognition at the present time. Rather, we believe that high PiB deposition today that has been present for a period of time (arbitrarily say 10 or more years) will likely be associated with impairment today, whereas high PiB deposition that has only been in place a short time will not be associated with dementia today. Our hypothesis is that amyloid deposition (i.e. high PiB retention) alone is not sufficient to cause dementia in many (most?) elderly subjects. Additional pathological event(s) must take place once PiB is deposited before cognitive impairment is seen. One of these events is neuronal damage which can be detected as gray matter loss by MRI. This is consistent with the idea that amyloid deposition is an antecedent event - i.e., it occurs before cognitive changes are evident. Our results and hence conclusions differ from those recently published by Pike et al. (Pike et al., 2007) who found poorer performance on memory tests in high PiB vs. low PiB controls. In contrast, we found no consistent differences in detailed learning and memory performance between high and low PiB CN subjects. How often subjects may have significant amyloid deposition and still be cognitively intact is of great interest and will undoubtedly be the focus of future studies.
Correlations between imaging and functional performance across all subjects follow expected patterns with high PiB retention and greater hippocampal atrophy (i.e., more negative hippocampal W scores) associated with worse cognitive and functional performance (Table 3). In our sample, the magnitudes of the correlations between cognitive performance and hippocampal W score were greater than those seen between global PiB retention and cognitive performance. Investigators who have evaluated PiB and FDG-PET in the same subjects have observed a similar phenomenon, with FDG-PET generally showing better correlation with current cognitive performance than PiB, with the presumption that FDG-PET, like MRI, is closely linked to neuronal health (Edison et al., 2007; Engler et al., 2006). Because PiB deposition is bi-modal within the CN and aMCI groups, correlations between cognition and PiB are to a great extent simply a reflection of the proportions within each clinical group who are PiB positive vs. PiB negative.
About half of the aMCI subjects in this study fall into the high PiB uptake range (global cortical-to-cerebellar retention ratio > 1.5), and half fall into the low PiB retention range. While the proportion of PiB negative aMCI subjects in our study may be higher than seen in other studies, perhaps due to the older ages in our study, observing PiB negative aMCI subjects is consistent with results from other studies (Lopresti et al., 2005; Pike et al., 2007; Price et al., 2005; Rowe et al., 2007). Interestingly, as with our CN subjects, no consistent differences in cognitive performance including learning and memory were seen between high vs. low PiB aMCI subjects. The upper left and lower right quadrants in Figure 6 represent concordant PiB and MRI findings (i.e., high PiB and low hippocampal W score, or vice versa), while the lower left and upper right panels represent subjects with discordant PiB and MRI findings. Of the 17 aMCI subjects in the study, PiB and MRI were discordant in seven. Five of these seven had low PiB retention and hippocampal W scores less than 0. A hypothesis is that low PiB retention aMCI subjects who also have atrophic hippocampi have prodromal dementias other than AD, and at autopsy will be found to have pathologic substrates for their cognitive impairment other than AD for example hippocampal sclerosis, cerebro-vascular disease or non-AD neurodegenerative conditions. Conversely, we suspect that aMCI subjects who lie in the high PiB retention range have prodromal AD which will be confirmed at autopsy. However, this is purely a hypothesis and longitudinal studies to autopsy are required to confirm or refute this. The implication of our findings for the concept of aMCI is that this syndrome represents prodromal AD in some but not all those affected. This result is completely consistent with the original formulation of the construct of aMCI as a risk factor for AD, not a diagnosis of early AD (Petersen, 1995; Petersen et al., 1995). Although one can reasonably infer that PiB positive aMCI subjects have prodromal AD and will progress to clinical AD with time, the same is not true of PiB negative aMCI subjects. PiB negative aMCI subjects therefore constitute a very interesting group and longitudinal follow up is necessary in order to determine the outcome of these subjects.
The numbers of subjects in this study are too small to pursue a rigorous evaluation of diagnostic, sensitivity, and specificity. Nonetheless, it is clear that overall the ability to separate aMCI from AD, and CN from AD is not dramatically different between standard hippocampal volume measures and global cortical measures of PiB retention. Pair-wise inter-group discrimination was significant for all measures except for control vs. aMCI with PiB (p=0.17). This is not surprising given the distribution of PiB retention values in the CN and aMCI subjects in Figure 3 which illustrates that while sample medians were found to differ, high and low PiB retention subjects exist in both the CN and aMCI clinical groups.
Table 5 illustrates that across all three clinical groups, diagnostic inter-group separation appears to be slightly better by MRI than PiB. These results on inter-group diagnostic separation as well as correlation of imaging with functional measures present an apparent paradox given the fact that PiB retention is a direct measure of a pathologic process that is central to AD, whereas MRI is an indirect measure of synapse and neuron loss which is not specific for AD. A way to resolve this apparent paradox is to consider the likely timing of events in the pathogenesis of AD. As outlined above, if PiB deposition plateaus prior to the first appearance of clinical symptoms, whereas MRI becomes abnormal shortly before the appearance of clinical symptoms and then declines in parallel with clinical decline, then it is not surprising that MRI measures seem to correlate slightly better with current clinical diagnostic status than PiB retention measures. From the initial report, it has been pointed out that PiB is a tool to detect brain β-amyloidosis, not dementia per se (Klunk et al., 2004). The potential clinical use of PiB is not likely to be the separation of cognitively normal controls from MCI or AD patients. Amyloid imaging will more likely be used in the context of ruling in or ruling out AD from the differential diagnosis of a subject with a clinical dementia that does not fall easily into any one diagnostic category.
The evidence presented in this paper implies that the diagnostic information contained in PiB and that contained in structural MRI is complementary in predicting clinical group membership. While hippocampal volumes may be a slightly stronger predictor of group membership, PiB adds independent diagnostic information to hippocampal volumes and hippocampal volumes add independent predictive information to PiB. This complimentary relationship as quantified in the interaction POLR model suggests a natural interpretation: smaller hippocampal volumes and higher PiB retention are much riskier for more-impaired clinical diagnosis than either of these traits alone. This is also supported graphically in Figure 6 which shows that all demented subjects have both elevated global PiB retention and reduced hippocampal W scores. The interaction model also provides some evidence that the absence of hippocampal atrophy is somewhat protective, regardless of the subject's PiB levels.
Emerging evidence from longitudinal clinical studies with autopsy endpoints supports the notion that cognitive performance in life depends on the sum of various pathologic insults to the brain which increase in prevalence with age. Cognitive performance is not completely explained by pathologic assessments of the burden of any single pathology, but rather by the overall multi-factorial pathology burden in each individual (Green, Kaye and Ball, 2000; Snowdon et al., 1997; Troncoso, Martin, Del Forno and Kawas, 1996; White et al., 2005). Results presented in this study support this notion. The fact that structural MRI measures of hippocampal neuronal damage and PiB PET measures of amyloid burden better discriminate among, and are more predictive of, clinical groups than either measure alone support the idea that both of these pathologic insults, which can be detected in vivo by imaging, contribute to the observed cognitive performance levels in individual subjects. This concept can be extended to include other imaging modalities, each capable of providing an in vivo window into a specific type of pathologic disturbance affecting individuals along the CN to aMCI to AD continuum.
The complementary nature of different imaging modalities can be further extended to the area of predicting future cognitive course in individual subjects. It may be that the ability of one imaging modality to predict future cognitive course will be superior at one point in the disease while a different modality will be superior at a different point in the disease. For example, current expectation is that PiB is an accurate marker of fibrillar amyloid in the brain and that a positive PiB study in a clinically asymptomatic subject indicates a high likelihood that the subject will develop clinical AD if he/she lives long enough. Conversely, MRI might be a better predictor of future cognitive course once a subject has reached a plateau of fibrillar amyloid deposition. These are clearly hypotheses however and the studies required to test these hypotheses remain to be done.
The notion that that MRI and PiB provide complementary information extends to the SPM/VBM analyses – where clear and meaningful differences in topographic distribution exist between the two modalities. These imaging findings have significant implications for formulation of mechanistic theories in AD. These results imply that the full expression of AD pathology in humans is not fully captured by a single pathway that is applicable throughout the brain, typically beginning with disordered amyloid metabolism or clearance and leading to plaque formation and neuronal damage. Rather, the expression of different aspects of AD pathology varies topographically and a unifying theory of cause and effect at the molecular level must accommodate this topographic variation.
Supplementary Material
Acknowledgements
The authors thank Denise Reyes, Peter O'Brien, Ph.D., Scott Przybelski, Jennifer Whitwell, Ph.D., and Kejal Kantarci, M.D. for assistance with data and manuscript preparation.
Funding National Institute on Aging [P50 AG16574, U01 AG06786, C06 RR018898, and R01 AG11378]; the Robert H. and Clarice Smith and Abigail Van Buren Alzheimer s Disease Research Program; and the Alexander Family Alzheimer's Disease Research Professorship of the Mayo Foundation, U.S.A.
Abbreviations
- AD
Alzheimer's disease
- aMCI
amnestic mild cognitive impairment
- AVLT
Auditory Verbal Learning test
- CDR-SB
Clinical Dementia Rating scale – sum of boxes
- CN
cognitively normal
- MMSE
Mini Mental State Exam
- PiB
11C Pittsburgh Compound
- ROI
region of interest
- SPM
statistical parametric mapping
- STMS
Short Test of Mental Status
- TPM
tissue probability maps
- VBM
voxel-based morphometry
- WMS-R
Wechsler Memory Scale-Revised
References
- Diagnostic and statistical manual of mental disorders, DSM-IV. American Psychiatric Association; Washington, D.C.: 1994. [Google Scholar]
- Archer H, Edison P, Brooks DJ, Barnes J, Frost C, Yeatman T, et al. Amyloid load and cerebral atrophy in Alzheimer's disease: an 11C-PIB positron emission tomography study. Annals of Neurology. 2006;60:145–7. doi: 10.1002/ana.20889. [DOI] [PubMed] [Google Scholar]
- Arnold SE, Hyman BT, Flory J, Damasio AR, Van Hoesen GW. The topographical and neuroanatomical distribution of neurofibrillary tangles and neuritic plaques in the cerebral cortex of patients with Alzheimer's disease. Cereb Cortex. 1991;1:103–16. doi: 10.1093/cercor/1.1.103. [DOI] [PubMed] [Google Scholar]
- Ashburner J, Friston KJ. Voxel-based morphometry--the methods. NeuroImage. 2000;11:805–821. doi: 10.1006/nimg.2000.0582. [DOI] [PubMed] [Google Scholar]
- Ashburner J, Friston KJ. Unified segmentation. Neuroimage. 2005;26:839–51. doi: 10.1016/j.neuroimage.2005.02.018. [DOI] [PubMed] [Google Scholar]
- Bacskai BJ, Frosch MP, Freeman SH, Raymond SB, Augustinack JC, Johnson KA, et al. Molecular Imaging With Pittsburgh Compound B Confirmed at Autopsy: A Case Report. Arch Neurol %R 10.1001/archneur.64.3.431. 2007;64:431–434. doi: 10.1001/archneur.64.3.431. [DOI] [PubMed] [Google Scholar]
- Baron JC, Chetelat G, Desgranges B, Perchey G, Landeau B, de la Sayette V, et al. In vivo mapping of gray matter loss with voxel-based morphometry in mild Alzheimer's disease. NeuroImage. 2001;14:298–309. doi: 10.1006/nimg.2001.0848. [DOI] [PubMed] [Google Scholar]
- Blomquist G, Ringheim A, Extrada S, Hoglund U, Frandberg P, Nylen G. Influx and net accumulation of PIB compared with CBF in a rhesus monkey. EJNM. 2005;32:S263. [Google Scholar]
- Bobinski M, de Leon MJ, Wegiel J, Desanti S, Convit A, Saint Louis LA, et al. The histological validation of post mortem magnetic resonance imaging-determined hippocampal volume in Alzheimer's disease. Neuroscience. 2000;95:721–5. doi: 10.1016/s0306-4522(99)00476-5. [DOI] [PubMed] [Google Scholar]
- Braak H, Braak E. Neuropathological staging of Alzheimer-related changes. Acta Neuropathol. 1991;82:239–259. doi: 10.1007/BF00308809. [DOI] [PubMed] [Google Scholar]
- Buckner RL, Snyder AZ, Shannon BJ, LaRossa G, Sachs R, Fotenos AF, et al. Molecular, structural, and functional characterization of Alzheimer's disease: evidence for a relationship between default activity, amyloid, and memory. The Journal of Neuroscience. 2005;25:7709–7717. doi: 10.1523/JNEUROSCI.2177-05.2005. [DOI] [PMC free article] [PubMed] [Google Scholar]
- Chetelat G, Desgranges B, de la Sayette V, Viader F, Eustache F, Baron C-J. Mapping gray matter loss with voxel-based morphometry in mild cognitive impairment. Brain Imaging. 2002;13:1939. doi: 10.1097/00001756-200210280-00022. [DOI] [PubMed] [Google Scholar]
- Christie RH, Bacskai BJ, Zipfel WR, Williams RM, Kajdasz ST, Webb WW, et al. Growth arrest of individual senile plques in a model of Alzheimer's disease observed by In Vivo Multiphoton Microscopy. The Journal of Neuroscience. 2001;21:858–864. doi: 10.1523/JNEUROSCI.21-03-00858.2001. [DOI] [PMC free article] [PubMed] [Google Scholar]
- Crystal H, Dickson D, Sliwinski M, Lipton R, Grober E, Marks-Nelson H, et al. Pathological markers associated with normal aging and dementia in the elderly. Annals of Neurology. 1993;34:566–573. doi: 10.1002/ana.410340410. [DOI] [PubMed] [Google Scholar]
- Csernansky JG, Hamstra J, Wang L, McKeel D, Price JL, Gado MH, et al. Correlations between antemortem hippocampal volume and postmortem neuropathology in AD subject. Alzheimer Dis Assoc Disord. 2004;18:190–195. [PubMed] [Google Scholar]
- de Leon MJ, George AE, Stylopoulos LA, Smith G, Miller DC. Early marker for Alzheimer's disease: the atrophic hippocampus. Lancet. 1989;2:672–3. doi: 10.1016/s0140-6736(89)90911-2. [DOI] [PubMed] [Google Scholar]
- Edison P, Archer HA, Hinz R, Hammers A, Pavese N, Tai YF, et al. Amyloid, hypometabolism, and cognition in Alzheimer disease: An [11C]PIB and [18F]FDG PET study. Neurology %R 10.1212/01.wnl.0000244749.20056.d4. 2007;68:501–508. doi: 10.1212/01.wnl.0000244749.20056.d4. [DOI] [PubMed] [Google Scholar]
- Engler H, Forsberg A, Almkvist O, Blomquist G, Larsson E, Savitcheva I, et al. Two-year follow-up of amyloid deposition in patients with Alzheimer's disease. Brain %R 10.1093/brain/awl178. 2006;129:2856–2866. doi: 10.1093/brain/awl178. [DOI] [PubMed] [Google Scholar]
- Fagan AM, Mintun MA, Mach RH, Lee SY, Dence CS, Shah AR, et al. Inverse relation between in vivo amyloid imaging load and cerebrospinal fluid Abeta42 in humans. Ann Neurol. 2006;59:512–9. doi: 10.1002/ana.20730. [DOI] [PubMed] [Google Scholar]
- Folstein MF, Folstein SE, McHugh PR. “Mini Mental State”: A practical method for grading the cognitive state of patients for the clinician. Journal of Psychiatric Research. 1975;12:189–198. doi: 10.1016/0022-3956(75)90026-6. [DOI] [PubMed] [Google Scholar]
- Forsberg A, Engler H, Almkvist O, Blomquist G, Hagman G, Wall A, et al. PET imaging of amyloid deposition in patients with mild cognitive impairment. Neurobiol Aging. 2007 doi: 10.1016/j.neurobiolaging.2007.03.029. [DOI] [PubMed] [Google Scholar]
- Fox NC, Crum WR, Scahill RI, Stevens JM, Janssen JC, Rossor MN. Imaging of onset and progression of Alzheimer's disease with voxel-compression mapping of serial magnetic resonance images. Lancet. 2001;358:201–205. doi: 10.1016/S0140-6736(01)05408-3. [DOI] [PubMed] [Google Scholar]
- Fox NC, Warrington EK, Freeborough PA, Hartikainen P, Kennedy AM, Stevens JM, et al. Presymptomatic hippocampal atrophy in Alzheimer's disease. A longitudinal MRI study. Brain. 1996;119(Pt 6):2001–7. doi: 10.1093/brain/119.6.2001. [DOI] [PubMed] [Google Scholar]
- Frisoni GB, Testa C, Zorzan A, Sabattoli F, Beltramello A, Soininen H, et al. Detection of grey matter loss in mild Alzheimer's disease with voxel based morphometry. J Neurol Neurosurg Psychiatry. 2002;73:657–64. doi: 10.1136/jnnp.73.6.657. [DOI] [PMC free article] [PubMed] [Google Scholar]
- Genovese CR, Lazar NA, Nichols TE. Thresholding of Statistical Maps in Functional Neuroimaging Using the False Discovery Rate. Neuroimage. 2002;15:772–786. doi: 10.1006/nimg.2001.1037. [DOI] [PubMed] [Google Scholar]
- Gosche KM, Mortimer JA, Smith CD, Markesbery WR, Snowdon DA. Hippocampal volume as an index of Alzheimer neuropathology: Findings from the Nun Study. Neurology. 2002;58:1476–1482. doi: 10.1212/wnl.58.10.1476. [DOI] [PubMed] [Google Scholar]
- Green M, Kaye JA, Ball MJ. The Oregon Brain Aging Study. Neurology. 2000;54:105–113. doi: 10.1212/wnl.54.1.105. [DOI] [PubMed] [Google Scholar]
- Harrell FE. Regression modeling strategies: with applications to linear models, logistic regression, and survival analysis. Vol. 568. Springer-Verlag; New York: 2001. [Google Scholar]
- Hulette CM, Welsh-Bohmer KA. Neuropathological and neuropsychological changes in “normal” aging: evidence for preclinical Alzheimer disease in cognitively normal individuals. J Neuropathol Exp Neurol. 1998;57:1168–1174. doi: 10.1097/00005072-199812000-00009. [DOI] [PubMed] [Google Scholar]
- Hyman B, Marzloff K, Arriagada PV. The lack of accumulation of senile plaques or amyloid burden in Alzheimer's disease suggests a dynamic balance between amyloid deposition and resolution. J Neuropathol and Exp Neurology. 1993;52:594–600. doi: 10.1097/00005072-199311000-00006. [DOI] [PubMed] [Google Scholar]
- Jack CR, Jr., Bernstein MA, Fox NC, Thompson P, Alexander GE, Harvey D, et al. The Alzheimer's Disease Neuroimaging Initiative (ADNI): MRI Methods. JMRI. 2007 doi: 10.1002/jmri.21049. In Press. [DOI] [PMC free article] [PubMed] [Google Scholar]
- Jack CR, Jr., Dickson DW, Parisi JE, Xu YC, Cha RH, O'Brien PC, et al. Antemortem MRI findings correlate with hippocampal neuropathology in typical aging and dementia. Neurology. 2002;58:750–7. doi: 10.1212/wnl.58.5.750. [DOI] [PMC free article] [PubMed] [Google Scholar]
- Jack CR, Jr., Petersen RC, O'Brien PC, Tangalos EG. MR-based hippocampal volumetry in the diagnosis of Alzheimer's disease. Neurology. 1992;42:183–8. doi: 10.1212/wnl.42.1.183. [DOI] [PubMed] [Google Scholar]
- Jack CR, Jr., Petersen RC, Xu Y, O'Brien PC, Smith GE, Ivnik RJ, et al. Prediction of AD with MRI-based hippocampal volume in mild cognitive impairment. Neurology. 1999;52:1397–1403. doi: 10.1212/wnl.52.7.1397. [DOI] [PMC free article] [PubMed] [Google Scholar]
- Jack CR, Jr., Petersen RC, Xu Y, O'Brien PC, Smith GE, Ivnik RJ, et al. The rate of medial temporal lobe atrophy in typical aging and Alzheimer's disease. Neurology. 1998;51:993–999. doi: 10.1212/wnl.51.4.993. [DOI] [PMC free article] [PubMed] [Google Scholar]
- Jack CR, Jr., Petersen RC, Xu YC, Waring SC, O'Brien PC, Tangalos EG, et al. Medial temporal atrophy on MRI in normal aging and very mild Alzheimer's disease. Neurology. 1997;49:786–794. doi: 10.1212/wnl.49.3.786. [DOI] [PMC free article] [PubMed] [Google Scholar]
- Jack CR, Jr., Shiung MM, Weignad SD, O'Brien PC, Gunter JL, Boever BF, et al. Brain atrophy rates predict subsequent clinical conversion in normal elderly and amnestic MCI. Neurology. 2005;65:1227–1231. doi: 10.1212/01.wnl.0000180958.22678.91. [DOI] [PMC free article] [PubMed] [Google Scholar]
- Jack CR, Jr., Twomey CK, Zinsmeister AR, Sharbrough FW, Petersen RC, Cascino GD. Anterior temporal lobes and hippocampal formations: normative volumetric measurements for MR images in young adults. Radiology. 1989;172:549–554. doi: 10.1148/radiology.172.2.2748838. [DOI] [PubMed] [Google Scholar]
- Katzman R, Terry R, DeTeresa R, Brown T, Davies P, Fuld P, et al. Clinical, pathological, and neurochemical changes in dementia: a subgroup with preserved mental status and numerous neocortical plaques. Ann Neurol. 1988;23:138–44. doi: 10.1002/ana.410230206. [DOI] [PubMed] [Google Scholar]
- Kaye JA, Swihart T, Howieson D, Dame A. Volume loss of the hippocampus and temporal lobe in healthy elderly persons destined to develop dementia. Neurology. 1997;48:1297–1304. doi: 10.1212/wnl.48.5.1297. [DOI] [PubMed] [Google Scholar]
- Kemppainen NM, Aalto S, Wilson IA, Nagren K, Helin S, Bruck A, et al. Voxel-based analysis of PET amyloid ligand [11C]PIB uptake in Alzheimer disease. Neurology %R 10.1212/01.wnl.0000240117.55680.0a. 2006;67:1575–1580. doi: 10.1212/01.wnl.0000240117.55680.0a. [DOI] [PubMed] [Google Scholar]
- Kemppainen NM, Aalto S, Wilson IA, Nagren K, Helin S, Bruck A, et al. PET amyloid ligand [11C]PIB uptake is increased in mild cognitive impairment. Neurology %R 10.1212/01.wnl.0000260969.94695.56. 2007;68:1603–1606. doi: 10.1212/01.wnl.0000260969.94695.56. [DOI] [PubMed] [Google Scholar]
- Killiany RJ, Hyman BT, Gomez-Isla T, Moss MB, Kikinis R, Jolesz F, et al. MRI measures of entorhinal cortex vs hippocampus in preclinical AD. Neurology. 2002;58:1188–96. doi: 10.1212/wnl.58.8.1188. [DOI] [PubMed] [Google Scholar]
- Killiany RJ, Moss MB, Albert MS, Sandor T, Tieman J, Jolesz F. Temporal lobe regions on magnetic resonance imaging identify patients with early Alzheimer's disease. Arch Neurol. 1993;50:949–54. doi: 10.1001/archneur.1993.00540090052010. [DOI] [PubMed] [Google Scholar]
- Klunk WE, Engler H, Nordberg A, Wang Y, Blomqvist G, Holt DP, et al. Imaging brain amyloid in Alzheimer's disease with Pittsburgh Compound-B. Ann Neurol. 2004;55:306–19. doi: 10.1002/ana.20009. [DOI] [PubMed] [Google Scholar]
- Knopman DS, Parisi JE, Salviati A. Neuropathology of cognitively normal elderly. J Neuropathol Exp Neurol. 2003;62:1087–1095. doi: 10.1093/jnen/62.11.1087. [DOI] [PubMed] [Google Scholar]
- Kokmen E, Smith GE, Petersen RC, Tangalos E, Ivnik RC. The short test of mental status. Correlations with standardized psychometric testing. Arch Neurol. 1991;48:725–8. doi: 10.1001/archneur.1991.00530190071018. [DOI] [PubMed] [Google Scholar]
- Laakso MP, Soininen H, Partanen K, Lehtovirta M, Hallikainen M, Hanninen T, et al. MRI of the hippocampus in Alzheimer's disease: sensitivity, specificity, and analysis of the incorrectly classified subjects. Neurobiol Aging. 1998;19:23–31. doi: 10.1016/s0197-4580(98)00006-2. [DOI] [PubMed] [Google Scholar]
- Lopresti BJ, Klunk WE, CMathis CA, Hoge JA, Ziolko SK, Lu X, et al. Simplified quantification of Pittsburgh compound B amyloid imaging PET studies: a comparative analysis. J Nucl Med. 2005;46:1959–1972. [PubMed] [Google Scholar]
- Mathis CA, Wang Y, Holt DP, Huang GF, Debnath ML, Klunk WE. Synthesis and evaluation of 11C-labeled 6-substituted 2-arylbenzothiazoles as amyloid imaging agents. J Med Chem. 2003;46:2740–54. doi: 10.1021/jm030026b. [DOI] [PubMed] [Google Scholar]
- McCullagh P. Regression Models for Ordinal Data. (Series B (Methodological)).Journal of the Royal Statistical Society. 1980;42:109–142. [Google Scholar]
- McKhann G, Drachman D, Folstein M, Katzman R, Price D, Stadlan EM. Clinical diagnosis of Alzheimer's disease: report of the NINCDS-ADRDA work group under the auspices of Department of Health and Human Services Task Force on Alzheimer's disease. Neurology. 1984;34:939–944. doi: 10.1212/wnl.34.7.939. [DOI] [PubMed] [Google Scholar]
- Meltzer CC, Kinahan PE, Greer PJ, Nichols TE, Comtat C, Cantwell MN, et al. Comparative evaluation of MR-based partial-volume correction schemes for PET. J Nucl Med. 1999;40:2053–65. [PubMed] [Google Scholar]
- Mintun MA, LaRossa GN, Sheline YI, Dence CS, Lee SY, Mach RH, et al. [11C]PIB in a nondemented population: Potential antecedent marker of Alzheimer disease. Neurology %R 10.1212/01.wnl.0000228230.26044.a4. 2006;67:446–452. doi: 10.1212/01.wnl.0000228230.26044.a4. [DOI] [PubMed] [Google Scholar]
- Morris J, Price J. Pathologic Correlates of Nondemented Aging, Mild Cognitive Impairment, and Early-Stage Alzheimer's Disease. Journal of Molecular Neuroscience. 2001;17:101–118. doi: 10.1385/jmn:17:2:101. [DOI] [PubMed] [Google Scholar]
- Morris JC. The Clinical Dementia Rating (CDR): current version and scoring rules. Neurology. 1993;43:2412–2414. doi: 10.1212/wnl.43.11.2412-a. [DOI] [PubMed] [Google Scholar]
- Nichols TE, Brett M, Andersson JLR, Wager T, Poline J-B. Valid conjunction inference with the minimum statistic. NeuroImage. 2005;25:653–660. doi: 10.1016/j.neuroimage.2004.12.005. [DOI] [PubMed] [Google Scholar]
- O'Brien PC, Dyck PJ. Procedures for setting normal values. Neurology. 1995;45:17–23. doi: 10.1212/wnl.45.1.17. [DOI] [PubMed] [Google Scholar]
- Petersen RC. Normal aging, mild cognitive impairment, and early Alzheimer's disease. The Neurologist. 1995;1:326–344. [Google Scholar]
- Petersen RC, Doody R, Kurz A, Mohs RC, Morris JC, Rabins PV, et al. Current concepts in mild cognitive impairment. Archives of Neurology. 2001;58:1985–92. doi: 10.1001/archneur.58.12.1985. [DOI] [PubMed] [Google Scholar]
- Petersen RC, Kokmen E, Tangalos E, Ivnik RJ, Kurland LT. Mayo Clinic Alzheimer's Disease Patient Registry. Aging (Milano) 1990;2:408–15. doi: 10.1007/BF03323961. [DOI] [PubMed] [Google Scholar]
- Petersen RC, Smith GE, Ivnik RJ, Tangalos EG, Schaid DJ, Thibodeau SN, et al. Apolipoprotein E status as a predictor of the development of Alzheimer's disease in memory-impaired individuals. Jama. 1995;273:1274–8. [PubMed] [Google Scholar]
- Pike KE, Savage G, Villemagne VL, Ng S, Moss SA, Maruff P, et al. Beta-amyloid imaging and memory in non-demented individuals: evidence for preclinical Alzheimer's disease. Brain. 2007;130:2837–44. doi: 10.1093/brain/awm238. [DOI] [PubMed] [Google Scholar]
- Price JC, Klunk WE, Lopresti BJ, Lu X, Hoge JA, Ziolko SK, et al. Kinetic modeling of amyloid binding in humans using PET imaging and Pittsburgh Compound-B. J Cereb Blood Flow Metab. 2005;25:1528–47. doi: 10.1038/sj.jcbfm.9600146. [DOI] [PubMed] [Google Scholar]
- Price JL, Morris JC. Tangles and plaques in nondemented aging and “preclinical” Alzheimer's disease. Ann Neurol. 1999;45:358–368. doi: 10.1002/1531-8249(199903)45:3<358::aid-ana12>3.0.co;2-x. [DOI] [PubMed] [Google Scholar]
- Rabinovici GD, Furst AJ, O'Neil JP, Racine CA, Mormino EC, Baker SL, et al. 11C-PIB PET imaging in Alzheimer disease and frontotemporal lobar degeneration. Neurology %R 10.1212/01.wnl.0000259035.98480.ed. 2007;68:1205–1212. doi: 10.1212/01.wnl.0000259035.98480.ed. [DOI] [PubMed] [Google Scholar]
- Rey A. L'examen Clinique en Psychologie. Presses Universitaires de Frances; Paris: 1964. p. 221. [Google Scholar]
- Riley KP, Snowdon DA, Markesbery WR. Alzheimer's neurofibrillary pathology and the spectrum of cognitive function: findigns from the Nun Study. Ann Neurol. 2002;51:567–577. doi: 10.1002/ana.10161. [DOI] [PubMed] [Google Scholar]
- Rombouts SA, Barkhof F, Witter MP, Scheltens P. Unbiased whole-brain analysis of gray matter loss in Alzheimer's disease. Neuroscience Letters. 2000;285:231–233. doi: 10.1016/s0304-3940(00)01067-3. [DOI] [PubMed] [Google Scholar]
- Rowe CC, Ng S, Ackermann U, Gong SJ, Pike K, Savage G, et al. Imaging {beta}-amyloid burden in aging and dementia. Neurology %R 10.1212/01.wnl.0000261919.22630.ea. 2007;68:1718–1725. doi: 10.1212/01.wnl.0000261919.22630.ea. [DOI] [PubMed] [Google Scholar]
- Schmitt FA, Davis DG, Wekstein D. “Preclinical” AD revisted: neuropathology of cognitively normal older adults. Neurology. 2000;55:370–376. doi: 10.1212/wnl.55.3.370. [DOI] [PubMed] [Google Scholar]
- Senjem ML, Gunter JL, Shiung MM, Petersen RC, Jack CR., Jr. Comparison of different methodological implementations of voxel-based morphometry in neurodegenerative disease. NeuroImage. 2005;26:600–608. doi: 10.1016/j.neuroimage.2005.02.005. [DOI] [PMC free article] [PubMed] [Google Scholar]
- Silbert LC, Quinn JF, Moore MM, Corbridge E, Ball MJ, Murdoch G, et al. Changes in premorbid brain volume predict Alzheimer's disease pathology. Neurology. 2003;61:487–492. doi: 10.1212/01.wnl.0000079053.77227.14. [DOI] [PubMed] [Google Scholar]
- Small GW, Kepe V, Ercoli LM, Siddarth P, Bookheimer SY, Miller KJ, et al. PET of brain amyloid and Tau in mild cognitive impairment. N Engl J Med. 2006;355:2652–63. doi: 10.1056/NEJMoa054625. [DOI] [PubMed] [Google Scholar]
- Snowdon DA, Greiner LH, Mortimer JA, Riley KP, Greiner PA, Markesbery WR. Brain infarction and the clinical expression of Alzheimer disease. The Nun Study. Jama. 1997;277:813–7. [PubMed] [Google Scholar]
- Sun FT, Schriber RA, Greenia JM, He J, Gitcho A, Jagust WJ. Automated templeate-based PET region of interest analyses in the aging brain. NeuroImage. 2007;34:608–617. doi: 10.1016/j.neuroimage.2006.09.022. [DOI] [PMC free article] [PubMed] [Google Scholar]
- Tang-Wai DF, Knopman DS, Geda YE, Edland SD, Smith GE, Ivnik RJ, et al. Comparison of the short test of mental status and the mini-mental state examination in mild cognitive impairment. Arch Neurol. 2003;60:1777–81. doi: 10.1001/archneur.60.12.1777. [DOI] [PubMed] [Google Scholar]
- Terry RD, Masliah E, Salmon DP, Butters N, DeTeresa R, Hill R, et al. Physical basis of cognitive alterations in Alzheimer's disease: synapse loss is the major correlate of cognitive impairment. Ann Neurol. 1991;30:572–80. doi: 10.1002/ana.410300410. [DOI] [PubMed] [Google Scholar]
- Thal DR, Rub U, Orantes M, Braak H. Phases of A beta-deposition in the human brain and its relevance for the development of AD. Neurology. 2002;58:1791–800. doi: 10.1212/wnl.58.12.1791. [DOI] [PubMed] [Google Scholar]
- Troncoso JC, Martin LJ, Del Forno G, Kawas CH. Neuropathology in controls and demented subjects from the Baltimore Longitudinal Study of Aging. Neurobiol Aging. 1996;17:365–371. doi: 10.1016/0197-4580(96)00028-0. [DOI] [PubMed] [Google Scholar]
- Tzourio-Mazoyer N, Landeau B, Papathanassiou D, Crivello F, Etard O, Delcroix N, et al. Automated anatomical labeling of activations in SPM using a macroscopic anatomical parcellation of the MNI MRI single-subject brain. NeuroImage. 2002;15:273–89. doi: 10.1006/nimg.2001.0978. [DOI] [PubMed] [Google Scholar]
- Verhoeff NP, Wilson AA, Takeshita S, Trop L, Hussey D, Singh K, et al. In-vivo imaging of Alzheimer disease beta-amyloid with (11C)SB-13 PET. American Journal of Geriatric Psychiatry. 2004;12:584–95. doi: 10.1176/appi.ajgp.12.6.584. [DOI] [PubMed] [Google Scholar]
- Visser PJ, Scheltens P, Verhey FRJ, Schmand B, Launer LJ, Jolles J, et al. Medial temporal lobe atrophy and memory dysfunction as predictors for dementia in subjects with mild cognitive impairment. J Neurology. 1999;246:477–485. doi: 10.1007/s004150050387. [DOI] [PubMed] [Google Scholar]
- Wechsler D. Wechsler Memory Scale-Revised. Psychological Corp; Harcourt Brace Janvanovich, Inc.; New York, NY: 1987. [Google Scholar]
- White L, Small BJ, Petrovitch H, Ross GW, Masaki K, Abbott RD, et al. Recent clinical-pathologic research on the causes of dementia in late life: update from the Honolulu-Asia Aging Study. Journal of Geriatric Psychiatry & Neurology. 2005;18:224–227. doi: 10.1177/0891988705281872. [DOI] [PubMed] [Google Scholar]
- Whitwell JL, Shiung MM, Przybelski SA, Weigand SD, Knopman DS, Boeve BF, et al. MRI patterns of atrophy associated with progression to AD in amnestic mild cognitive impairment. Neurology. 2007a doi: 10.1212/01.wnl.0000280575.77437.a2. [DOI] [PMC free article] [PubMed] [Google Scholar]
- Whitwell JL, Weigand SD, Shiung MM, Boeve BF, Ferman TJ, Smith GE, et al. Focal atrophy in dementia with Lewy bodies on MRI: a distinct pattern from Alzheimer's disease. Brain %R 10.1093/brain/awl388. 2007b;130:708–719. doi: 10.1093/brain/awl388. [DOI] [PMC free article] [PubMed] [Google Scholar]
- Zarow C, Vinters HV, Ellis WG, Weiner MW, Mungas D, White L, et al. Correlates of hippocampal neuron number in Alzheimer's disease and ischemic vascular dementia. Ann Neurol. 2005;57:896–903. doi: 10.1002/ana.20503. [DOI] [PMC free article] [PubMed] [Google Scholar]
Associated Data
This section collects any data citations, data availability statements, or supplementary materials included in this article.