

Abstract
Objectives
To correlate different methods of measuring rates of brain atrophy from serial MRI with corresponding clinical change in normal elderly subjects, patients with mild cognitive impairment (MCI), and probable Alzheimer's disease (AD).
Methods
One-hundred sixty subjects were recruited from the Mayo Clinic AD Research Center and AD Patient Registry studies. At baseline 55 subjects were cognitively normal, 41 met criteria for MCI, and 64 met criteria for AD. Each subject went under an MRI examination of the brain at the time of the baseline clinical assessment and then again at the time of a follow-up clinical assessment, 1–5 years later. The annualized changes in volume of four structures were measured from the serial MRI studies – hippocampus, entorhinal cortex, whole brain, and ventricle. Rates of change on several cognitive tests/rating scales were also assessed. Subjects who were classified as normal or MCI at baseline could either remain stable or could convert to a lower functioning group. AD subjects were dichotomized into slow versus fast progressors.
Results
All four atrophy rates were greater among normal subjects who converted to MCI or AD than those who remained stable; greater among MCI subjects who converted to AD than those who remained stable, and greater among fast than slow AD progressors. In general, atrophy on MRI was detected more consistently than decline on specific cognitive tests/rating scales._ With one exception, no differences were found among the four MRI rate measures in the strength of the correlation with clinical deterioration at different stages of the disease.
Conclusions
These data support the use of rates of change from serial MR imaging studies in addition to standard clinical/psychometric measures as surrogate markers of disease progression in AD. Estimated sample sizes required to power a therapeutic trial in MCI were an order of magnitude less for MRI than for change measures based cognitive tests/rating scales.
Psychometric tests and severity rating scales are the de facto gold standard for assessing disease progression in Alzheimer's disease (AD). Change measures from serial imaging studies have been proposed as an adjunctive surrogate marker of disease progression in AD with the expectation that imaging may provide better sensitivity and precision than standard clinical and psychometric measures(1–4). Various serial imaging approaches have been proposed including different structural magnetic resonance imaging (MRI) atrophy rate measures and also serial measures of glucose metabolism with positron emission tomography (PET). (1–3, 5–9) The fact that different serial imaging approaches have been proposed for largely the same objective raises obvious questions. Which imaging approach is best? Do some imaging measures of progression perform better than others at different stages of the disease?
The objectives of this study were to: 1) establish atrophy rates for several MRI measurement techniques in different clinical stages of AD, 2) test the hypothesis that rates of atrophy correlate with clinical measures of disease progression, 3) test the hypothesis (separately among normal, MCI, and AD subjects ) that the strength of the association between clinical progression and atrophy rates varies among different MRI measures, 4) estimate sample sizes required to power a therapeutic trial in MCI. All subjects were classified as cognitively normal, mild cognitive impairment (MCI), or AD at baseline. Clinical progression was assessed in two ways: 1) among normals and MCIs – clinical conversion to a lower functioning group over time, and among ADs slow vs. fast progression; 2) change in performance on specific cognitive tests and rating scales. Changes in volume of four brain structures over time were measured. Two were medial temporal lobe structures – hippocampus and entorhinal cortex (ERC), and two were hemispheric measures – whole brain and ventricle. The four MRI measurements that we evaluated have received high levels of attention in the recent literature. We did not intend to conduct an exhaustive analysis of all possible imaging techniques (10–13).
Methods
Methods of Recruitment and Clinical Characterization
Patients and controls were recruited from the Mayo Alzheimer's Disease Patient Registry and Alzheimer's Disease Research Center (ADPR/ADRC). (14) These longitudinal studies of aging and dementia provide an ongoing mechanism for identification, enrollment, and longitudinal clinical characterization of both community and referral patients. Both the ADPR and ADRC include MRI studies. These studies were performed with Mayo IRB approval and informed consent of the subject or an appropriate proxy. At both baseline and follow-up assessments the subjects must have been classified into one of three clinical groups: cognitively normal, MCI, or probable AD. Potential subjects who had cognitive symptoms that were clinically felt to be unrelated to AD were excluded. For example, subjects who suffered a stroke or who developed depression before or during the follow-up period were excluded. Study participants were assigned to diagnostic group categories during ADPR/ADRC Consensus Committee meetings consisting of a geriatrician, neurologist, neuropsychologist, psychometrist, and nurses who had seen the patient. The same Consensus Committee members assigned diagnostic group categories to patients at both the first and second clinical follow-up point.
Categorization into diagnostic groups represented a clinical judgment that was based on the combined results of medical history, clinical exam, and psychometrics. Criteria for the diagnosis of normal cognition were 1) no active neurologic or psychiatric disorders; 2) some subjects may have had ongoing medical problems, the illnesses or their treatments did not interfere with cognitive function; 3) a normal neurological exam; 4) no psychoactive medications; 5) were independently functioning community dwellers. Criteria for the diagnosis of MCI were: 1) memory complaint documented by the patient and collateral source; 2) normal general cognition, 3) normal activities of daily living; 4) not demented (DSM-III-R); 5) memory impaired for age and education (15).The diagnosis of MCI was a clinical categorization of individuals who displayed a memory impairment with relative preservation of other cognitive functions – i.e. amnestic MCI (15–18). The diagnosis of probable AD was made according to the Diagnostic and Statistical Manual for Mental Disorders III Revised (DSM-III-R) Criteria for Dementia, and National Institute of Neurological and Communicative Disorders and Stroke/Alzheimer's Disease and Related Disorders Association Criteria (NINCDS/ADRDA) for AD. (19, 20)
Clinical Transition Analysis
In addition to the baseline diagnostic group assignment, each normal and MCI subject was further classified as either stable or converter. Subjects were designated as stable if their clinical classification assigned by the ADPR/ADRC Consensus Committee did not change, i.e., normal subjects remained normal, and MCI remained MCI. Subjects were designated as converters if their clinical classification changed, i.e., normal subjects converted to MCI or AD, or MCI subjects converted to AD. The AD group was dichotomized into slow progressor or fast progressor groups. A slow progressor was defined as an individual who did not decline on the clinical dementia rating scale (CDR) summary score (21). A fast AD progressor was defined as an individual who did decline on the CDR summary score. For the clinical transition analyses therefore each subject was assigned to one of six possible groups: normal stable, normal converter, MCI stable, MCI converter, AD slow progressor, or AD fast progressor.
All subjects in the ADPR/ADRC are followed with approximately annual clinical assessments. The interval between first and last MRI scans varied by baseline clinical group. The follow-up interval range for subjects who were classified as normal at baseline was 2.2 to 5.2 years; for subjects classified as MCI at baseline 1.2 to 4.8 years; and, for subjects classified as AD at baseline 0.9 to 2.4 years.
MRI Methods
All MR studies were performed within four months of the matching clinical/psychometric assessment. The maximum interval between MRI and linked clinical assessment was two months in 131 subjects, three months in 22 subjects, and four months in 7 subjects. Results of the MRI studies were used clinically only to identify treatable causes of dementia. The numeric data on brain atrophy rates was produced for research purposes only, were unknown to the Consensus Committee throughout the study, and were not employed in the clinical classification process.
All patients were imaged at 1.5T (Signa, General Electric Medical Systems, Milwaukee, WI) using a standardized imaging protocol. All volume measurements were derived from a T1-weighted 3D volumetric spoiled gradient recalled echo sequence with 124 continuous partitions, 1.6 mm slice thickness, a 22 cm × 16.5 cm field of view, 192 views, and 25 degree flip angle.
All image-processing was performed by the same research associate who was blinded to all clinical information (e.g., age, gender, and clinical status). The date of each MR scan was masked in the image header file so that the imaging measures were done without knowledge of the chronological ordering of the scans in each scan pair. The rates of atrophy for each of the four MR measures were expressed as percent change in volume divided by the interval between the scans in years.
Hippocampal and ERC measurements were performed by manual tracing after several image pre-processing steps had been performed. (22) The 3D image data set of the second scan was spatially registered with that of the first scan. The image data of both scans were then interpolated in-plane to the equivalent of a 512 × 512 matrix and magnified times two. The images of the whole brain were then subvolumed to include the temporal lobes. An intensity inhomogeneity correction algorithm developed in-house was then applied to both MR scans. Tracing of the paired scans for each subject was performed side-by-side. After hippocampal and ERC boundaries had been delineated on each anatomic slice, the number of voxels was calculated automatically with a summing region of interest function. These were multiplied by voxel volume to give a numeric value in mm3.
The borders of the right and left hippocampi were manually traced for each slice sequentially from posterior to anterior. In-plane hippocampal anatomic boundaries were defined to include the CA1 through CA4 sectors of the hippocampus proper, the dentate gyrus, and subiculum. (23) The posterior boundary of the hippocampus was determined by the oblique coronal anatomic section on which the crura of the fornices were identified in full profile.
We employed slight modifications of criteria published by Insausti et al and Killiany et al for determining boundaries of the ERC on MRI. (24–26) Its infero-lateral boundary was defined by the medial edge of the collateral sulcus posteriorly and by the rhinal sulcus anteriorly. In some cases the sulcus was bi- or multi-lobed. In these sections, the more medially located sulcus was used as the border. The medial boundary was cerebro-spinal fluid (CSF) in the crural cistern. The ERC was demarcated from the overlying subiculum by a medial extension of the horizontal line defined by the gray-white subicular interface. The posterior boundary of the ERC was defined as the first imaging section containing the intralimbic gyrus when progressing from posterior to anterior. In-plane boundaries were measured from this slice forward on six consecutive sections bilaterally.
Rates of change of the whole brain and ventricle were made using a home built software algorithm, described in detail elsewhere. (27) Inputs for this algorithm are two or more 3D volumetric MRI scans obtained at different times. The algorithm begins with a series of data preprocessing steps including extracting the brain from the overlying skull and scalp, creating binary masks of brain and ventricle, correcting B1 field non-uniformity, spatial alignment of the two image volumes, scaling correction, and intensity normalization. The pre-processed brain volumes are then entered into a module that computes change in brain and ventricular volume from baseline to followup MRI exam. This volume change computation method was modified from the SIENA (28)software package. Volume change is determined at the brain-CSF interface over the entire three-dimensional surface of the registered brain volumes. Computation of volume change is conceptually very similar to the boundary shift integral method of Fox and Freeborough (29)except that volume change is derived from a measure of the intensity gradient perpendicular to the brain-CSF interface in the registered MR volumes rather than from the absolute intensity difference.
Psychometric Assessment
Psychometric assessments within four months of MRI scans were obtained for 89% of normal, 98% of MCI, and 100% of AD subjects. We selected a limited number of tests from a more extensive testing battery for MRI-cognitive correlation analyses in order to appropriately avoid floor and ceiling effects. The mini-mental state exam (MMSE) (30) and Dementia Rating Scale (DRS) were employed for all subjects – normal, MCI, and AD – to provide continuity across all subjects in the study. The MMSE, while somewhat insensitive to change at the upper end of the cognitive range, was selected because it is widely used in the field. The DRS, while less widely used, has a greater dynamic range than the MMSE. The CDR was originally designed to stage disease severity in dementia, and we performed the correlations with the sum of boxes score only in the MCI and AD groups. For memory assessment we employed the Auditory Verbal Learning Test (AVLT) – delayed recall, and the percent retention on the Logical Memory II subtest of the Wechsler Memory Scale –Revised (LM II (%))(31, 32). The AVLT –delayed recall is a relatively difficult test, and therefore AVLT-MRI correlations were only performed in the cognitively normal baseline cohort. The LM II (%) is less difficult than the AVLT and was used to provide a memory measure common to the normal and MCI groups. The change from baseline to follow-up performance was measured in each subject and annualized.
Statistical Methods
The use of different intervals between baseline and follow-up for individuals in each of the three baseline clinical groups was an intentional feature of the study design. Rates of clinical transition are an order of magnitude greater for individuals with MCI vs. cognitively normal subjects: 12 to 15% per year of individuals with MCI will decline to AD while only 1 to 2% per year of normal subjects will decline to MCI. (16, 33) In order to observe a comparable number of conversion events either the number of normal subjects enrolled would have to be an order of magnitude greater than the number of MCI subjects, or the follow-up interval would have to be greater for normal vs. MCI subjects. We chose the latter approach. We did insure, however, that the follow-up interval was approximately the same between control vs. stable members of the normal and MCI cohorts, and between fast vs. slow progressing AD subjects. (34) The rate comparisons of interest were within members of the three baseline clinical groups.
The distributions of many of the MRI and psychometric variables were skewed. Therefore for the sake of consistency, all summary statistics for quantitative variables are reported as median values, and variability as inter-quartile range (IQR). All tests for significance were performed using nonparametric methods and were two-sided. For both MRI and cognitive measures, tests for differences in rates of change between stable vs. converter normal and MCI subjects, and between fast vs. slow AD progressor subjects were performed using rank sum tests. Correlations between change in MRI volumes and change in cognitive scores were tested for significance using Spearman correlations.
In order to test whether the strength of the association between rate of atrophy and clinical transition status (stable versus converter, fast versus slow for AD) differed among the four MR measurements, we used the basic approach proposed by Choi (35)separately for each cohort (normal, MCI, AD). To illustrate using the normal cohort, the dependent variable was defined as 1 if stable, 0 if converter. Four independent variables (x1, x2, x3, and x4) were defined, one for each MR rate measurement, as the ranks of the volumes in the pooled (stable plus converter) cohort. Defining z1= x1 − x2, z2 = x1 + x2 − 2x3, and z3 = x1 + x2 + x3 − 3x4, we tested that clinical transition status was unrelated to the three z variables using logistic regression. This is equivalent to testing that the association between clinical transition status and rate of atrophy is the same among the 4 MRI measurements. (35) To compare the associations between only two atrophy measurement techniques, only z1 is defined and a rank sum test was used to compare z1 values between stable and converter subgroups. This approach tests the null hypothesis that the distribution overlap between the two subgroups (stable vs converter for example) is the same for each MRI rate measurement.
The ability of longitudinal change in volume to distinguish between stable vs converter (or fast vs. slow AD) subgroups depends on the overlap between the two subgroups, and this in turn depends on both the differences in the medians and the variability in the data. It is desirable to have an index measuring the overlap between groups for each MRI rate measurement. For this purpose, we performed a logistic regression discriminating between the two subgroups for each MRI measurement. Overlap may be measured by the odds ratio (OR) from the logistic regression. The independent variable was defined as the percentile of the annual percent change in the pooled (stable plus converter subgroups) data set. The resulting odds ratio per decile (OR) measures the overlap between stable vs. converter (or fast vs. slow AD) subgroups.
Recognizing general interest in sample size estimates for therapeutic trials using imaging, we provided power calculations for 25% and 50% treatment effect sizes in the MCI group. Effect size represents a 25% or 50% reduction in the median transformed rates of MRI atrophy or change in cognitive test/rating scale performance. For a given MRI or cognitive measure, we calculated the median observed value among all MCI subjects as well as the median we would expect to see under a 50% or 25% improvement in the rate of decline. We next found a transformation that would make the observed data approximately normal and applied this transformation to the observed median and the improvement median. The difference between these two values became the effect size we sought to detect with 90% power using an unpaired two-sided t-test. To estimate the population standard deviation on the scale used for the t-test, we calculated the sample standard deviation of the transformed data. The transformations used were of the form y = (x + c)p. Here x is the observed rate of change, c is the smallest integer greater than or equal to zero such that x + c is positive for all x, and p = 1/2 when the data were right skewed or p = 2 when the data were left skewed. Since the MMSE measurements were approximately normal, observed means were used rather than medians to calculate effect size and no transformation was performed.
An understanding of the precision of the four different MR measurements is helpful in interpreting the results. Most of the published data on this topic address the precision of repeated measures of the volume of a particular brain structure (for example hippocampal volume), which is not the issue here. We are interested in the test-retest reproducibility of measurements of change (i.e. reproducibility of delta measurements). In order to provide this data, three subjects were randomly selected from each of the six clinical groups in this study. These 18 subjects had all MR measurements repeated one year later by same research associate, who was blinded to results of the first measurements. The difference in annual percent change (APC) as measured initially minus the APC as measured one year later was calculated. We refer to these differences as deltas. Precision was measured two ways. First, we computed the difference (delta) between the two annual percent change values for each subject and the corresponding IQR for each of the four MRI measures. To test for differences among MRI measures, we performed Friedman's two-way ANOVA on the ranks of the absolute values of the differences. Pairwise comparisons were performed using signed rank tests on the absolute differences. With the second approach, we calculated intra-class correlations (ICCs) based on the ranks of the 18 original + 18 retest = 36 annual percent changes. This nonparametric ICC represents the proportion of total variability in the ordering of the measurements that is due to person-to-person variability. One minus the ICC is the proportion of total variability due to test-retest variability.
Each subject's baseline MRI volumes served an as internal control for inter-subject variation in head size. Therefore, there was no need to perform brain volume normalization when comparing rates among different subjects. (34)
Results
Descriptive information is found in Table 1. Of the 55 subjects who were cognitively normal at baseline, 13 converted to MCI and 2 to AD during follow-up. For the most part therefore, data pertaining to normal converters in this study represent conversion to MCI. Of the 41 subjects who entered the study as MCI, 26 converted to AD. Of the 64 AD subjects at baseline, 31 were classified as slow progressors and 33 as fast progressors. The number of women exceeded the number of men in most of the clinical subgroups as would be expected in this age range. The proportion of Apolipoprotein E4 carriers was fewer in the normal stable group than in the five other groups as would be expected. At the time of entry into the study the ages of the subjects ranged from 52 to 94. The median age at entry into the study did not vary significantly across the three baseline clinical groups.
Table 1.
Descriptive Information
| Normal | MCI | AD | ||||
|---|---|---|---|---|---|---|
| Stable (n = 40) | Converter (n=15) | Stable (n=15) | Converter (n = 26) | Slow progressor (n = 31) | Fast progressor (n = 33) | |
| Females (%) | 23 (58%) | 10 (67%) | 5 (33%) | 17 (65%) | 19 (61%) | 19 (58%) |
| ApoE41 (%) | 4 (10%) | 4 (27%) | 9 (60%) | 11 (42%) | 17 (55%) | 18 (56%) |
| Age at baseline MRI | 79 (56, 93) | 80 (70, 89) | 76 (56, 92) | 77 (64, 94) | 76 (58, 86) | 79 (52, 92) |
| Education2 | 13 (8, 20) | 14 (8, 20) | 12 (8, 20) | 13 (7, 18) | 13 (8, 18) | 13 (8, 18) |
| MMSE3 | 29 (27, 30) | 29 (26, 30) | 27 (24, 29) | 25 (18, 30) | 24 (11, 29) | 19.5 (11, 25) |
| DRS4 | 138 (127, 144) | 135 (107, 142) | 130 (114, 139) | 122 (101, 138) | 114 (62, 133) | 104 (76, 127) |
| Years between baseline and follow-up MRI | 4.3 (2.5, 5.2) | 3.4 (2.2, 5.1) | 2.4 (1.2, 3.7) | 2.3 (1.2, 4.8) | 1.2 (0.9, 2.2) | 1.4 (0.9, 2.4) |
Values for continuous variables in the table are: median (min., max.)
Proportion of individuals with APOE genotypes ∈3/4 or ∈4/4
Maximum educational attainment
MMSE = Mini-Mental State examination at baseline
DRS = Dementia Rating Scale at baseline
Annualized percent change in volume by clinical group and by MRI measurement technique are found in Table 2. Rates of atrophy were greater in converter than stable normal subjects, greater in converter than stable MCI subjects, and greater in fast vs. slow progressing AD subjects. These pair-wise differences in atrophy rates were significant for each of the four MRI measurements with three exceptions (see Table 2). The variability (IQR) in change was also consistently greater in the converter/ fast progressor groups vs. the stable/slow progressor groups.
Table 2.
Annualized Rates of Change (%) by clinical group and MRI measurement technique
| Normal | MCI | AD | |||||||
|---|---|---|---|---|---|---|---|---|---|
| Stable (n = 40) | Conv. (n=15) | Diff. | Stable (n=15) | Conv. (n = 26) | Diff. | Slow prog. (n = 32) | Fast prog. (n = 33) | Diff. | |
| Hippocampus | −1.4 | −3.3 | −1.9*** | −1.8 | −3.3 | −1.5*** | −3.0 | −3.6 | −0.6 |
| 1.2 | 2.4 | 1.7 | 2.9 | 4.5 | 3.2 | ||||
| −3.0, 0.0 | −6.7, −1.1 | −4.4, −0.5 | −7.8, −1.5 | −9.4, −0.1 | −15.4, −0.1 | ||||
| Entorhinal cortex | −2.9 | −5.1 | −2.2** | −3.7 | −6.8 | −3.1* | −8.0 | −8.4 | −0.4 |
| 2.6 | 5.1 | 3.7 | 4.4 | 5.8 | 9.2 | ||||
| −5.5, 0.3 | −10.2, −1.1 | −15.9, −1.4 | −16.0, −0.1 | −20.5, −0.3 | −22.7, −0.9 | ||||
| Whole brain | −0.4 | −0.8 | −0.4* | −0.4 | −0.8 | −0.4*** | −0.6 | −1.4 | −0.8*** |
| 0.3 | 0.5 | 0.4 | 0.5 | 0.7 | 1.1 | ||||
| −1.5, 0.2 | −1.2, 0.3 | −0.8, 0.1 | −2.5, −0.2 | −2.4, 0.4 | −3.6, −0.2 | ||||
| Ventricle | 1.7 | 3.4 | 1.7*** | 2.6 | 3.4 | 0.8 | 4.3 | 6.4 | 2.1** |
| 0.9 | 1.6 | 1.3 | 2.8 | 3.3 | 3.7 | ||||
| −0.4, 4.3 | −0.3, 5.8 | 0.8, 5.0 | 1.8, 8.3 | −6.5, 7.5 | 1.9, 11.5 | ||||
Diff. = difference between stable vs converter normal or MCI (or slow vs. fast progressor in the case of AD). Values in the table are median / interquartile range / minimum, maximum, except for those in the difference columns. Units are % change in volume/year.
Number of missing observations: Ventricle among MCIs = 1
Rates that differ significantly between stable vs converter normal or MCI (or slow vs. fast progressor in the case of AD) are indicated in the difference column of each baseline group (normal, MCI, or AD)
p <0.05 =
p≤0.01 =
p≤0.001 =
The relative strength of the association between rate of atrophy and clinical transition (or fast vs slow progressing AD) among the four MRI measures can be envisioned as vertical comparisons within the columns of Table 2. The strength of these associations, using an index of odds ratios (ORs) and 95% confidence intervals for a one-decile decline in atrophy rate, are shown in Figure 1. To illustrate, the OR for the hippocampus in normal subjects was 1.65. This means that among the pooled group of normal subjects the risk of being a converter is 1.65 times higher with a hippocampal atrophy rate at the 70th percentile than for a subject with an atrophy rate at the 60th percentile. There was no difference in the relative associations among the four MRI rate measurements in the normal or AD cohorts (P=0.226 and P=0.279, respectively; Choi's test). The difference was significant in the MCI cohort (P=0.007) where in pairwise comparisons, the only significant difference was between the whole brain and ventricle (P=0.003).
Figure 1.
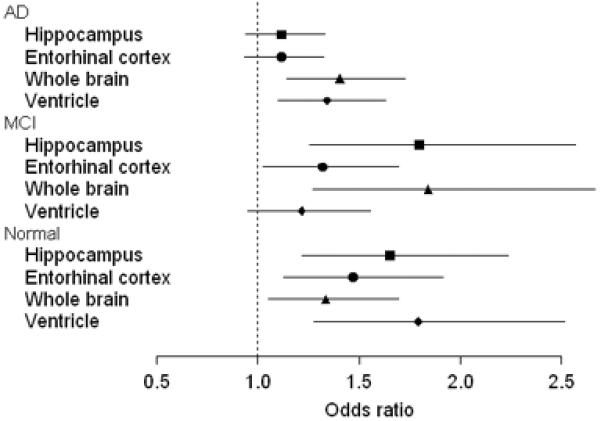
Comparing associations across MRI measurements within baseline clinical group. Shown are estimated odds ratios and 95% confidence intervals for clinical conversion among normal or MCI (or fast progression in AD) given a 1-decile increase in annual percent MRI rate (e.g., from the 60th percentile to the 70th percentile).
Annualized change in cognitive test performance by group is found in Table 3. Rates of decline on cognitive test performance were greater among converter than stable normal subjects, greater among converter than stable MCI subjects, and greater among fast vs. slow progressing AD subjects. These pair-wise differences in annual change in cognitive test performance were significant for each of the cognitive tests/rating scales assessed with three exceptions (see Table 3).
Table 3.
Annualized Change in Cognitive Test Performance by Group
| Normal | MCI | AD | ||||
|---|---|---|---|---|---|---|
| Stable | Converter | Stable | Converter | Slow progressor | Fast progressor | |
| MMSE | 0.0 | −0.2 | 0.0 | −1.2* | −1.9 | −3.9* |
| 0.5 | 0.6 | 1.3 | 1.7 | 3.0 | 5.0 | |
| −0.9, 0.5 | −1.3, 0.9 | −1.6, 2.7 | −4.3, 1.3 | −8.2, 2.8 | −14.3, 2.8 | |
| DRS | 0.2 | −1.4*** | 0.4 | −3.0** | −3.0 | −8.7 |
| 1.5 | 1.9 | 4.6 | 4.5 | 13.3 | 16.2 | |
| −2.3, 4.2 | −5.0, 0.9 | −5.6, 6.9 | −9.8, 1.2 | −40.4, 14.0 | −52.1, 3.5 | |
| AVLT | 0.0 | −0.8*** | ||||
| 0.7 | 1.0 | |||||
| −1.6, 1.1 | −2.3, 0.0 | |||||
| LM II (%) | 0.0 | −7.9** | 0.0 | −1.5 | ||
| 4.5 | 10.6 | 10.8 | 16.3 | |||
| −9.1, 16.0 | −22.1, 13.3 | −37.3, 12.9 | −38.2, 33.9 | |||
| CDR | 0.0 | 1.0** | 0.4 | 3.5*** | ||
| 0.2 | 1.7 | 1.8 | 2.8 | |||
| −0.2, 0.6 | −1.2, 4.5 | −2.8, 3.6 | 0.7, 9.8 | |||
Values in the table are: median / interquartile range / min., max. Units are those of each individual test.
Number of missing observations:
For MMSE among Normals = 9, MCIs = 5, ADs = 5
For DRS among Normals = 7, MCIs = 2, ADs = 16
For AVLT among Normals = 10
For LM II (%) among Normals = 13, MCIs = 1
For CDR among MCIs = 2, ADs = 0
Rates that differ significantly between stable vs converter normal or MCI (or slow vs. fast progressor in the case of AD) are indicated in the converter column of each baseline group (normal, MCI, or AD)
p<0.05 =
p≤0.01 =
p≤0.001 =
Tests are MMSE = Mini Mental State Exam; DRS = Dementia Rating Scale; AVLT = Auditory Verbal Learning Test – delayed recall; LM II (%) = percent retention on Logical Memory II subtest of the Wechsler Memory Scale –Revised; CDR = Clinical Dementia Rating – sum of boxes.
Table 4 depicts the proportion of each of the six cohorts who declined over time on MRI and cognitive tests/rating scales. In general a greater proportion of subjects in each clinical group declined on imaging compared with cognitive tests/rating scales.
Table 4.
Percent of subjects declining by group for each MRI and cognitive measure
| Normal | MCI | AD | ||||
|---|---|---|---|---|---|---|
| Stable | Converter | Stable | Converter | Slow progressor | Fast progressor | |
| Hippocampus | 100% | 100% | 100% | 100% | 100% | 100% |
| Entorhinal Cortex | 93 | 100 | 100 | 100 | 100 | 100 |
| Whole Brain | 95 | 87 | 93 | 100 | 90 | 100 |
| Ventricle | 98 | 93 | 100 | 100 | 94 | 100 |
| MMSE | 29 | 58 | 42 | 67 | 73 | 83 |
| DRS | 40 | 85 | 43 | 84 | 76 | 83 |
| AVLT | 39 | 92 | ||||
| LM II (%) | 48 | 82 | 43 | 54 | ||
| CDR | 38 | 81 | 58 | 100 | ||
Tests are MMSE = Mini Mental State Exam; DRS = Dementia Rating Scale; AVLT = Auditory Verbal Learning Test – delayed recall; LM II (%) = percent retention on logical Memory subtest of the Wechsler Memory Scale –Revised; CDR = Clinical Dementia Rating – sum of boxes.
Table 5 lists estimated sample sizes needed per group to detect a 25% or 50% reduction in the four MRI rate measures as well as the MMSE and CDR sum of boxes. The sample sizes required are markedly less for MRI than for the cognitive/rating scale measures.
Table 5.
Sample size estimates needed per group to detect differences equaling 50% or 25% of observed median* rate of change among MCI patients
| Observed median | SD(on transformed scale†) | Sample size to detect effect size of 50% | Sample size to detect effect size of 25% | |
|---|---|---|---|---|
| Hippocampus | −2.55 | 16.13 | 24 | 102 |
| Entorhinal cortex | −5.97 | 72.72 | 21 | 91 |
| Whole brain | −0.63 | 1.91 | 32 | 130 |
| Ventricle | 3.29 | 0.44 | 16 | 69 |
| CDR | 0.54 | 0.33 | 311 | 1277 |
| MMSE | −0.47 | 1.31 | 658 | 2628 |
Median except for MMSE which is mean
** with 90% probability and an alpha level of 0.05 using unpaired two-sided two-sample t-tests
Transformation used: HP, y = (x + 8)2; ERC, y = (x +17)2; WB, y = (x + 3)2; VENT, y = (x + 0)1/2; CDR, y = (x + 2)1/2; MMSE, none (y = x)
Among normal subjects, correlations between change in MRI and change in cognitive performance were evaluated for four cognitive tests, the MMSE, DRS, LM II (%), and AVLT -delayed recall (Table 6). There were no significant correlations for any of the change scores on cognitive tests with the hippocampal or ERC rate measure. Both the whole brain and ventricular rate measures were correlated with all cognitive test change scores except LM II (%) (Fig 2).
Table 6.
Correlation between Change in MRI and Change in Cognitive Test Performance among Normal Subjects
| Hippocampus | Entorhinal Cortex | Whole Brain | Ventricle | |
|---|---|---|---|---|
| MMSE | 0.14 (0.35) | −0.02 (0.91) | 0.37 (0.01)* | −0.31 (0.04)* |
| DRS | 0.24 (0.10) | 0.14 (0.33) | 0.46 (<0.00)* | −0.49 (<0.00)* |
| AVLT | 0.29 (0.05) | 0.08 (0.60) | 0.37 (0.01)* | −0.49 (<0.00)* |
| LM II (%) | 0.10 (0.51) | 0.04 (0.79) | 0.22 (0.16) | −0.26 (0.10) |
Values in table represent the Spearman correlation coefficients (p-value) between the annualized change in cognitive test score and annualized percent change in MRI measurement.
p < 0.05
Tests are MMSE = Mini Mental State Exam; DRS = Dementia Rating Scale; AVLT = Auditory Verbal Learning Test – delayed recall; LM II (%) = percent retention on Logical Memory subtest of the Wechsler Memory Scale –Revised.
Figures 2A, B, and C.


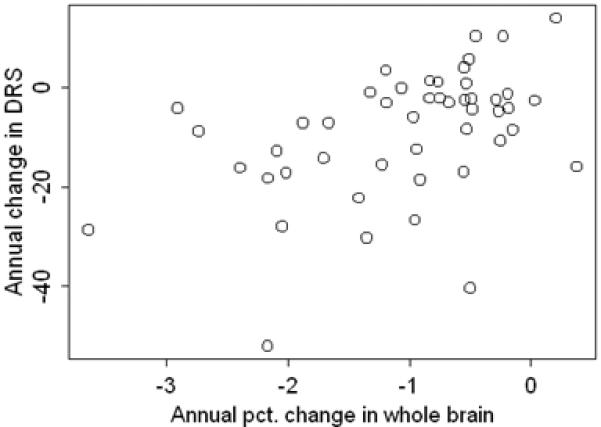
Correlation between annual change in DRS score and annual percent change in whole brain volume. Normal subjects are presented in 2A, MCI in 2B, and AD in 2C.
Among MCI subjects, correlations were calculated between change in MRI and change in performance on four cognitive tests/rating scales- the MMSE, DRS, LM II (%) , and CDR sum of boxes (Table 7). Significant correlations were seen for the hippocampal rate only with the change in DRS, and for the ERC rate only with the change in CDR sum of boxes. With one exception, both the whole brain and ventricular rate measures were correlated with the change on all cognitive tests/rating scales (Fig 2).
Table 7.
Correlation between Change in MRI and Change in Cognitive Test /Rating Scale Performance among MCI Subjects
| Hippocampus | Entorhinal Cortex | Whole Brain | Ventricle | |
|---|---|---|---|---|
| MMSE | 0.22 (0.19) | 0.27 (0.12) | 0.38 (0.02)* | −0.36 (0.03)* |
| DRS | 0.32 (0.05)* | 0.07 (0.68) | 0.48 (0.00)* | −0.42 (0.01)* |
| LM II (%) | −0.03 (0.88) | 0.07 (0.66) | 0.29 (0.07) | −0.36 (0.03)* |
| CDR | −0.08 (0.62) | −0.42 (0.01)* | −0.52(<0.00)* | 0.49 (0.00)* |
Values in table represent the Spearman correlation coefficients (p-value) between the annualized change in cognitive test/rating scale score and annualized percent change in MRI measurement.
p < 0.05
Tests are MMSE = Mini Mental State Exam; DRS = Dementia Rating Scale; LM II (%) = percent retention on Logical Memory subtest of the Wechsler Memory Scale –Revised; CDR = Clinical Dementia Rating – sum of boxes.
Among AD subjects, correlations were performed with MMSE, DRS, and CDR sum of boxes (Table 8). For both the hippocampus and ERC, only the correlation with change on the MMSE was significant. Both the whole brain and ventricular rate measures were correlated with change on all cognitive tests/rating scales (Fig 2).
Table 8.
Correlation between Change in MRI and Change in Cognitive Test/Rating Scale Performance among AD subjects
| Hippocampus | Entorhinal Cortex | Whole Brain | Ventricle | |
|---|---|---|---|---|
| MMSE | 0.35 (0.01)* | 0.46 (<0.00)* | 0.47 (<0.00)* | −0.38 (0.00)* |
| DRS | 0.16 (0.28) | 0.21 (0.16) | 0.47 (<0.00)* | −0.39 (0.01)* |
| CDR | −0.24 (0.06) | −0.12 (0.33) | −0.45 (<0.00)* | 0.40 (0.00)* |
Values in table represent the Spearman correlation coefficients (p-value) observed between the annualized change in cognitive test/rating scale score and annualized percent change in MRI measurement.
p < 0.05
Tests are MMSE = Mini Mental State Exam; DRS = Dementia Rating Scale; CDR = Clinical Dementia Rating – sum of boxes.
Figure 3 shows the annual percent change (APC) in the four MRI measures as measured initially minus the APC as measured one year later. We refer to these differences in measured APCs as the deltas. The plots do not suggest systematic differences between the first and second APC measurements (i.e., values are centered at 0), but do indicate that reproducibility varies by MRI measurement technique. To quantify these results we computed median and interquartile ranges (IQR) of the deltas. The medians of the deltas were not different from 0 for any of the four MRI measures. The IQRs in units of APC × 10 −3 were: 0.76 for whole brain, 1.84 for ventricle, 2.30 for hippocampus, and 13.71 for ERC. The absolute magnitude of the delta's differed among MRI measures (p<0.001). Pair-wise tests indicate that ERC rate measurements were less precise than ventricle (p=0.001), hippocampus (p=0.005), and whole brain (p< 0.001). Whole brain rate measurements were more precise than hippocampal (p=0.005) and ventricle measurements (p=0.018). No difference in precision was found between ventricle and hippocampal rate measurements. Non-parametric intraclass correlation coefficients for the test – retest reproducibility of the rate measurements were: ventricle 0.91; hippocampus 0.91; whole brain 0.89; and ERC 0.47.
Figure 3.

Differences in annual percent change (APC) in volume measured initially and one year later. HP, hippocampus; ERC, entorhinal cortex; WB, whole brain; VENT, ventricle
Discussion
In this study we examined associations between change in several structural MRI measures over time with clinical measures of disease progression in normal, MCI, and AD subjects. Clinical progression was defined in two ways. We dichotomized clinical progression within each baseline cohort, and we also measured change over time on specific cognitive tests/rating scales.
In general, each of the four MRI rate measurements was significantly associated with dichotomized indices of clinical progression, and the associations were consistently in the expected direction: rates of atrophy in normal or MCI subjects who converted to a lower functioning group (or fast progression in the case of AD) were greater than atrophy rates in normal or MCI subjects who were stable (or slow progression in AD) (Table 2). Also, the rates of normal and MCI converter subjects were similar to those of AD, while stable MCI rates were similar to those of stable normal subjects, indicating that the MRI change measures correlate much more closely with disease progression than with disease stage at baseline.
At the outset we expected to find that medial temporal lobe rate measures, hippocampus and ERC, would be more strongly associated with the conversion from normal to MCI. And, measures of hemispheric atrophy rates, whole brain and ventricle, would be more strongly associated with clinical progression at later stages of the disease, specifically among AD subjects. This expectation was based on the known topographic progression of neurofibrillary pathology in AD from medial temporal lobe limbic areas early in the disease to neocortical association areas later. (36) Most of the normal subjects who converted became MCI. This clinical transition is characterized pathologically by disease progression predominantly in medial temporal limbic cortex. Hippocampal and ERC measures directly measure the rate of change in only these structures. Conversely, individuals who started the study as AD by definition already had extensive neocortical pathology at baseline. The whole brain and ventricular measures, while not region specific, are certainly dominated by tissue loss that is occurring in a widespread manner throughout the brain, not just the medial temporal lobe. It seemed reasonable a priori to expect that a measurement of global brain atrophy ought to be more sensitive to change at the stage in the disease when pathology was spreading throughout the brain. We did not find the anticipated differences among the four MRI rate measures in the strength of the correlation with clinical transition at different stages of the disease. However, in some instances the possibility exists that differences may exist that we were unable to detect due to sample size limitations and this possibility is reflected in the 95% confidence intervals in Fig 1.
The correlations observed between the four MR measures and change in specific cognitive tests/rating scales were also unexpected in some ways (Tables 6–8). We expected that the most consistent MR-cognitive correlation in normal subjects would be between changes in memory (AVLT and LM II (%) ) and medial temporal lobe MR rate measures (hippocampus and entorhinal cortex). Instead, the most consistent correlations were seen with the hemispheric rate measures for all cognitive tests/rating scales, in all three baseline clinical groups – normal, MCI, and AD. One partial explanation for this is found in the MRI rate measurement precision data (Fig 3). ERC rate measurements were substantially less precise than all other measurements; and the precision of the whole brain rate measure was better than the hippocampus. However, the measurement precision data cannot explain the greater cognitive test/rating scale correlations with the ventricle vs. the hippocampus, because the reproducibility of these two MRI rate measurements was roughly equal.
Cognitive test/rating scale changes generally had the expected associations with clinical conversion or lack thereof (or slow vs. fast progression in AD) (Table 3). Of interest is the fact that there were “improvements” in cognitive performance among some members of every clinical group, for every cognitive test/rating scale evaluated. Some subjects also had a positive change in brain volume (or correspondingly a negative change in ventricular volume), however this was distinctly uncommon. And among subjects who ought to show decline (i.e. most MCI and all AD subjects), the proportion that declined was usually significantly greater on MRI than cognitive tests/rating scales (Table 4). Although they both relate to the brain, cognitive tests are obviously different from volumetrics. The former reflect function; the latter reflect structure. Different factors contribute to a person's ability to complete tests well than contribute to the accurate measurement of brain volume. A person's cognitive functioning at any single point in time is only partially determined by his true cognitive endowment (i.e., the “ability” that the test attempts to measure). Motivation and effort, experiences relating to and comfort with testing, general health, medications used, emotional distress, fatigue, etc., all contribute to cognitive-test and rating-scale variability, but none of these affects volumetric measures. If a person's brain volume increases from time 1 to time 2, that “increase” is most likely due to measurement error. However, if a person's cognitive performance improves from time 1 to time 2 that improvement is not necessarily measurement error -- even in AD patients. Nonetheless, these data raise questions about which is a more reliable measure of disease progression in AD -tests that fluctuate in response to many factors that are unrelated to underlying disease progression, or MRI measures, which seem inherently more stable. It is also possible that combining structural MRI and cognitive testing would produce more meaningful measures of disease progression than either alone.
Assuming a common standard of a 25% or 50% reduction in the rate of deterioration over one year for all measures, the sample sizes required for clinical trials in MCI should be substantially smaller for the MRI measures vs. the cognitive tests/rating scales evaluated. In practice, attrition would have to be built into sample size estimates. In addition, one could argue that the annual rate of change observed for each individual measure in stable normal subjects should be subtracted from the rate in MCI patients in order to assess the rate of change due specifically to disease progression and thus “available for therapeutic modification”. We did not build either of these effects into the sample size calculations. However, the purpose of the analysis was to compare the measures head-to-head using common criteria in the same group of MCI patents, and in these data, the MRI measures outperformed the cognitive tests/rating scales evaluated.
We do not interpret the results of this study to indicate that medial temporal lobe measures have no clinical utility. Cross-sectional medial temporal lobe MRI measures have proven value in the early diagnosis of AD and prediction of future development of AD. (37–41) Further evidence for the utility of medial temporal lobe measures as a sensitive early marker of disease comes from a recent serial MRI study, in which changes in medial temporal lobe volumes of subjects destined to develop familial AD diverged from the trajectory of normally aging subjects earlier than hemispheric measures. (42) The data from our study address a different question –which MRI measures track with clinical change during (not before) clinical transitions.
The data from this study have implications for the use of imaging as surrogate markers of disease progression in therapeutic trials for AD. First, there was no apparent advantage of medial temporal over hemispheric rate measures for sensitivity to clinical conversion early in the disease process – i.e., within the normal and MCI groups. In addition, a trend was present suggesting better correlation between change on MRI and change on cognitive test/rating scale performance for hemispheric atrophy rates (whole brain and ventricle) compared with medial temporal lobe atrophy rates (hippocampus and ERC). Therefore the more automated and less labor-intensive hemispheric method might be preferable as a measure of disease progression in certain clinical trials. Second, unreliable assessment of disease progression was significantly more frequent with cognitive tests/rating scales than with the MRI measures. The greater precision of MRI translates into much smaller estimated sample size requirements for clinical trials in MCI. These data support the use of imaging in addition to standard clinical/psychometric measures as surrogate markers of disease progression in AD therapeutic trials. A distinction should be made between validation of a surrogate measure of therapeutic efficacy and validation of a surrogate marker of disease progression. In the absence of a positive disease-modifying therapeutic trial (which has yet to occur) that included imaging, one cannot claim to have validated imaging as a surrogate marker of therapeutic efficacy. However, one can claim to validate an imaging marker of disease progression in a natural history study such as this where the data indicate clear cut and reproducible correlations between multiple measures of clinical disease progression and measures of change on structural MRI.
Acknowledgments
Supported by the National Institute on Aging -AG11378, AG06786, AG16574
References
- 1.Fox NC, Freeborough PA. Brain atrophy progression measured from registered serial MRI: validation and application to Alzheimer's disease. Journal of Magnetic Resonance Imaging. 1997;7:1069–75. doi: 10.1002/jmri.1880070620. [DOI] [PubMed] [Google Scholar]
- 2.Fox NC, Cousens S, Scahill R, et al. Using serial registered brain magnetic resonance imaging to measure disease progression in Alzheimer disease. Arch Neurol. 2000;57:339–443. doi: 10.1001/archneur.57.3.339. [DOI] [PubMed] [Google Scholar]
- 3.Reiman EM, Caselli RJ, Chen K, et al. Declining brain activity in cognitively normal apolipoprotein E E4 heterozygotes: a foundation for using positron emission tomography to efficiently test treatments to prevent Alzheimer's disease. PNAS. 2001;98:3334–3339. doi: 10.1073/pnas.061509598. [DOI] [PMC free article] [PubMed] [Google Scholar]
- 4.Jack CRJ, Slomkowski M, Gracon S, et al. MRI as a biomarker of disease progression in a therapeutic trial of Milameline for Alzheimer's. Neurology. 2003;60:253–260. doi: 10.1212/01.wnl.0000042480.86872.03. [DOI] [PMC free article] [PubMed] [Google Scholar]
- 5.Fox NC, Scahill RI, Crum WR, et al. Correlation between rates of brain atrophy and cognitive decline in AD. Neurology. 1999;52:1687–1689. doi: 10.1212/wnl.52.8.1687. [DOI] [PubMed] [Google Scholar]
- 6.de Leon MJ, Convit A, Wolf OT, et al. Prediction of cognitive decline in normal elderly subjects with 2-[18F]fluoro-2-deoxy-D-glucose/positron-emission tomography (FDG/PET) PNAS. 2001;98:10966–10971. doi: 10.1073/pnas.191044198. [DOI] [PMC free article] [PubMed] [Google Scholar]
- 7.Jack CR, Jr., Petersen RC, Xu YC, et al. Hippocampal atrophy and apolipoprotein E genotype are independently associated with Alzheimer's disease. Annals of Neurology. 1998;43:303–310. doi: 10.1002/ana.410430307. [DOI] [PMC free article] [PubMed] [Google Scholar]
- 8.Small GW, Ercoli LM, Silverman DH, et al. Cerebral metabolic and cognitive decline in persons at genetic risk for Alzheimer's disease. Proc Natl Acad Sci USA. 2000;87:6037–42. doi: 10.1073/pnas.090106797. [DOI] [PMC free article] [PubMed] [Google Scholar]
- 9.Du AT, Schuff N, Zhu XP, et al. Atrophy rates of entorhinal cortex in AD and normal aging. Neurology. 2003;60:481–486. doi: 10.1212/01.wnl.0000044400.11317.ec. [DOI] [PMC free article] [PubMed] [Google Scholar]
- 10.Rombouts SA, Barkhof F, Witter MP, et al. Unbiased whole-brain analysis of gray matter loss in Alzheimer's disease. Neuroscience Letters. 2000;285:231–233. doi: 10.1016/s0304-3940(00)01067-3. [DOI] [PubMed] [Google Scholar]
- 11.Karas GB, Burton EJ, Rombouts SARB, et al. A comprehensive study of gray matter loss in patients with Alzheimer's disease using optimized voxel-based morphometry. NeuroImage. 2003;18:895–907. doi: 10.1016/s1053-8119(03)00041-7. [DOI] [PubMed] [Google Scholar]
- 12.Studholme C, Cardenas V, Schuff N, et al. Detecting spatially consistent structural differences in Alzheimer's and Fronto Temporal dementia using deformation morphometry. MICCAI 4th Internaltional Conference; Utrecht, The Netherlands: Springer; 2001. [Google Scholar]
- 13.Chetelat G, Desgranges B, de la Sayette V, et al. Mapping gray matter loss with voxel-based morphometry in mild cognitive impairment. Brain Imaging. 2002;13:1939. doi: 10.1097/00001756-200210280-00022. [DOI] [PubMed] [Google Scholar]
- 14.Petersen RC, Kokmen E, Tangalos EG, et al. Mayo Clinic Alzheimer's Disease Patient Registry. Aging. 1990;2:408–415. doi: 10.1007/BF03323961. [DOI] [PubMed] [Google Scholar]
- 15.Petersen RC, Morris J. In: Clinical Features, in Mild Cognitive Impairment: Aging to Alzheimer's Disease. Petersen RC, editor. Oxford University Press; New York: 2003. pp. 15–40. [Google Scholar]
- 16.Petersen RC, Smith GE, Waring SC, et al. Mild cognitive impairment clinical characterization and outcome. Arch Neurol. 1999;56:303–308. doi: 10.1001/archneur.56.3.303. [DOI] [PubMed] [Google Scholar]
- 17.Petersen RC, Smith GE, Waring SC, et al. Aging, memory, and mild cognitive impairment. International Psychogeriatrics. 1997;9:65–69. doi: 10.1017/s1041610297004717. [DOI] [PubMed] [Google Scholar]
- 18.Smith GE, Petersen RC, Parisi JE, et al. Definition, course, and outcome of mild cognitive impairment. Aging, Cognition, and Neuropsychology. 1996;3:141–147. [Google Scholar]
- 19.DSM-III-R. Diagnostic and statistical manual of mental disorders. American Psychiatric Association; Washington, D.C.: 1987. [Google Scholar]
- 20.McKhann G, Drachman D, Folstein M, et al. Clinical diagnosis of Alzheimer's disease: report of the NINCDS-ADRDA work group under the auspices of Department of Health and Human Services Task Force on Alzheimer's disease. Neurology. 1984;34:939–944. doi: 10.1212/wnl.34.7.939. [DOI] [PubMed] [Google Scholar]
- 21.Morris JC. The clinical dementia rating (CDR): current version and scoring rules. Neurology. 1993;43:2412–2414. doi: 10.1212/wnl.43.11.2412-a. [DOI] [PubMed] [Google Scholar]
- 22.Jack CR., Jr. MRI-based hippocampal volume measurements in epilepsy. Epilepsia. 1994;35(Suppl 6):S21–S29. doi: 10.1111/j.1528-1157.1994.tb05986.x. [DOI] [PubMed] [Google Scholar]
- 23.Jack CR, Jr., Petersen RC, Xu YC, et al. Medial temporal atrophy on MRI in normal aging and very mild Alzheimer's disease. Neurology. 1997;49:786–794. doi: 10.1212/wnl.49.3.786. [DOI] [PMC free article] [PubMed] [Google Scholar]
- 24.Xu Y, Jack C, Jr., O'Brien PC, et al. Usefulness of MRI measures of entorhinal cortex vs hippocampus in AD. Neurology. 2000;54:1760–1767. doi: 10.1212/wnl.54.9.1760. [DOI] [PubMed] [Google Scholar]
- 25.Insausti R, Juottonen K, Soininen H, et al. MR volumetric analysis of the human entorhinal, perirhinal, and temporopolar cortices. AJNR. 1998;19:659–671. [PMC free article] [PubMed] [Google Scholar]
- 26.Killiany RJ, Moss MB, Albert MS, et al. Temporal lobe regions on magnetic resonance imaging identify patients with early Alzheimer's disease. Arch Neurol. 1993;50:949–954. doi: 10.1001/archneur.1993.00540090052010. [DOI] [PubMed] [Google Scholar]
- 27.Gunter JL, Shiung MM, Manduca A, et al. Methodological considerations for measuring rates of brain atrophy. JMRI. 2003;18:16–24. doi: 10.1002/jmri.10325. [DOI] [PMC free article] [PubMed] [Google Scholar]
- 28.Smith SM, Zhang Y, Jenkinson M, et al. Accurate, robust, and automated longitudinal and cross-sectional brain change analysis. NeuroImage. 2002;17:479–489. doi: 10.1006/nimg.2002.1040. [DOI] [PubMed] [Google Scholar]
- 29.Freeborough PA, Fox NC. The boundary shift integral: an accurate and robust measure of cerebral volume changes from registered repeat MRI. IEEE Trans on Medical Imaging. 1997;15:623–629. doi: 10.1109/42.640753. [DOI] [PubMed] [Google Scholar]
- 30.Mattis S. In: Mental Status Examination for Organic Mental Syndromes in the Elderly Patient, in Geriatric Psychiatry. Bellak Karasu TE., 1, editor. Grune and Stratton; New York: 1976. [Google Scholar]
- 31.Rey A. L'examen Clinique en Psychologie. Presses Universitaires de Frances; Paris: 1964. [Google Scholar]
- 32.Wechsler D. Wechsler Memory Scale-Revised. Psychological Corp; New York, NY: 1987. [Google Scholar]
- 33.Petersen RC, Waring SC, Smith GE, et al. Predictive value of APOE genotyping in incipient Alzheimer's Disease. Annals of the New York Academy of Sciences. 1996;802:58–69. doi: 10.1111/j.1749-6632.1996.tb32599.x. [DOI] [PubMed] [Google Scholar]
- 34.Jack CR, Jr., Petersen RC, Xu Y, et al. Rates of Hippocampal Atrophy in Normal Aging, Mild Cognitive Impairment, and Alzheimer's Disease. Neurology. 2000;55:484–489. doi: 10.1212/wnl.55.4.484. [DOI] [PMC free article] [PubMed] [Google Scholar]
- 35.Choi S. Tests of equality of dependent correlation coefficients. Biometrika. 1977;64:645–7. [Google Scholar]
- 36.Braak H, Braak E. Morphological criteria for the recognition of Alzheimer's disease and the distribution pattern of cortical changes related to this disorder. Neurobiology of Aging. 1994;15:355–356. doi: 10.1016/0197-4580(94)90032-9. [DOI] [PubMed] [Google Scholar]
- 37.Killiany RJ, Hyman BT, Gopmez-Isla T, et al. MRI measures of entorhinal cortex vs hippocampus in preclinical AD. Neurology. 2002;58:1188–1196. doi: 10.1212/wnl.58.8.1188. [DOI] [PubMed] [Google Scholar]
- 38.Killiany R, Gomez-Isla T, Moss M, et al. Use of structural magnetic resonance imaging to predict who will get Alzheimer's disease. Ann Neurol. 2000;47:430–439. [PubMed] [Google Scholar]
- 39.Dickerson BC, Goncharova I, Sullivan MP, et al. MRI-derived entorhinal and hippocampal atrophy in incipient and very mild Alzheimer's disease. Neurobiology of Aging. 2001;22:747–754. doi: 10.1016/s0197-4580(01)00271-8. [DOI] [PubMed] [Google Scholar]
- 40.Visser PJ, Scheltens P, Verhey FRJ, et al. Medial temporal lobe atrophy and memory dysfunction as predictors for dementia in subjects with mild cognitive impairment. J Neurology. 1999;246:477–485. doi: 10.1007/s004150050387. [DOI] [PubMed] [Google Scholar]
- 41.Jack CR, Jr., Petersen RC, Xu Y, et al. Prediction of AD with MRI-based hippocampal volume in mild cognitive impairment. Neurology. 1999;52:1397–1403. doi: 10.1212/wnl.52.7.1397. [DOI] [PMC free article] [PubMed] [Google Scholar]
- 42.Schott JM, Fox NC, Frost C, et al. Assessing the onset of structural change in familial Alzheimer's disease. Ann Neurol. 2003;53:181–188. doi: 10.1002/ana.10424. [DOI] [PubMed] [Google Scholar]