Abstract
Diets that are high in dietary fiber are reported to have substantial health benefits. We sought to compare the metabolic effects for three types of dietary fibers, i.e. sugar cane fiber (SCF), psyllium (PSY) and cellulose (CEL) on body weight, carbohydrate metabolism and stomach ghrelin gene expression in a high-fat diet fed mouse model. Thirty-six male mice (C57BL/6) were randomly divided into four groups that consumed high fat-diets or high fat diet containing 10% SCF, PSY, and CEL respectively. After baseline measurements were assessed for body weight, plasma insulin, glucose, leptin and glucagon-like peptide-1 (GLP-1), animals were treated for 12 weeks. Parameters were re-evaluated at end of study. Whereas there was no difference at the baseline, body weight gains in the PSY and SCF groups were significantly lower than in CEL group at end of study, No difference in body weight was observed between the PSY and SCF animals. Body composition analysis demonstrated that fat mass in the SCF group was considerably lower than in the CEL and HFD groups. In addition, fasting plasma glucose and insulin and areas under curve of IPGTT were also significantly lower in the SCF and PSY groups than in the CEL and HFD groups. Moreover, fasting plasma concentrations of leptin were significantly lower and GLP-1 level was two-fold higher in the SCF and PSY mice than in the HFD and CEL mice. Ghrelin mRNA levels of stomach in SCF groups were significantly lower than in CEL and HFD groups as well. These results suggest differences in response to dietary fiber intake in this animal model as high fat diets incorporating dietary fibers such as SCF and PSY appeared to attenuate weight gain, enhance insulin sensitivity, and modulate leptin and GLP-1 secretion and gastric ghrelin gene expression.
Keywords: Dietary fiber, glucagon-like peptide-1, leptin, ghrelin, obesity, insulin resistant
Introduction
Numerous studies have examined the effects of macronutrients, i.e. dietary fat, protein, and carbohydrates on energy intake, but studies assessing the role of dietary fiber on this process are more limited (1). Fiber is not considered an essential nutrient, but may play a role in modulation of energy intake, and in this regard, has been suggested to lower risk for developing obesity (2). Dietary fibers, i.e. the indigestible portion of plant foods, can be broadly classified as being either “soluble” or “insoluble” and “fermentable” or “non-fermentable”. Chemically, dietary fiber consists of non-starch polysaccharides and several plant components such as cellulose, lignin, waxes, chitins, pectins, beta-glucans, inulin, and oligosaccharides. These fiber components have unique chemical structures and characteristic physical properties, e.g. bulk/volume, viscosity, water-holding capacity, adsorption/binding, or fermentability, which determine their subsequent physiologic behavior.
The American Dietetic Association (ADA) recommends a minimum of 20–35 g/day for a healthy adult (3), whereas the average American diet barely contains half this amount e.g., 10–15 grams daily (4). There have been reports demonstrating significant relationships between lower intake of fiber and obesity, as suggested by epidemiologic and cross-sectional studies (5–7). As such, increased intake of dietary fiber may offer additional health benefits to obese and diabetic patients. For example, dietary fiber supplementation was shown to significantly improve carbohydrate metabolism and insulin sensitivity in overweight and obese women (8). In addition, a high intake of dietary fiber, particularly of the soluble type, improved glycemic control, decreased hyperinsulinemia, and lowered plasma lipid concentrations in patients with type 2 diabetes (9). These benefits of increased dietary fiber intake were also observed in long term studies of rats (10, 11). Other reports suggest additional benefits to human health in delaying the emergence of some types of colon cancers and in regulating glucose and lipid absorption across the gut (12).
As therefore reported, diets consumed that are high in insoluble fiber may aid in glycemic control (13, 14). However, there is a paucity of data comparing diets consisting of preferentially soluble vs insoluble fiber on specific parameters. In addition, there are reports that fiber from specific plants, i.e. bagasse from sugar cane, may affect carbohydrate and lipid metabolism (15). Based on these reports, we sought to determine the effect of diets containing various dietary fiber content (soluble vs insoluble) on weight gain and parameters assessing carbohydrate metabolism. Specifically, we compared diets containing primarily insoluble fiber, i.e. purified cellulose or soluble fiber, i.e. psyllium and compared those to diets primarily containing fiber from sugar cane. In addition to assessing weight and clinical measures of carbohydrate metabolism, we sought to determine if specific mechanisms were altered with the varying dietary regimen, As such, we evaluated specific biochemical markers of leptin, GLP-1 and gastric gene expression between the various dietary regimens.,
Study Design and Methods
Study Design
Thirty six male 4-week-old C57BL/6 mice were obtained from the Jackson Laboratory (Bar Harbor, ME). After arrival, the animals were housed as one per cage with ad libitum access to rodent chow and water for a two week acclimation period under specific pathogen-free conditions and 12-hour light-dark cycle. Animals were then randomly divided into 4 treatment groups that consisted of a high-fat diet alone (HFD), high fat diet containing 10% (w/w) of cellulose (CEL), high fat diet containing 10% (w/w) of psyllium (PSY), or high fat diet containing 10% (w/w) of sugar cane fiber (SCY) for 12-weeks. High fat diet was purchased from Research Diets Co (D-12331, New Brunswick, NJ) and contained 58% of energy from fat. The specific HFD used has been well documented to induce obesity and insulin resistance in the animal model (16). The components and energy density of these diets are demonstrated in Table 1. Body weight and food intake were measured weekly. In addition, body composition and measures assessing carbohydrate metabolism were assessed at end of study. At the end of the study, overnight fasted mice were euthanized. Plasma, stomach and other tissues were quickly put into liquid nitrogen container and stored at −80°C for later analysis. The Institutional Animal Care and Use Committee of Pennington Biomedical Research Center approved all animal protocols.
TABLE 1.
Diet composition and energy density of four high-fat diets with or without adding 10 % of dietary fibers (Mean + SEM).
| HFD | 10% CEL | 10% PSY | 10% SCF | |
|---|---|---|---|---|
| Casein, 80 Mesh | 228 | 205.2 | 205.2 | 205.2 |
| DL-Methionine | 2 | 1.8 | 1.8 | 1.8 |
| Maltodextrin 10 | 170 | 153 | 153 | 153 |
| Sucrose | 175 | 157.5 | 157.5 | 157.5 |
| Soybean oil | 25 | 22.5 | 22.5 | 22.5 |
| Coconut oil, hydrogenated | 333.5 | 300.1 | 300.1 | 300.1 |
| Mineal mix S10001 | 40 | 36 | 36 | 36 |
| Sodium bicarbonate | 10.5 | 9.45 | 9.45 | 9.45 |
| Potassium citrate | 4 | 3.6 | 3.6 | 3.6 |
| Vitamin mix V10001 | 10 | 9 | 9 | 9 |
| Choline bitartrate | 2 | 1.8 | 1.8 | 1.8 |
| Fiber (carbohydrate gm) | 0 | 100 (8.7) | 100(18.4) | 100 (32.5) |
| Insoluble (%) | 0 | 99.5 | 58 | 86 |
| Soluble (%) | 0 | 0.5 | 42 | 14 |
| Energy (kcal/kg) | 5558.5 | 5037.5 | 5058.5 | 5132.7 |
|
| ||||
| Energy from fat (%) | 58 | 52.2 | 52.2 | 52.2 |
Source of Dietary Fibers
Psyllium husk powder (PSY) was obtained from Source Naturals, Inc (Scotts Valley, CA). Dietary fiber cellulose powder (CEL) was obtained from NutriCology, Inc (Hayward, CA). Sugar cane fiber (SCF) was obtained and purified under the direction of Dr. Lian at the Center for Advanced Microstructures and Devices (CAMD) at Louisiana State University. A proprietary method has been used to reduce sugarcane bagasse fiber to a micrometer-sized and nanometer-sized particles (the ratio can be changed by change the processing parameters). Bagasse fiber was cooled to cryogenic temperature, and then the bagasse was mechanically pulverized into small particles, from few nanometers to hundreds micrometers. During the pulverization process, chemical oxidation of bagasse was prevented by the cooler temperature. During the whole processing, no chemical and no other artificial preservative was used. This processing technology maintains the integrity of the constituents of original bagasse, which usually contains 46 % cellulose, 24.5 % hemicellulose, 19.95 % lignin, 3.45 % fats and waxes, 2.4 % ash, 2.0 % silicon, pulsing 1.70 % other substances of weight.
Blood Chemistry and Hormone Analysis
After 4 hours fasting, blood samples were collected from orbital sinus of unconscious mice induced by inhalation of CO2. Plasma glucose level was measured by a colorimetric hexokinase glucose assay (Sigma Diagnostics, St. Louis, MO). Plasma insulin level was determined by ultra sensitive rat insulin ELISA kit from Crystal Chem Inc (Downers Grove, IL). Plasma leptin was determined using Mouse Serum Adipokine LINCOlex Kit (Cat # MADPK-71K) and plasma GLP-1 concentration was measured by GLP-1 (active) ELISA kit (Cat# EGLP-35k, LINCO Research) according to the manufacturer’s instructions. All assays were done in duplicate.
Body Composition Measurement
Body composition for all animals was measured by the nuclear magnetic resonance (NMR) (17). Total fat mass (FM) and free fat mass (FFM) were recorded.
Assessment of Carbohydrate Metabolism
The effect of the diets on insulin and glucose parameters were determined with use of an intraperitoneal glucose tolerance test (IPGTT) and insulin tolerance test (IPITT) obtained at week 11 and week 12 of the study respectively. After an overnight fast, IPGTT was performed by intraperitoneal injection of 2 g glucose (20% glucose in 0.9% NaCL) per kilogram body weight and blood glucose was measured at the designated times as described below (18). For IPITT, an intraperitoneal injection human insulin (Eli Lilly Co, IN) at dose of 0.75 U/kg body weight of was administered after 4 hr fasting. Whole blood glucose was measured from the tail vein at 0, 30, 60, 90 and 120 min after injections for both IPGTT and IPITT using the FreeStyle blood glucose monitoring system (TheraSense, Phoenix, AZ).
Quantitative RT-PCR Procedure
Total RNA was extracted from gastric tissues using TRIzol Reagent (Invitrogen Corp). RNA analysis and quantitation were performed with RNA 6000 Nano LabChip kit (Agilent Technologies, Foster City, CA).
Amplification of mouse ghrelin was performed with the one step (Brilliant QRT-PCR master mix kit (Cat # 60055, Stratagene) and cyclophilin B mRNA was measured by SYBR Green QPCR master kit (Cat # 600548, Stratagene) according to the manufacturer’s protocol. After each run, a relative quantification of the amplified PCR product in the different samples was measured. A standard curve was used to obtain the relative concentration of the target gene, and the results were corrected according to the concentration of cyclophilin B. The results were expressed as percent of HFD group, setting the mean of the control group at 100% and then calculating each individual value of the rest 3 groups of animals studied. TaqMan primer-probe sets of mouse ghrelin (NM_01190296, Cat # 445046) were purchased from Applied Biosystems (Foster City, CA). Primers for mouse cyclophilin B were designed by using PRIMER EXPRESS software (Applied Biosystems). The target gene primer pairs are as follows: for mouse cyclophilin (NM_011149), Forward, 5′-TGGAGAGCACCAAGACA-GACA-3′ and Reverse, 5′-GTCGACAATGATGACATCCTTCA-3′. These were obtained from Integrated DNA Technologies, Inc. (Coralville, LA).
Statistical Analysis
All data were expressed as mean ± standard error of mean (SEM). Data were evaluated for statistical significance by two-way ANOVA, and P<0.05 was considered significant.
Results
Food Intake
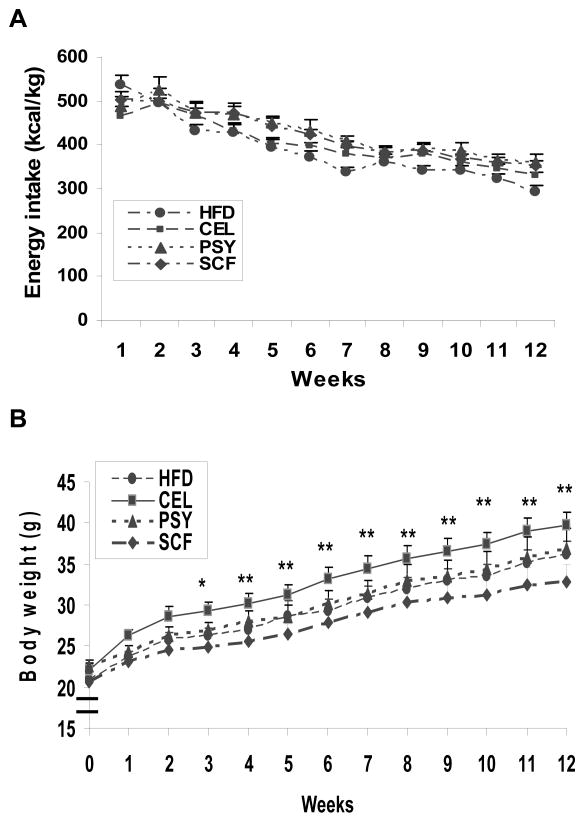
Energy intake (kcal/kg), normalized by body weight, was not shown to differ among groups (Figure 1A). The average energy intake in all groups expressed per unit body weight was reduced by about 35 percent at the end of the study when comparison with baseline (Figure 1A).
FIGURE 1.
Energy intake, body weight gain and body compositions in the high-fat diet fed mice with and without supplementation of dietary fibers. Figure 1. A demonstrates energy intake expressed as kcal/kg body weight for 12 weeks. Figure 1. B shows effects of dietary fibers on body weight gain. *P<0.05 and **P<0.01. Mean ± SEM, PSY and SCF vs HFD and CEL respectively (n=9 mice for each group).
Body Weight and Body Composition
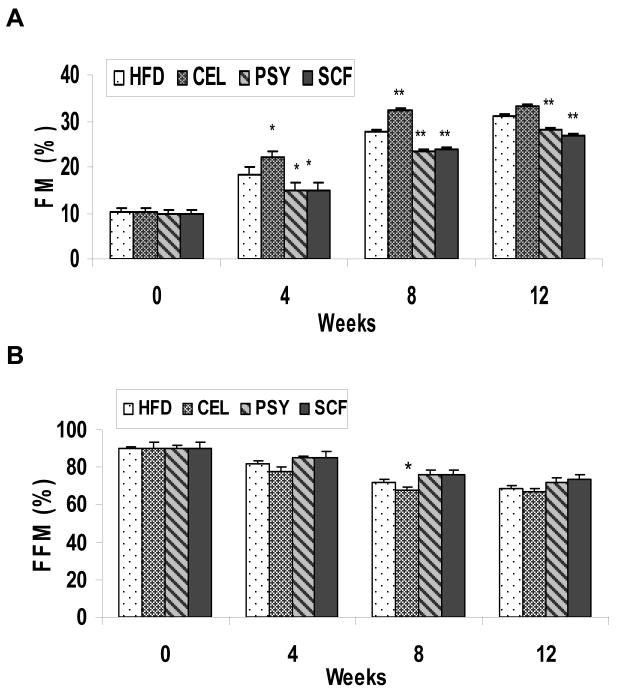
There was no difference in body weight or body composition between the four groups at baseline. Beginning at week 3, the body weights of the SCF and the PSY groups were observed to be lower than in the CEL group (P<0.01 and P<0.05 respectively) and this trend continued to the end of study (Figure 1B). At end of study, the net body weight gain (mean ± SEM) was 12.4 ± 1.03 g for the SCF group, 14.38± 0.88g for HFD alone, 14.4 ± 1.6 g in the PSY group, and 16.7 ± 1.3 g in the CEL groups respectively. The net body weight gains in the SCF, in the HFD and the PSY groups were significantly less than in the CEL group (P<0.01, P<0.05 and P<0.05) respectively. There were no significant differences of body weight among the SCF, HFD and PSY animals. Body composition analysis showed that fat mass (FM) of SCF and PSY groups were significantly lower than that of the CEL group (P<0.05), but there were no significant differences between HFD and PSY groups (Figure 2A). The free fat mass (FFM) in all groups was not significantly different (Figure 2B) except for the CEL group at week 8 (P<0.05) when comparison with HFD group.
FIGURE 2.
Panel A and B show effects of CEL, PSY and SCF on body composition of fat mass (FM) and free fat mass (FFM) in high-fat diet fed animals respectively. *P<0.05 and **P<0.01. Mean ± SEM, PSY and SCF vs HFD and CEL respectively.
Glucose and Insulin Levels
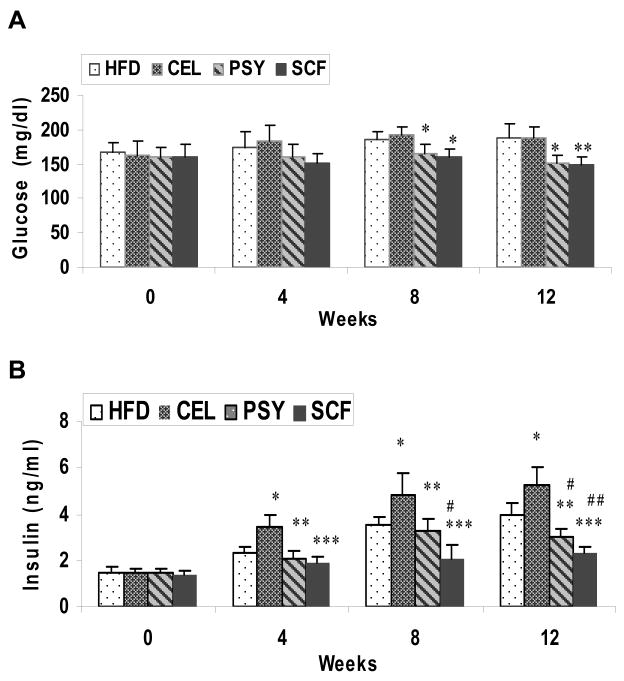
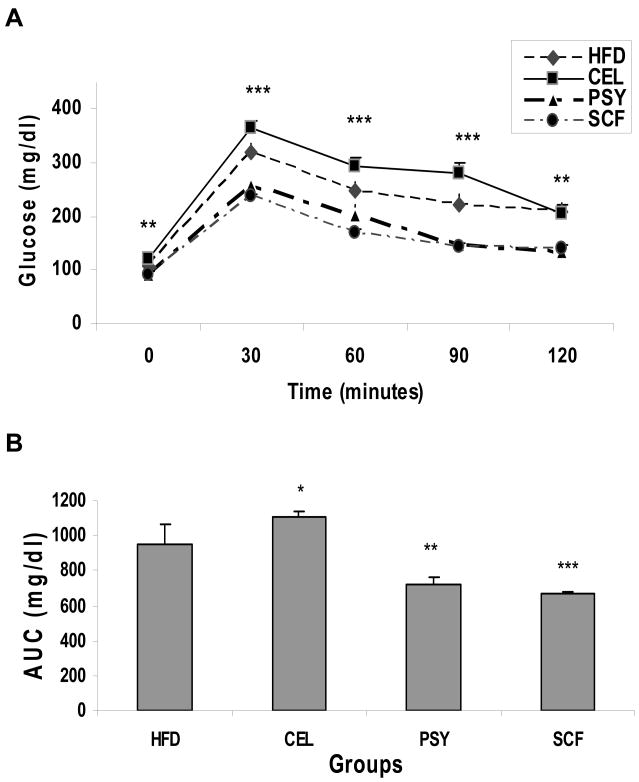
Fasting glucose levels were significantly lower in PSY and SCF group than in the CEL and HFD groups beginning at 8 weeks and continuing to end of study (Figure 3A). Fasting plasma insulin was much lower in PSY and SCF groups than in the CEL group from week 4 and maintained to the end of the study (P<0.05 and P<0.01 respectively). However, insulin concentration in CEL was significantly higher than in HFD group from week 4 to week 12. Insulin level substantially lower in SCF than in HFD group and there was no difference between PSY and HFD groups (Figure 3B). IPGTT data showed glucose concentrations were much lower in PSY and SCF groups than in control and CEL groups (P<0.01 and P<0.001 respectively, Figure. 4A). Area under curve for glucose during the IPGTT was 945 ±115 in HFD, 1101 ± 36 in CEL, 724 ± 39 in PSY and 667 ± 24 mg/dl in SCF groups. IPITT results in these groups showed a similar trend (Figure. 4B).
FIGURE 3.
Effect of dietary fiber supplementation on fasting plasma glucose and insulin concentrations in high-fat diet fed mice for 12 weeks. Blood samples were collected at week 0 and every 4 weeks after 4 hour fasting. Panel A shows plasma glucose levels in all four groups. Panel B illustrates plasma insulin concentrations in the mice. Data are presented as mean ± SEM. * P<0.05, and ** <0.01. PSY and SCF vs CEL group. #P<0.05, ## P<0.01 CEL, PSY and SCF vs HFD group respectively.
FIGURE 4.
Effects of dietary fibers and high-fat diet on IPGTT and IPITT in mice. IPGTT was done after overnight fasting as described in the methods and illustrated in the Panel A. IPITT was performed after 4 hr fasting, the area under curve (AUC) of IPITT is showed in the panel B. *P<0.05, ** P<0.01 and *** P<0.001 respectively. Mean ± SEM, SCF and PSY vs HFD or CEL groups respectively.
Stomach Ghrelin Gene Expression Analysis
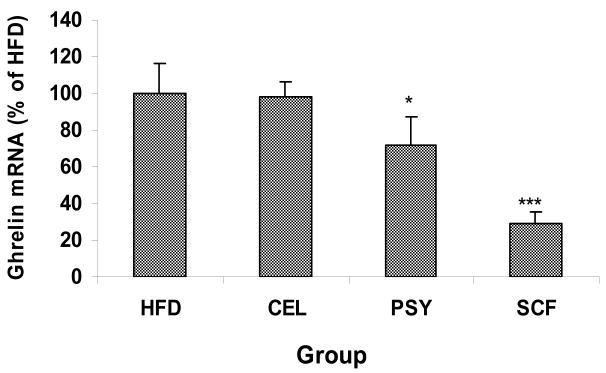
Stomach ghrelin mRNA levels were not statistically different between HFD and CEL groups. However, ghrelin gene expression in the PSY and the SCF fed animals were significantly lower than in the HFD and CEL animals (P<0.05 and 0.001 respectively) as showed in Figure 5.
FIGURE 5.
Stomach ghrelin gene expression in the high fat fed mice with or without dietary fiber supplementation. Stomach ghrelin was measured by real time RT-PCR in triplicate and results were normalized by β-Actin. Data are presented as Mean ± SEM, *<0.05 and *** P<0.001. PSY and SCF vs HFD group.
Effect of high fat diet and dietary fiber supplementation on plasma Leptin concentration in mice
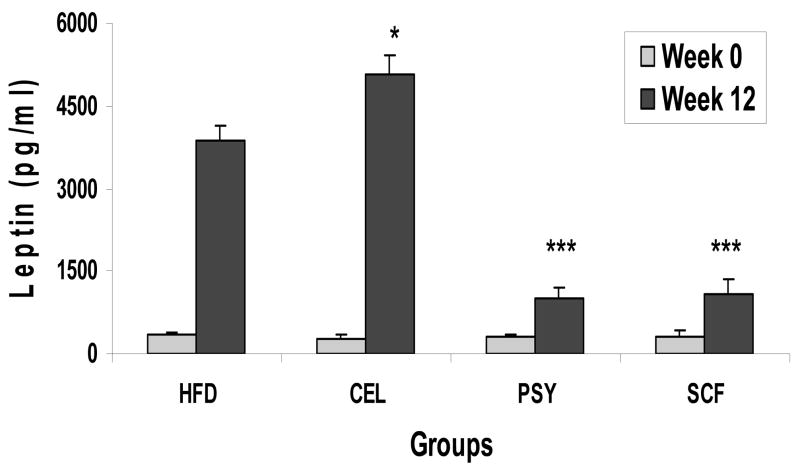
At baseline, there was no difference of plasma leptin level among the all groups. At week 12, leptin levels increased from basal 358± 38 to 3871 ± 279 pg/ml in the HFD, from 286 ± 64 to 5054 ± 370pg/ml in the CEL, from 309 ± 42 to 1020 ± 196 pg/ml in the PSY and from 319 ± 62 to 1097 ± 256 pg/ml in the SCF group respectively. Plasma leptin concentrations were significantly lower in the SCF and PSY groups than in the CEL and HFD group (Mean ± SEM, P<0.001, Figure 6). However, leptin level of week 12 in CEL group was greatly higher than in HFD group (P<0.05).
FIGURE 6.
Effect of dietary fiber on plasma leptin levels. Fasting plasma leptin was measured at week 0 and week 12 in all groups. Data are presented as Mean ± SEM, *<0.05, *** P<0.001. CEL, PSY or SCF group vs HFD group.
High fat diet and dietary fiber affect plasma GLP-1 level
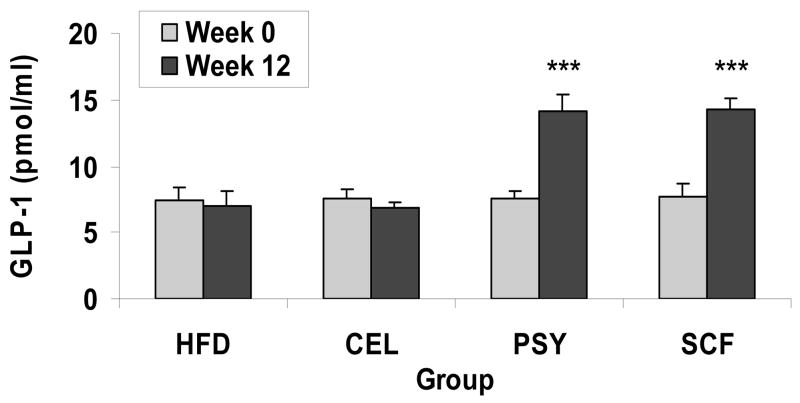
There was no difference in fasting plasma GLP-1 concentrations between groups at week 0. After 12 week feeding, GLP-1 levels slightly decreased in HFD and CEL groups (−4.5% and −8.9% respectively), and significantly increased in PSY and SCF groups (+85% and +87.7 % respectively, P<0.001), (Figure 7).
FIGURE 7.
Effect of dietary fibers on fasting plasma GLP-1 concentrations. Fasting plasma GLP-1 was determined by GLP-1 ELISA kit at week 0 and week 12 of dietary fiber supplementation in the mice. Data presented as Mean ± SEM, *** P<0.001. SCF or PSY group vs CEL or HFD group respectively.
Discussion
We demonstrated that diets containing identical fiber content (10% content in the case of this study), but differing in quantity of soluble vs insoluble fiber, may have different effects on body weight gain and carbohydrate metabolism. Specifically, the data suggest that high-fat diets containing a larger percentage of soluble fiber, such as provided in the diet with sugar cane fiber or psyllium, resulted in lower glucose and insulin levels in this animal model. Specifically, fasting plasma glucose and insulin levels during the study were observed to be significantly lower in the SCF and PSY groups than in the CEL groups. The mechanism is not precisely known, but a contributing factor may be altering the rate of glucose absorption in the gut. Dietary fiber, particularly soluble fiber found in barley and oats, may slow digestion and absorption of carbohydrates and hence lower blood glucose and insulin levels (19). The body composition analysis also revealed that diets incorporating these two fibers, as opposed to cellulose, appeared to cane fiber as observed in this study confirmed reports of lower fasting glucose that was reported in streptozotocin-induced diabetic rats fed a diet containing 5% fiber (bagasse) when compared to control rats. Plasma glucagon levels were decreased in bagasse and significantly increased in the control animals, whereas plasma insulin levels were not changed in these groups (20). However, in that study, body weight gain was greater for the sugar cane fiber as opposed to the results observed in this study.
In addition to the weight and carbohydrate parameters, several biochemical parameters, such as ghrelin and GlP-1 levels, were altered in the diets containing primarily sugar cane fiber or psyllium. The reasons for evaluating these parameters were based on the hypothesis that dietary modifications may modulate these regulatory systems. Ghrelin is an endogenous ligand for the growth hormone secretagogue receptor (GHSR). Accumulating evidence has suggested that ghrelin may play a role in signaling and reversing states of energy insufficiency. Ghrelin levels raise following food deprivation, and ghrelin administration stimulates feeding and increases body weight and adiposity (21, 22). Glucagon-like peptide (GLP-1) is secreted from enteroendocrine L cells, which are localized in the distal ileum and colon (23). GLP-1 acts through a specific G-protein-coupled receptor to potently stimulate glucose-dependent insulin secretion (24). GLP-1 further reduces hyperglycemia through inhibition of both glucagon secretion and gastric emptying (25–27). Our data therefore suggest that diets varying in dietary fiber content may potentially modulate these systems.
It has been suggested that high fiber foods may increase gastric distension and promote sensations of fullness (28), but clearly if that is contributing factor, that doesn’t explain the differences in weight gain observed with diets containing equal amount of fiber, but differing in the amount of insoluble vs soluble fiber as evaluated in this study. The degree of fermentation has been suggested to influence the effects resulting from ingestion of dietary fiber. Dietary fiber, once ingested, is fermented by bacteria in the colon, producing short chain fatty acids (SCFA), e.g. including acetate, propionate and butyrate and gases. Butyrate may be an important source of energy for the cells of the colon. Wheat bran and oat bran have been reported to produce higher proportions of butyrate (29). Also, the physical form of the grain or seed determines whether dietary fiber is fermented. For example, lignin and phenolic acids in the cell wells of the grain kernel may restrict access to bacteria and hence limit fermentation of dietary fiber. It has demonstrated that molecular weight of guar gum affects short-chain fatty acid profile in model intestinal fermentation (30).
Observations suggest that ghrelin-responsive pathways are an important component of coordinated body weight control. For example, when fed a high-fat diet, both female and male GHSR-null mice eat less food, store less of their consumed calories, preferentially utilize fat as an energy substrate and accumulate less body weight and adiposity than control mice (31). Similar effects on body weight and adiposity were also observed in female, but not male, GHSR-null mice fed standard chow. Moreover, it suggests that ghrelin signaling is required for development of the full phenotype of diet-induced obesity (32). Our data suggested that high fat diets containing 10% of either the sugar cane fiber or psyllium significantly lowered stomach ghrelin mRNA levels when compared to high fat diets alone or containing 10% cellulose. The mechanism by which this may occur is not known.
Leptin resistance is defined as decreased sensitivity to the anorexigenic or weight loss effects of leptin. Rodents with diet-induced obesity (33) and most obese humans are resistant to the effects of leptin (34). Obesity in humans is associated with hyperleptinemia, and increased adiposity is believed to link to development of leptin resistance (35). Leptin is reported to induce hepatic leptin resistance in diet-induced obesity by impairing the activation of phosphatidylinositol 3-kinase(36). Other reports suggest that that high-fat diets may induce leptin resistance (37). Long-term consumption of the high-fat diet increased fat cell size and plasma leptin concentration. Leptin is reported to be released from adipose tissue 60–120 min postprandially (38). However, it has been demonstrated that leptin is also synthesized by the gastric chief cells and release of gastric leptin occurs 15 min after refeeding in fasted rat (39). A high-fat sucrose (HFS) diet resulted in hyperleptinemia and hyperinsulinemia before adipocyte size was observed to increase (40). It was interesting to note in this study that high fat diets containing primarily sugar cane and psyllium resulted in lower plasma leptin concentrations when compared to the high-fat diet alone or high fat diet containing 10% cellulose. An interesting question regarding the mechanism, therefore, would be whether the processing of the dietary fiber, i.e. degree of fermentation and production of short-chain fatty acids, had a direct effect on leptin production as suggested by other reports (41) or whether an unrelated mechanism was responsible. Currently, this is not precisely known.
The regulatory effect of GLP-1 on energy intake has been well studied. For example, central GLP-1 administration reduces food intake in rodents, whereas peripheral administration of GLP-1 promotes satiety and decreases body weight in humans (23–27). Our observations suggesting that dietary fiber may modulate GLP-1 levels are intriguing, but once again, the mechanism is not known. However, modulation GLP-1 may again be secondary to gut processing of the fiber. For example, it has been reported that the short chain fatty acid butyrate can increase gene expression of proglucagon (the gene encodes GLP-1) in a dose-dependent manner in vitro (42). Elevated GLP-1 may also result in putative satiety signals (43). It has also been suggested that leptin stimulates GLP-1 secretion from enteroendocrine L cells in vitro and in vivo (44). C57BL/6 mice on the high-fat diet (45%) for 8 weeks became obese, developed glucose intolerance, hyperinsulinemia, and hyperleptinemia, and were leptin resistant. Mice on the high-fat diet also had twofold lower basal plasma GLP-1 and a diminished GLP-1 response to oral glucose comparison with low fat fed mice. Other reports suggest that leptin resistance in obese C57BL/6 mice is associated with impaired secretion of GLP-1 (45). The increase in leptin observed in high-fat diet fed animal models was associated with elevated plasma insulin levels and was closely correlated with fat cell hypertrophy, but unrelated to energy intake or markers of energy expenditure (2, 46). Finally, other reports suggest that peripheral GLP-1 plays a role in the regulation of macronutrient selection as well as food intake in rats (47).
An interesting question regarding the results of the study is whether the viscosity of the sugar cane fiber was responsible for the observations. Each fiber was provided as part of the diet, so the specific viscosity as it pertains to what occurred in the gastrointestinal environment is not known. In addition, we did not assess viscosity of the fibers individually. It may well be that the viscosity of sugar cane fiber is higher than cellulose, and may be lower than psyllium, We did measure the percent of soluble fiber in sugar cane fiber and it was observed to be higher than cellulose and lower than psyllium (See Table 1). Viscosity of the diet and fiber may delay gastric emptying. However, it is not generally agreed that the distention may reduce gastric mRNA ghrelin concentration and reduce small intestinal GLP-1 secretion. For example, it is reported that distension and chemosensitization of the stomach are insufficient to induce a ghrelin response, suggesting that postgastric feedback is required. This is suggested to be regulated through insulin (48, 49). It is also reported that fermentable fibers such as fructans, which are rapidly and extensively fermented in the proximal part of the colon may potentially modulate of GLP-1 (7–36) amide and ghrelin (50).
In summary, our data have demonstrated that mice fed a high-fat diet containing dietary fibers in the form of either sugar cane fiber or psyllium had effects to improve glucose levels, lower insulin and attenuate weight gain in a model of dietary induced obesity when compared to high fat diets alone or high fat diets supplemented with cellulose. The data reveal that the characteristics of the fiber, i.e. soluble vs insoluble, clearly played a role. The mechanism by which this occurred, and specifically the mechanism by which lowered GLP-1 was induced and gene expression of ghrelin was modulated is not currently known. Although the mechanism is not precisely known, the data suggest that the fiber intake may inhibit high fat diet induced leptin secretion and gastric ghrelin gene expression as well as elevating GLP-1 concentration. The study of potential cellular signaling mechanisms induced by altering intake of dietary fibers is currently the focus of ongoing studies.
Acknowledgments
The authors thank Dr. Jennifer Rood, Jamie Tuminello, Zhiqua Gao, and Jun Zhou for excellent technical assistance. We also thank Nicole Mestayer for assistance in manuscript preparation.
Supported in part by Pilot funding from the Nutrition and Chronic Disease Division and American Sugar Cane League awarded to ZQW and by NIH P50AT002776-01 from the National Center for Complementary and Alternative Medicine (NCCAM) and the Office of Dietary Supplements (ODS)
Footnotes
Publisher's Disclaimer: This is a PDF file of an unedited manuscript that has been accepted for publication. As a service to our customers we are providing this early version of the manuscript. The manuscript will undergo copyediting, typesetting, and review of the resulting proof before it is published in its final citable form. Please note that during the production process errors may be discovered which could affect the content, and all legal disclaimers that apply to the journal pertain.
References
- 1.Roberts SB, McCrory MA, Saltzman E. The influence of dietary composition on energy intake and body weight. J Amer College Nutrition. 2002;21:140S–145S. doi: 10.1080/07315724.2002.10719211. [DOI] [PubMed] [Google Scholar]
- 2.Howarth NC, Saltzman E, Robers SB. Dietary fiber and weight regulation. Nutr Rev. 2001;59:163–169. doi: 10.1111/j.1753-4887.2001.tb07001.x. [DOI] [PubMed] [Google Scholar]
- 3.Marlett JA, McBurney MI, Slavin JL. Position of the American Dietetic Association: health implications of dietary fiber. J Am Diet Assoc. 2002;102:993–1000. doi: 10.1016/s0002-8223(02)90228-2. [DOI] [PubMed] [Google Scholar]
- 4.Albertson AM, Tobelmann RC. Consumption of grain and whole-grain foods by an American population during the years 1990 to 1992. J Am Diet Assoc. 1995;95:703–704. doi: 10.1016/S0002-8223(95)00194-8. [DOI] [PubMed] [Google Scholar]
- 5.Alfieri MA, Pomerleau J, Grace DM, Anderson L. Fiber intake of normal weight, moderately obese and severely obese subjects. Obes Res. 1995;3:541–547. doi: 10.1002/j.1550-8528.1995.tb00188.x. [DOI] [PubMed] [Google Scholar]
- 6.Van Itallie TB. Dietary fiber and obesity. Am J Clin Nutr. 1978;31(Suppl):S43–S52. doi: 10.1093/ajcn/31.10.S43. [DOI] [PubMed] [Google Scholar]
- 7.Burkitt DP, Trowell HC. Refined carbohydrate food and disease. Academic Press: London, UK; 1975. pp. 333–345. [Google Scholar]
- 8.Weickert MO, MoHlig M, Schofl C, Otto B, Viehoff H, Koebnick C, Kohl A, Spranger J, Pfeiffer AFH. Cereal fiber improves whole body insulin sensitivity in overweight and obese women. Diabetes Care. 2006;29:775–780. doi: 10.2337/diacare.29.04.06.dc05-2374. [DOI] [PubMed] [Google Scholar]
- 9.Chandalia M, Garg A, Lutjohann D, von Bergmann K, Grundy SM, Brinkley LJ. Beneficial effects of high dietary fiber intake in patients with type 2 diabetes mellitus. N Engl J Med. 2000;342:1440–1. doi: 10.1056/NEJM200005113421903. [DOI] [PubMed] [Google Scholar]
- 10.Li J, Kaneko T, Qin LQ, Wang J, Wang Y, Sato A. Long-term effects of high dietary fiber intake on glucose tolerance and lipid metabolism in GK rats: comparison among barley, rice, and cornstarch. Metabolism. 2003;52:1206–10. doi: 10.1016/s0026-0495(03)00159-8. [DOI] [PubMed] [Google Scholar]
- 11.Hozumi T, Yoshida M, Ishida Y, Mimoto H, Sawa J, Doi K, Kazumi T. Long-term effects of dietary fiber supplementation on serum glucose and lipoprotein levels in diabetic rats fed a high cholesterol diet. Endocr J. 1995;42:187–92. doi: 10.1507/endocrj.42.187. [DOI] [PubMed] [Google Scholar]
- 12.Schneeman BO, Tietyen J. Dietary fiber. In: Lea, Febiger, editors. Modern Nutrition in Health and Disease. 8. Philladelphia, PA: 1995. pp. 89–100. [Google Scholar]
- 13.Kimmel SE, Michel KE, Hess RS, Ward CR. Effects of insoluble and soluble dietary fiber on glycemic control in dogs with naturally occurring insulin-dependent diabetes mellitus. J Am Vet Med Assoc. 2000;216:1076–81. doi: 10.2460/javma.2000.216.1076. [DOI] [PubMed] [Google Scholar]
- 14.Mahapatra SC, Bijlani RL, Nayar U. Effect of cellulose and ispaghula husk on fasting blood glucose of developing rats. Indian J Physiol Pharmacol. 1988;32:209–11. [PubMed] [Google Scholar]
- 15.Morgan B, Heald M, Atkin SD, Green J, Chain EB. Dietary fiber and sterol-metabolism in rat. British J Nutrition. 1974;32:447–455. doi: 10.1079/bjn19740096. [DOI] [PubMed] [Google Scholar]
- 16.Collins S. Genetic variation to diet-induced obesity in the C57BL/6J mouse: physiological and molecular characteristics. Physiology and Behavior. 2004;81:243–248. doi: 10.1016/j.physbeh.2004.02.006. [DOI] [PubMed] [Google Scholar]
- 17.Tinsley FC, Taicher GZ, Heiman ML. Evaluation of a quantitative magnetic resonance method for mouse whole body composition analysis. Obese Res. 2004;12:150–160. doi: 10.1038/oby.2004.20. [DOI] [PubMed] [Google Scholar]
- 18.Freeman HC, Hugill A, Dear NT, Ashcroft FM, Cox RD. deletion of nicotinamide nucleotide transhydrogenase A new quantitive trait locus accounting for glucose intolerance in C57BL/6J mice. Diabetes. 2006;55:2153–2156. doi: 10.2337/db06-0358. [DOI] [PubMed] [Google Scholar]
- 19.Jenkins DJ, Wolever TM, Leeds AR, Gassull MA, Haisman P, Dilawari J, Goff DV, Metz GL, Alberti KG. Dietary fibres, fibre analogues, and glucose tolerance: importance of viscosity. Br Med J. 1978;1:1392–1394. doi: 10.1136/bmj.1.6124.1392. [DOI] [PMC free article] [PubMed] [Google Scholar]
- 20.Yamashita S, Yamashita K, Yasuda H, Ogata E. High-fiber diet in the control of diabetes in rats. Endocrinol Jpn. 1980;27(2):169–73. doi: 10.1507/endocrj1954.27.169. [DOI] [PubMed] [Google Scholar]
- 21.Kojima M, Hosoda H, Date Y, Nakazato M, Matsuo H, Kangawa K. Ghrelin is a growth-hormone-releasing acylated peptide from stomach. Nature. 1999;402:656–660. doi: 10.1038/45230. [DOI] [PubMed] [Google Scholar]
- 22.Yoshihara F, Kojima M, Hosoda H, Nakazato M, Kangawa K. Ghrelin: A novel peptide for growth hormone release and feeding regulation. Curr Opin Clin Nutr Metab Care. 2002;5(4):391–5. doi: 10.1097/00075197-200207000-00007. [DOI] [PubMed] [Google Scholar]
- 23.Drucker DJ. Glucagon-like peptide (review) Diabetes. 1998;47:159–169. doi: 10.2337/diab.47.2.159. [DOI] [PubMed] [Google Scholar]
- 24.Weir GC, Mojsov S, Hendrick GK, Habener JF. Glucagonlike peptide 1 (7–36) actions on endocrine panvreas. Diabetes. 1989;38:338–342. doi: 10.2337/diab.38.3.338. [DOI] [PubMed] [Google Scholar]
- 25.Ritzel R, Orskov C, Holst JJ, Nauck MA. Pharmacokinetic, insulinotropic, and glucagonostatic properties of GLP-1 [7–36 amide] after subcutaneous injection in healthy volunteers: dose-response-relationships. Diabetologia. 1995;38:720–725. doi: 10.1007/BF00401846. [DOI] [PubMed] [Google Scholar]
- 26.Schirra J, Katschinski M, Weidmann C, Schafer T, Wank U, Arnold R, Goke B. Gastric empting and release of incretin hormones after glucose ingestion in humans. J Clin Invest. 1996;97:92–103. doi: 10.1172/JCI118411. [DOI] [PMC free article] [PubMed] [Google Scholar]
- 27.Stoffer DA, Kieffer TJ, Hussain MA, Drucker DJ, Bonner-Weir S, Habener JF, Egan JM. Insulinotropic glucagon-like peptide I agonists stimulate expression of homeodomain protein IDX-1 and increase islet size in mouse pancreas. Diabetes. 2000;49:741–748. doi: 10.2337/diabetes.49.5.741. [DOI] [PubMed] [Google Scholar]
- 28.Stanley JC, Lambadarios JA, Newsholme EA. Absence of effects of dietary wheat bran on the activities of some key enzymes of carbohydrate and lipid metabolism in mouse liver and adipose tissue. Br J Nutr. 1986;55:287–294. doi: 10.1079/bjn19860036. [DOI] [PubMed] [Google Scholar]
- 29.Anderson JW, Bridges SR. Short-chain fatty acid fermentation products of plant fiber affect glucose metabolism of isolated rat hepatocytes. Proc Soc Exp Biol Med. 1984;177:372–376. doi: 10.3181/00379727-177-41958. [DOI] [PubMed] [Google Scholar]
- 30.Stewart Molecular weight of guar gum affects short-chain fatty acid profile in model intestinal fermentation Molecular Nutrition & Food Research. 2000;50(10):971–976. doi: 10.1002/mnfr.200600024. [DOI] [PubMed] [Google Scholar]
- 31.Deysher AE, Waxman AR, White RD, Williams TD, Lachey JL, Seeley RJ, Lowell BB, Elmquist JK. Mice lacking ghrelin receptors resist the development of diet-induced obesity. J Clin Invest. 2005;115(12):3393–7. doi: 10.1172/JCI26002. [DOI] [PMC free article] [PubMed] [Google Scholar]
- 32.Schneeman BO. Gastrointestinal physiology and functions. Br J Nutr. 2002;88(suppl 2):S159–163. doi: 10.1079/BJN2002681. [DOI] [PubMed] [Google Scholar]
- 33.Friedman JM, Halaas JL. Leptin and the regulation of body weight in mammals. Nature. 1998;395:763–770. doi: 10.1038/27376. [DOI] [PubMed] [Google Scholar]
- 34.Heymsfield SB, Greenberg AS, Fujioka K, Dixon RM, Kushner R, Hunt T, Lubina JA, Patane J, Self B, Hunt P, McCamish MJ. Recombinant leptin for weight loss in obese and lean adults: a randomized, controlled, dose-escalation trial. Am Med Assoc. 1999;282:1568–1575. doi: 10.1001/jama.282.16.1568. [DOI] [PubMed] [Google Scholar]
- 35.Considine RV, Sinha MK, Heiman MI, Kriauciunas A, Stephens TW, Nyce MR, Ohannesian JP, Marco CC, McKee LJ, Bauer TL. Serum immunoreactive-leptin concentrations in noemal-weight and obese humans. N Engl J Med. 1996;334:292–295. doi: 10.1056/NEJM199602013340503. [DOI] [PubMed] [Google Scholar]
- 36.Huang W, Dedousis N, Bhatt BA, O’Doherty RM. Impaired activation of phosphatidylinositol 3-kinase by leptin is a novel mechanism of hepatic leptin resistance in diet-induced obesity. J Biol Chem. 2004;279:21695–21700. doi: 10.1074/jbc.M401546200. [DOI] [PubMed] [Google Scholar]
- 37.Van Heek M, Compton DS, France CF, Tedesco RP, Fawzi AB, Graziano MP, Sybertz EJ, Strader CD, Davis HR., Jr Diet-induced obese mice develop peripheral, but not central, resistance to leptin. J Clin Invest. 1997;99:385–390. doi: 10.1172/JCI119171. [DOI] [PMC free article] [PubMed] [Google Scholar]
- 38.Orban Z, Remaly AT, Sampson M, Trajanoski Z, Chrousos GP. The differential effect of food intake and beta-adrrenergic stimulation on adipose-derived hormones and cytokines in man. J Clin Endocrinol Metab. 1999;84:2126–2133. doi: 10.1210/jcem.84.6.5747. [DOI] [PubMed] [Google Scholar]
- 39.Bado A, Levasseur S, Attoub S, Kermorgant S, Laigneau JP, Bortoluzzi MN, Moizo L, Lehy T, Guerre-Millo M, Marchand-Brustel Y, Lewin MJ. The stomach is a source of leptin. Nature. 1998;394:790–793. doi: 10.1038/29547. [DOI] [PubMed] [Google Scholar]
- 40.Roberts CK, Berger JJ, Barnard RJ. Long-term effects of diet on leptin, energy intake, and activity in a model of diet-induced obesity. J Appl Physiol. 2002;93:887–893. doi: 10.1152/japplphysiol.00224.2002. [DOI] [PubMed] [Google Scholar]
- 41.Thorburn A, Muir J, Proietto J. Carbohydrate fermentation decreases hepatic glucose output in healthy subjects. Metabolism. 1993;42:780–785. doi: 10.1016/0026-0495(93)90249-n. [DOI] [PubMed] [Google Scholar]
- 42.Lin L, Martin R, Schaffhauser AO, York DA. Acute changes in the response to peripheral leptin with alteration in the diet composition. Am J Physiol Regul Integr Comp Physiol. 2001;280:R504–9. doi: 10.1152/ajpregu.2001.280.2.R504. [DOI] [PubMed] [Google Scholar]
- 43.Zhou J, Hegsted M, McCutcheon KM, Keenan MJ, Xi X, Raggio AM, Martin RJ. Peptide YY and proglucagon mRNA expression patterns and regulation in the gut. Obesity. 2006;14:683–689. doi: 10.1038/oby.2006.77. [DOI] [PubMed] [Google Scholar]
- 44.Roberts CK, Berger JJ, Barnard RJ. Long-term effects of diet on leptin, energy intake, and activity in a model of diet-induced obesity. J Appl Physiol. 2002;93:887–893. doi: 10.1152/japplphysiol.00224.2002. [DOI] [PubMed] [Google Scholar]
- 45.Anini Y, Brubaker PL. Role of leptin in the regulation of glucagon-like peptide-1 secretion. Diabetes. 2003;52:252–259. doi: 10.2337/diabetes.52.2.252. [DOI] [PubMed] [Google Scholar]
- 46.Burcelin R, Crivelli V, Dacosta A, Roy-Tirelli A, Thorens B. Heterogeneous metabolic adaptation of C57BL/6J mice to high-fat diet. Am J Physiol Endocrinol Metab. 2002;282:E834–E842. doi: 10.1152/ajpendo.00332.2001. [DOI] [PubMed] [Google Scholar]
- 47.Peter CT, Choi Yang-Ho, Brubaker PL, Anderson GH. A glucagon-like peptide-1 receptor agonist and an antagonist modify macronutrient selection by rats. J nutr. 2001;131:2164–2170. doi: 10.1093/jn/131.8.2164. [DOI] [PubMed] [Google Scholar]
- 48.Erdmann J, Töpsch R, Lippl F, Gussmann P, Schusdziarra V. Postprandial response of plasma ghrelin levels to various test meals in relation to food intake, plasma insulin, and glucose. J Clin Endocrinol Metab. 2004;89(6):3048–54. doi: 10.1210/jc.2003-031610. [DOI] [PubMed] [Google Scholar]
- 49.Blom WA, Lluch A, Vinoy S, Stafleu A, Van Den Berg R, Holst JJ, Lol FJ, Hendriks HF. Effects of gastric emptying on the postprandial ghrelin response. Am J Physiol Endocrinol Metab. 2006;290(2):E389–95. doi: 10.1152/ajpendo.00238.2005. [DOI] [PubMed] [Google Scholar]
- 50.Cani PD, Dewever C, Delzenne NM. Nulin-type fructans modulate gastrointestinal peptides involved in appetite regulation (glucagon-like peptide-1 and ghrelin) in rats. Br J Nutr. 2004;92(3):521–6. doi: 10.1079/bjn20041225. [DOI] [PubMed] [Google Scholar]


