

Abstract
Progress in the development and application of nanoengineered systems is limited by the availability of quantitative measurement techniques. For the engineering of nanoparticle (NP)-based systems, single NP characterization is essential, but existing methods are slow and low thoughput. We demonstrate a flow spectroscopy technique capable of analyzing hundreds of nanoparticles per second and use this technique for the high throughput analysis of nanoparticle surface-enhanced resonant Raman scattering (SERRS) tags. By measuring Rayleigh and Raman scattering from thousands of individual tags, tag preparations can be characterized based on their brightness and uniformity. The rapid analysis of individual nanoparticles using high spectral resolution flow spectroscopy will be useful in many areas of nanoengineering.
Keywords: nanoparticle, plasmon, SERS, spectroscopy
Modern metal nanoparticle (NP) synthesis techniques have enabled the development of nano-scale materials with unique optical properties for a wide range of devices and applications, including biomolecule detection1–4 and cancer therapeutics.5,6 A barrier to exploiting the unique structure-dependent optical properties of NPs comes from difficulty in controlling particle size and shape. NP characterization techniques are diverse and include spectroscopy, imaging, and structural measurements, and most often a number of complementary techniques are used to correlate NP structure and functional properties. These techniques typically fall into one of two categories: ensemble techniques, which are quick, but unable to distinguish subpopulations within a sample, and single NP characterization techniques, which reveal sample heterogeneity but are typically slow and labor intensive.
Single particle characterization is particularly important for applications that use NP tags for biosensing, where “dim” tags can reduce sensitivity by occupying binding sites while contributing negligibly to the detectable signal. Dark field microscopy, which has excellent spectral resolution and sensitivity, has enabled the measurement of optical properties of single NPs arrayed on a substrate and has become a popular characterization tool,4,7–10 although the serial measurement of enough particles for a useful statistical analysis is very slow, with analysis rates on the order of 1 particle per minute. Recently, a faster implementation of this approach has been presented that increases the speed with which single particles are analyzed by 1–2 orders of magnitude,9 while still requiring deposition of particles on a substrate. This technique allows analysis rates of up to 1–2 NPs per second with ~1.5% coincidence,9 which occurs when two or more particles are located within a diffraction-limited spot and the individual NP spectra cannot be resolved. The throughput of this technique depends upon both sample integration time and sample preparation, with more populated samples resulting in higher throughput, but also in a higher frequency of coincidence.
Another approach uses correlation spectroscopy to measure Rayleigh and Raman scattering of single NPs in solution at specific wavelengths as they diffuse into and out of a laser beam.11 This method characterizes selected optical properties as well as NP translational and rotational diffusive properties11–13 but offers limited spectral resolution as band-pass filters are used to select a spectral window and the intensity of the spectral band measured using avalanche photodiodes. This technique allows solution phase NP analysis, but the event rate and collection time depend upon the speed at which the sample diffuses into and out of the laser spot. This may inadvertently predispose the analysis toward faster diffusing particle populations and requires changing the medium viscosity to reduce NP diffusivity and increase sample integration time.12 Thus, while both dark field and correlation spectroscopy can be extremely useful for specific applications such as monitoring NP growth9 and chemical reactions that occur on a NP surface10 (dark field microscopy), or simultaneously monitoring NP optical and diffusive properties11–13 (correlation spectroscopy), a general method for making high throughput and high resolution spectral measurements of individual nanoparticles is still lacking.
We are interested in the development of surface-enhanced resonant Raman scattering (SERRS) tags for cytometry,14–16 where spectrally distinct tags enable multiplexed and multiparameter cell measurements.17–19 Fluorescent tags are most often used to label antibodies or other molecules, but the broad emission spectra of fluorophores limit the number of different labels that can be used simultaneously. The narrow spectral features of Raman scattering present the potential for highly multiparameter measurements and are attractive for many applications including flow and image cytomety14,20–23 and microarray-based sensing.1,24 Surface-enhanced Raman scattering (SERS) is a special case of Raman scattering where the interactions of a Raman-active compound (usually a chromophore) with the high electric fields of a plasmon resonant NP or roughened metal surface result in Raman scattering intensity enhancements of many orders of magnitude.25,26 Maximum enhancements are expected when the excitation laser is coresonant with both the chromophore absorption and the NP plasmon resonance, a case known as surface-enhanced resonant Raman scattering (SERRS). The engineering of SERS and SERRS tags has been a subject of much interest,27–29 with a number of groups making significant progress.16,20,30–36 However, given the number of criteria which can effect SERRS tag optical properties (including NP size, shape, number of particles per tag, and plasmon resonance frequency, among others), it is not uncommon to observe significant Raman scattering intensity variations within a sample. While analyzing thousands of tags from multiple preparations might take hours or days using dark field microscopy, here we demonstrate a high throughput single particle characterization technique capable of measuring thousands of NPs in just a few minutes.
The high throughput Raman flow spectrometer employs hydrodynamic focusing of the sample in a sheath flow cuvette to make simultaneous measurements of NP Rayleigh and Raman light scatter. NPs in the sample pass through the center of the ~4 pL probe volume defined by the dimensions of the laser beam, sample stream, and focal spot of the collection optics (Figure 1a). Using a small probe volume provides advantages such as reducing the background signal from system autofluorescence and the probability of having multiple nanoparticles in the probe volume simultaneously. The transit time of a NP within the beam depends primarily upon the laser beam spot height and the sheath fluid linear flow rate. Elastically scattered light is measured using a PMT and triggers acquisition of Raman scattering spectra by an EMCCD attached to an imaging spectrograph (Figure 1b). By using a highly efficient light collection setup, an EMCCD for spectral collection, and a sensitive PMT, we are able to collect high resolution Raman spectra of individual SERRS tags with signal integration times of only 300 μs (Figure 1c).
Figure 1.

Single nanoparticle flow spectrometer. (a) Sample is hydrodynamically focused to flow through a focused laser beam. Note that the figure is not to scale. (b) Schematic of the Raman flow spectrometer setup. Refer to the Materials and Methods section for detailed instrument information. (c) Single tag Raman scattering spectra of an inactive SERRS tag (black) and Raman-active tags prepared with oxazine 170 (red), thionin (blue), and malachite green (green) of varying intensities. Spectra have been offset for clarity.
The NP analysis rate depends upon NP concentration, sample and sheath stream flow rates, and the response time of the detector. In conventional flow cytometry using PMTs, signal integration times of a few microseconds enable particle analysis rates of tens of thousands per second. Our system uses a CCD detector that can capture spectra from single particles with exposure times as short as 10 μs;37 however, the readout speed of the CCD limits the event rate to few hundred events per second at most. Beyond these hardware limitations, the single particle analysis rate is limited by particle concentration and, ultimately, coincidence from NPs that just happen to pass through the probe volume simultaneously.
The expected frequency of coincidence can be calculated from the laser beam height and the particle concentration (Supporting Information, Figures S1 and S2), and the contribution of coincidence can be measured through a simple sample dilution experiment. Data collected from NP samples at a variety of dilutions (Supporting Information, Figure S3) demonstrated that at high concentrations the mean scattering intensity was elevated due to a significant number of coincident events, which can be identified as a shoulder on the Rayleigh scattering frequency histogram. Lower concentration samples exhibited minimal coincidence, evidenced by the absence of a histogram shoulder and consistent scattering intensity measured across a range of dilutions. Because the sample volumetric flow rate through the measurement probe volume is known, the event rate can be used to calculate the NP concentration in the sample and to validate theoretical estimates of expected coincidence. For the data presented here, samples were analyzed at concentrations that resulted in event rates of 5–6 NPs/s and coincidence rates of less than 0.5% for the sheath and sample flow rates and laser beam height used. In many cases, especially where coincident events can be accurately identified (for example, on the basis of Rayleigh scatter) and excluded from analysis, higher concentrations and analysis rates can be employed.
Flow spectroscopy offers many of the benefits of dark field microscopy (control of signal integration time, high spectral resolution) while offering the ability to interrogate samples in solution and easily control the measurement rate. Low resolution flow-based methods have been used for NP Rayleigh scattering38 and size analysis,39 and NPs have been used as Rayleigh and Raman scattering tags on beads and cells for low40 and high14 resolution flow spectroscopy methods. However, to the best of our knowledge, this work is the first to report a high throughput high spectral resolution flow spectroscopy instrument with single NP sensitivity.
We are using this single NP approach to optimize the preparation of SERRS scattering tags for cellular and molecular measurement applications. As an example, we have prepared SERRS tags for 647 nm excitation from gold nanoshells composed of a 200 nm SiO2 core and an approximately 30–40 nm gold layer. Nanoshells have highly tunable resonances41 and high electric-field enhancements, making them ideal SERS substrates.42 Nanoshells were incubated with Raman-active chromophores oxazine 170, thionin, or malachite green, prior to depositing silver on the nanoshell surface using a commercially available silver enhancement kit. Finally, bovine serum albumin was added to encapsulate the tags and promote stability. An ensemble SERRS spectrum from oxazine 170 SERRS tags is presented in Figure 2a.
Figure 2.

Ensemble and flow spectroscopy analysis of nanoshell SERRS tags. (a) Ensemble oxazine 170 SERRS tag Raman spectrum from tags prepared with 2 μL of silver enhancement solution. Spectrum was collected from a 0.9 pM nanoshell solution (5.5 × 10⁸ NPs/mL as measured using flow spectroscopy) using 14 mW of 647 nm laser excitation and a signal integration time of 2 s. (b) Univariate and bivariate displays of Rayleigh and Raman scattering intensity from single tag flow spectroscopy analysis and representative single tag spectra from each subpopulation. Spectra were collected using 340 mW of 647 nm excitation and signal integration times of 300 μs and have been offset for clarity.
Flow spectroscopy enables the simultaneous measurement of Rayleigh and Raman scattering from individual tags and, unlike bulk spectroscopy, allows us to distinguish SERRS tag preparations that produce a high percentage of Raman-active tags from those that produce a small number of extremely bright tags. Data were collected from approximately 5000 individual tags for seven oxazine 170 SERRS tag preparations. Figure 2b displays Rayleigh and Raman (background-corrected integrated intensity from 559 to 615 cm−1) scattering data from a single SERRS tag preparation binned in frequency histograms plotting scattering intensity versus event frequency, as well as in a bivariate plot in which correlated Rayleigh and Raman scattering signals from individual tags are displayed. Using this method, tag subpopulations can be distinguished based upon their optical properties. In this example, we can define three subpopulations: (I) tags that do not exhibit Raman scattering; (II) Raman-active tags that have Rayleigh scattering intensities similar to bare nanoshells; and (III) Raman-active tags that exhibit significantly increased Rayleigh scattering and may be multishell clusters. Four representative single tag spectra from each population are displayed, and as expected, spectra from subpopulation I display no Raman scattering, while spectra from subpopulations II and III display Raman scattering of varying intensities. Comparison of the spectra from subpopulations II and III implies a positive correlation between Rayleigh and Raman scattering intensity, further suggesting that the tags in subpopulation III (<2% of all tags) may be multishell clusters.
Having demonstrated that flow spectroscopy can be used as a high throughput tool for the characterization of individual NPs, we used this method to guide the development of bright and uniform SERRS tags. SERRS tags were prepared with varying volumes of silver enhancement solution to produce tags with silver layers of varying thickness. The Rayleigh scattering intensities of the SERRS tags and bare nanoshells were found to be similar, suggesting that the preparation technique causes minimal aggregation, a hypothesis that was confirmed using transmission electron microscopy (TEM, Supporting Information, Figure S4). Figure 3a displays overlaid Raman scattering intensity histograms from selected SERRS tag preparations with silver layers of varying thickness, controlled by varying the volume of silver enhancement solution (0, 3, or 5 μL) used during the silver plating process. The histograms display Raman-active and -inactive populations and demonstrate that, in the absence of silver plating, fewer than 20% of the tags exhibit detectable Raman scattering signals (Figure 3a). Initially, plating of a silver layer increases the number and intensity of the Raman-active tags; however, if the silver layer is too thick due to the addition of too much silver enhancement solution, the percentage of active tags and Raman scattering intensity decrease. Additionally, bivariate density plots, which have been colored to convey information about the number of events at each location, can be used to portray information about the Rayleigh and Raman scattering intensity of each sample (Figure 3b –d). These plots are a useful way to view the main populations of each tag preparation. The majority of the tags with no silver plating are Raman-inactive and have relatively low Rayleigh scattering intensities, as seen in the majority population (depicted in red) in Figure 3b. The main population of tags prepared with 3 μL of silver enhancement solution have tightly clustered Rayleigh and Raman scattering intensities (represented by the orange/red cluster, Figure 3c), while tags prepared with 5 μL of silver enhancement solution display increased variation in both Rayleigh and Raman scattering. The tight clustering of the events in Figure 3c demonstrates the relative uniformity of this SERRS tag preparation, making these tags superior for biosensing applications.
Figure 3.

SERRS tag population analysis. (a) Histograms of Raman scattering intensity from three SERRS tag preparations prepared with 0, 3, and 5 μL of silver enhancement solution. Illustrations display the relative sizes of the silica core (gray), gold shell (yellow), and silver shell (blue). (b–d) Density plots of SERRS tags prepared with 0, 3, and 5 μL of silver enhancement solution. The analysis was performed using 340 mW of 647 nm excitation and signal integration times of 300 μs.
Flow spectroscopy was used to determine the optimal volume of silver enhancement solution by comparing the Raman scattering intensity and percentage of Raman-active tags for seven SERRS tag preparations (Figure 4a). Both the mean Raman scattering intensity and percentage of Raman-active tags varied with the thickness of the silver layer. Tags prepared with 2–4 μL of silver enhancement solution, which have silver layers ranging from approximately 35 to 70 nm thick (as measured by TEM, Figure 4b, and Supporting Information Figure S5 and Table S1) appear optimal, as they exhibit high Raman scattering intensities and produce greater than 80% Raman-active tags. Variations in SERRS tag brightness and yield may occur due to changes in the effective surface roughness or enhanced electric fields caused as the excitation of the gold nanoshell plasmon induces oscillations of the silver conduction electrons, as previously reported for lithographically templated disks and wires.43 Thicker silver layers may reduce the Raman signal due to changes in the location of the nanoshell resonance or a decrease in surface roughness.
Figure 4.
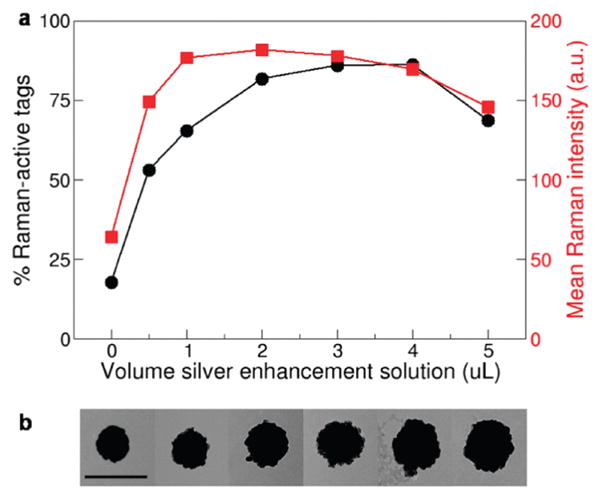
Analysis of SERRS tag preparations. (a) Mean Raman scattering intensity of Raman-active tags (red squares) for each tag preparation and the percentage of Raman-active tags (black circles) were found to vary with the thickness of the tag silver layer. (b) Representative TEM images of SERRS tags with silver layers of varying thickness. Scale bar is 500 nm.
It should not be overlooked that flow spectroscopy can also be used to measure NP concentration. While NP concentrations are typically calculated using an extinction spectroscopy measurement and an estimated molar extinction coefficient, the sensitivity of the plasmon resonance to NP size, shape, surface chemistry, and dielectric medium can introduce errors into these calculations. As demonstrated by the linear relationship between event rate and NP concentration (Supporting Information, Figure S3), it is possible to explicitly measure NP concentration by counting the number of NPs in a given volume, as long as all NPs have scattering intensities that are above the sensitivity threshold of the instrument.
Progress in the development and application of nanoengineered systems is limited by the speed and precision of quantitative measurement techniques. For the engineering of NP-based systems, single NP measurements are an essential, but rate-limiting, need. The rapid analysis of individual NPs in a flowing sample stream represents a powerful tool to address this need. Like conventional flow cytometry of cells, flow spectroscopy of NPs enables correlated, multiparameter optical analysis of individual particles at high serial measurement rates. Unlike conventional flow cytometry, which uses optical filters and point detectors to measure integrated intensities from selected wavelength ranges, our flow spectroscopy approach enables high spectral resolution suitable for the analysis of Raman scattering spectra. NP-based SERRS tags with narrow spectral features have the potential to enable significantly increased levels of multiplexing for measurements of cells and molecules, but brighter and more uniform tags are required. These systems have an inherent dispersity in their structural and optical properties that require some amount of empirical optimization to minimize. Rapid measurements of individual NP-based SERRS tags will be an essential tool for developing uniform tags, and the flow spectroscopy-based approach presented here provides that tool. Moreover, the high throughput and high resolution NP analysis capabilities of this approach should find application in many other areas of nanoengineering.
MATERIALS AND METHODS
General Methods
Gold nanoshells were provided by nanoComposix. Extinction spectra were collected using a Cary 3 UV–visible spectrophotometer. Water was filtered using a 0.1 μm filter (Pall Corporation, Suppor-100).
SERRS Tag Preparation
Nanoshells (100 μL of as-provided solution diluted in 1 mL of water) and a Raman-active compound, oxazine 170 (3 μL methanolic solution, 1.2 μM, calculated using an extinction coefficient of ε612 = 83 000 mol L−1 cm−1, Sigma), were incubated for 8 min, at which point silver enhancement solution (0, 0.5, 1, 2, 3, 4, 5 μL of both initiator and enhancer, Ted Pella) was added and the mixture vortexed for 30 s. After 8 min, bovine serum albumin solution (10 μL of 1 mg/mL in PBS, Sigma) was added to encapsulate the tags and promote stability. The SERRS tags were then diluted 10-fold prior to flow spectroscopy characterization.
Malachite green and thionin SERRS tags were prepared in an analogous fashion using a second batch of nanoshells and malachite green (3 μL ethanolic solution, 2 μM, calculated using an extinction coefficient of ε616.5 = 148 900 mol L−1 cm−1, Fluka) or thionin (3 μL ethanolic solution, 1 μM, Sigma), followed by the addition of silver enhancement solution (0.6 μL of both initiator and enhancer).
Flow Spectroscopy
The flow spectrometer is built around a 250 μm inner diameter square bore flow cell from a commercial flow cytometer (BioSense, Beckman Coulter, labeled FC in Figure 1b). Sheath and sample delivery are provided by commercially available pumps (Global FIA Milligat) controlled by FloZF software. Sheath and sample volumetric flow rates were 2 μL/s and 2 nL/s, respectively, resulting in particle flow rates of approximately 3 cm/s, corresponding to particle transit times of 200–300 μs through the probe volume. Excitation is provided by a 647 nm laser beam (Coherent Innova 300C) focused through a short focal length cylindrical lens (f = 15 mm, labeled L1 and L2 in Figure 1b) to form an elliptical spot about 80 μm wide and 20 μm high. One mirrored and one unmirrored lens mounted to each face of the flow cell perpendicular to the laser illumination increased the light collected from the probe volume. Plano convex lenses (f = 80 and 35 mm, labeled L3 and L4 in Figure 1b, respectively) collected elastically scattered light onto the face of a multimode optical fiber and focused on a PMT (R3896 Hamamatsu), while another set of plano convex lenses (f = 40 and 35 mm, labeled L6 and L7 in Figure 1b, respectively) focused light on a multimode optical fiber coupled to an imaging spectrograph (Holospec f/1.8, Kaiser) which disperses the collected light and images it onto an electron multiplied CCD detector (EMCCD, Newton, Andor) after the elastically scattered light has been removed using a long pass filter (Semrock LP02-647RU-50). The PMT output signal passes through an amplifier and is sent to a custom data acquisition system.44 The elastic scattering signal is used to trigger data acquisition by the camera which has 16 μm square pixels arranged in a rectangular grid 1600 pixels wide by 200 pixels high. Hardware binning was performed by defining a region of interest corresponding to the spectral image from the optical fiber (50 pixels tall). Pixels within the ROI were binned fully in the vertical direction and 10× in the horizontal direction. This was found to increase signal while maintaining enough spectral resolution to distinguish Raman scattering peaks. The exposure time for spectral collection was 300 μs and was chosen to correspond to the transit time of particles through the probe volume.
Prior to analysis of SERRS tags, 3.1 μm Nile Blue stained microspheres (Spherotech) were used to assess the alignment of the system. Detection was triggered by light scatter, and bead fluorescence was measured with the CCD. The singlet peak was easily distinguishable from doublets and was confirmed to have a CV of less than 8% and an average intensity of approximately 25 000 counts using a laser power of 310 mW and a PMT voltage of 250 V prior to collecting data on SERRS tags. SERRS tags were analyzed using PMT voltages of 330 V and laser power of 340 mW. Tags were analyzed at concentrations of approximately 2.5 × 10⁶ particles/mL, resulting in event rates of 5 particles/s. While the instrument is capable of much faster analysis, this even rate ensured that the frequency of coincident events (<0.5%) was negligible.
Ensemble Raman Spectroscopy
Ensemble Raman scattering spectra were measured using a custom Raman spectrometer. The spectrometer consisted of a free space laser (647 nm, Coherent Innova 300C) coupled to a multimode optical fiber (CeramOptec), and light was collected using a second multimode optical fiber (CeramOptec) and coupled to the imaging spectrograph and CCD detector described above. Spectra were collected from 0.9 pM (5.5 × 10⁸ particles/mL as measured using flow spectroscopy) solutions using a laser power of 14 mW and signal integration times of 2 s.
Transmission Electron Microscopy
TEM imaging was performed using a JEOL-2000EX operating at an accelerating voltage of 200 keV. Grids were prepared by pipetting a 10 μL drop of solution onto a grid and allowing it to sit for 3–6 min prior to wicking liquid away with a Kimwipe. Approximately 100 SERRS tags per sample were imaged to measure the average number of nanoshells per SERRS tag, and approximately 50 nanoshells were imaged to measure the average SERRS tag diameter.
Data Analysis
Spectral data from the spectrograph/EMCCD were converted to ASCII text (Andor Solis software) and combined with PMT data (including scattering peak height and width) in a FCS3.0 file, and the parameter math functions of FCS Express (Denovo Software) were used to calculate the integrated intensities of selected spectral features. Using this method, each event is associated with a Rayleigh scattering pulse height, area, and width, and all the Raman scattering spectral data are stored as an intensity associated with each bin of the collected spectrum. The Raman scattering intensity for oxazine 170 tags was calculated by summing the intensity of the main oxazine peak (a doublet located between 559 and 615 cm−1) and subtracting the intensity away from a Raman peak to account for background (in this case, a weighted average of the intensity at 549 and 656 cm−1).
Supplementary Material
Acknowledgments
We acknowledge financial support from the NIH (Grant R01 EB003824). TEM imaging was performed at the National Center for Microscopy and Imaging Research in San Diego, which is supported by NIH Grant RR04050. We thank nanoComposix for providing the gold nanoshell sample.
Footnotes
Supporting Information Available: Coincidence probability calculations, nanoparticle flow spectroscopy dilution data, and TEM images and analysis. This material is available free of charge via the Internet at http://pubs.acs.org.
REFERENCES AND NOTES
- 1.Cao YWC, Jin RC, Mirkin CA. Nanoparticles with Raman Spectroscopic Fingerprints for DNA and RNA Detection. Science. 2002;297:1536–1540. doi: 10.1126/science.297.5586.1536. [DOI] [PubMed] [Google Scholar]
- 2.El-Sayed IH, Huang XH, El-Sayed MA. Surface Plasmon Resonance Scattering and Absorption of Anti-EGFR Antibody Conjugated Gold Nanoparticles in Cancer Diagnostics: Applications in Oral Cancer. Nano Lett. 2005;5:829–834. doi: 10.1021/nl050074e. [DOI] [PubMed] [Google Scholar]
- 3.Haes AJ, Chang L, Klein WL, Van Duyne RP. Detection of a Biomarker for Alzheimer’s Disease from Synthetic and Clinical Samples Using a Nanoscale Optical Biosensor. J Am Chem Soc. 2005;127:2264–2271. doi: 10.1021/ja044087q. [DOI] [PubMed] [Google Scholar]
- 4.Sonnichsen C, Reinhard BM, Liphardt J, Alivisatos AP. A Molecular Ruler Based on Plasmon Coupling of Single Gold and Silver Nanoparticles. Nat Biotechnol. 2005;23:741–745. doi: 10.1038/nbt1100. [DOI] [PubMed] [Google Scholar]
- 5.Loo C, Lowery A, Halas N, West J, Drezek R. Immunotargeted Nanoshells for Integrated Cancer Imaging and Therapy. Nano Lett. 2005;5:709–711. doi: 10.1021/nl050127s. [DOI] [PubMed] [Google Scholar]
- 6.El-Sayed IH, Huang XH, El-Sayed MA. Selective Laser Photo-Thermal Therapy of Epithelial Carcinoma Using Anti-EGFR Antibody Conjugated Gold Nanoparticles. Cancer Lett. 2006;239:129–135. doi: 10.1016/j.canlet.2005.07.035. [DOI] [PubMed] [Google Scholar]
- 7.Jensen TR, Duval ML, Kelly KL, Lazarides AA, Schatz GC, Van Duyne RP. Nanosphere Lithography: Effect of the External Dielectric Medium on the Surface Plasmon Resonance Spectrum of a Periodic Array of Silver Nanoparticles. J Phys Chem B. 1999;103:9846–9853. [Google Scholar]
- 8.Su KH, Wei QH, Zhang X, Mock JJ, Smith DR, Schultz S. Interparticle Coupling Effects on Plasmon Resonances of Nanogold Particles. Nano Lett. 2003;3:1087–1090. [Google Scholar]
- 9.Becker J, Schubert O, Sonnichsen C. Gold Nanoparticle Growth Monitored In Situ Using a Novel Fast Optical Single-Particle Spectroscopy Method. Nano Lett. 2007;7:1664–1669. doi: 10.1021/nl070627g. [DOI] [PubMed] [Google Scholar]
- 10.Novo C, Funston AM, Mulvaney P. Direct Observation of Chemical Reactions on Single Gold Nanocrystals Using Surface Plasmon Spectroscopy. Nat Nanotechnol. 2008;3:598–602. doi: 10.1038/nnano.2008.246. [DOI] [PubMed] [Google Scholar]
- 11.Laurence TA, Braun G, Talley C, Schwartzberg A, Moskovits M, Reich N, Huser T. Rapid, Solution-Based Characterization of Optimized SERS Nanoparticle Substrates. J Am Chem Soc. 2009;131:162–169. doi: 10.1021/ja806236k. [DOI] [PubMed] [Google Scholar]
- 12.Schrof W, Klingler JF, Rozouvan S, Horn D. Raman Correlation Spectroscopy: A Method for Studying Chemical Composition and Dynamics of Disperse Systems. Phys Rev E. 1998;57:R2523–R2526. [Google Scholar]
- 13.Eggeling C, Schaffer J, Seidel CAM, Korte J, Brehm G, Schneider S, Schrof W. Homogeneity, Transport, and Signal Properties of Single Ag Particles Studied by Single-Molecule Surface-Enhanced Resonance Raman Scattering. J Phys Chem A. 2001;105:3673–3679. [Google Scholar]
- 14.Watson DA, Brown LO, Gaskill DF, Naivar M, Graves SW, Doorn SK, Nolan JP. A Flow Cytometer for the Measurement of Raman Spectra. Cytometry A. 2008;73:119–128. doi: 10.1002/cyto.a.20520. [DOI] [PubMed] [Google Scholar]
- 15.Brown LO, Doorn SK. Optimization of the Preparation of Glass-Coated, Dye-Tagged Metal Nanoparticles as SERS Substrates. Langmuir. 2008;24:2178–2185. doi: 10.1021/la703218f. [DOI] [PubMed] [Google Scholar]
- 16.Brown LO, Doorn SK. A Controlled and Reproducible Pathway to Dye-Tagged, Encapsulated Silver Nanoparticles as Substrates for SERS Multiplexing. Langmuir. 2008;24:2277–2280. doi: 10.1021/la703853e. [DOI] [PubMed] [Google Scholar]
- 17.Nolan JP, Mandy F. Multiplexed and Microparticle-Based Analyses: Quantitative Tools for the Large-Scale Analysis of Biological Systems. Cytometry A. 2006;69:318–325. doi: 10.1002/cyto.a.20266. [DOI] [PMC free article] [PubMed] [Google Scholar]
- 18.Nolan JP, Yang L. The Flow of Cytometry into Systems Biology. Briefings Funct Genomics Proteomics. 2007;6:81–90. doi: 10.1093/bfgp/elm011. [DOI] [PubMed] [Google Scholar]
- 19.Chattopadhyay PK, Hogerkorp CM, Roederer M. A Chromatic Explosion: The Development and Future of Multiparameter Flow Cytometry. Immunology. 2008;125:441–449. doi: 10.1111/j.1365-2567.2008.02989.x. [DOI] [PMC free article] [PubMed] [Google Scholar]
- 20.Qian X, Peng XH, Ansari DO, Yin-Goen Q, Chen GZ, Shin DM, Yang L, Young AN, Wang MD, Nie S. In Vivo Tumor Targeting and Spectroscopic Detection with Surface-Enhanced Raman Nanoparticle Tags. Nat Biotechnol. 2008;26:83–90. doi: 10.1038/nbt1377. [DOI] [PubMed] [Google Scholar]
- 21.Keren S, Zavaleta C, Cheng Z, de la Zerda A, Gheysens O, Gambhir SS. Noninvasive Molecular Imaging of Small Living Subjects Using Raman Spectroscopy. Proc Natl Acad Sci US A. 2008;105:5844–5849. doi: 10.1073/pnas.0710575105. [DOI] [PMC free article] [PubMed] [Google Scholar]
- 22.Kneipp J, Kneipp H, Rajadurai A, Redmond R, Kneipp K. Optical Probing and Imaging of Live Cells Using SERS Labels. J Raman Spectrosc. 2009;40:1–5. [Google Scholar]
- 23.Shachaf CM, Elchuri SV, Koh AL, Zhu J, Nguyen LN, Mitchell DJ, Zhang J, Swartz KB, Sun L, Chan S, Sinclair R, Nolan GP. A Novel Method for Detection of Phosphorylation in Single Cells by Surface Enhanced Raman Scattering (SERS) Using Composite Organic–Inorganic Nanoparticles (COINs) PLoS ONE. 2009;4:e5206. doi: 10.1371/journal.pone.0005206. [DOI] [PMC free article] [PubMed] [Google Scholar]
- 24.Chen Z, Tabakman SM, Goodwin AP, Kattah MG, Daranciang D, Wang XR, Zhang GY, Li XL, Liu Z, Utz PJ, Jiang KL, Fan SS, Dai HJ. Protein Microarrays with Carbon Nanotubes as Multicolor Raman Labels. Nat Biotechnol. 2008;26:1285–1292. doi: 10.1038/nbt.1501. [DOI] [PubMed] [Google Scholar]
- 25.Jeanmaire DL, Van Duyne RP. Surface Raman Spectroelectrochemistry: Part I. Heterocyclic, Aromatic, and Aliphatic Amines Adsorbed on the Anodized Silver Electrode. J Electroanal Chem. 1977;84:1–20. [Google Scholar]
- 26.Vo-Dinh T, Yan F, Stokes DL. Plasmonics-Based Nanostructures for Surface-Enhanced Raman Scattering Bioanalysis. Methods Mol Biol. 2005;300:255–283. doi: 10.1385/1-59259-858-7:255. [DOI] [PubMed] [Google Scholar]
- 27.Kneipp K, Kneipp H, Itzkan I, Dasari RR, Feld MS. Surface-Enhanced Raman Scattering: A New Tool for Biomedical Spectroscopy. Curr Sci. 1999;77:915–924. [Google Scholar]
- 28.Haynes CL, McFarland AD, Van Duyne RP. Surface-Enhanced Raman Spectroscopy. Anal Chem. 2005;77:338A–346A. [Google Scholar]
- 29.Ru ECL, Blackie E, Meyer M, Etchegoin PG. Surface Enhanced Raman Scattering Enhancement Factors: A Comprehensive Study. J Phys Chem C. 2007;111:13794–13803. [Google Scholar]
- 30.Jackson JB, Westcott SL, Hirsch LR, West JL, Halas NJ. Controlling the Surface Enhanced Raman Effect via the Nanoshell Geometry. Appl Phys Lett. 2003;82:257–259. [Google Scholar]
- 31.Doering WE, Nie S. Spectroscopic Tags Using Dye-Embedded Nanoparticles and Surface-Enhanced Raman Scattering. Anal Chem. 2003;75:6171–6176. doi: 10.1021/ac034672u. [DOI] [PubMed] [Google Scholar]
- 32.Khoury CG, Vo-Dinh T. Gold Nanostars For Surface-Enhanced Raman Scattering: Synthesis, Characterization and Optimization. J Phys Chem C. 2008;112:18849–18859. doi: 10.1021/jp8054747. [DOI] [PMC free article] [PubMed] [Google Scholar]
- 33.Graham D, Thompson DG, Smith WE, Faulds K. Control of Enhanced Raman Scattering Using a DNA-Based Assembly Process of Dye-Coded Nanoparticles. Nat Nanotechnol. 2008;3:548–551. doi: 10.1038/nnano.2008.189. [DOI] [PubMed] [Google Scholar]
- 34.Sha MY, Xu HX, Natan MJ, Cromer R. Surface-Enhanced Raman Scattering Tags for Rapid and Homogeneous Detection of Circulating Tumor Cells in the Presence of Human Whole Blood. J Am Chem Soc. 2008;130:17214–17215. doi: 10.1021/ja804494m. [DOI] [PMC free article] [PubMed] [Google Scholar]
- 35.Xie JP, Zhang QB, Lee JY, Wang DIC. The Synthesis of SERS-Active Gold Nanoflower Tags for In Vivo Applications. ACS Nano. 2008;2:2473–2480. doi: 10.1021/nn800442q. [DOI] [PubMed] [Google Scholar]
- 36.Zhang P, Yanyan G. Surface-Enhanced Raman Scattering inside Metal Nanoshells. J Am Chem Soc. 2009;131:3808–3809. doi: 10.1021/ja8086642. [DOI] [PubMed] [Google Scholar]
- 37.Watson DA, Gaskill DF, Brown LO, Doorn SK, Nolan JP. Spectral Measurements of Large Particles by Flow Cytometry. Cytometry A. 2009;75:460–464. doi: 10.1002/cyto.a.20706. [DOI] [PMC free article] [PubMed] [Google Scholar]
- 38.Siiman O, Jitianu A, Bele M, Grom P, Matijevic E. Amplified Light Scattering and Emission of Silver and Silver Core3Silica Shell Particles. J Colloid Interface Sci. 2007;309:8–20. doi: 10.1016/j.jcis.2007.02.025. [DOI] [PubMed] [Google Scholar]
- 39.Yang L, Zhu S, Hang W, Wu L, Yan X. Development of an Ultrasensitive Dual-Channel Flow Cytometer for the Individual Analysis of Nanosized Particles and Biomolecules. Anal Chem. 2009;81:2555–2563. doi: 10.1021/ac802464a. [DOI] [PubMed] [Google Scholar]
- 40.Siiman O, Burshteyn A. Preparation, Microscopy, and Flow Cytometry with Excitation into Surface Plasmon Resonance Bands of Gold or Silver Nanoparticles on Aminodextran-Coated Polystyrene Beads. J Phys Chem B. 2000;104:9795–9810. [Google Scholar]
- 41.Oldenburg SJ, Averitt RD, Westcott SL, Halas NJ. Nanoengineering of Optical Resonances. Chem Phys Lett. 1998;288:243–247. [Google Scholar]
- 42.Oldenburg SJ, Westcott SL, Averitt RD, Halas NJ. Surface Enhanced Raman Scattering in the Near Infrared Using Metal Nanoshell Substrates. J Chem Phys. 1999;111:4729–4735. [Google Scholar]
- 43.Wei W, Li S, Qin L, Xue C, Millstone JE, Xu X, Schatz GC, Mirkin CA. Surface Plasmon-Mediated Energy Transfer in Heterogap Au3Ag Nanowires. Nano Lett. 2008;8:3446–3449. doi: 10.1021/nl8023164. [DOI] [PMC free article] [PubMed] [Google Scholar]
- 44.Naivar MA, Parson JD, Wilder ME, Habbersett RC, Edwards BS, Sklar L, Nolan JP, Graves SW, Martin JC, Jett JH, Freyer JP. Open, Reconfigurable Cytometric Acquisition System: ORCAS. Cytometry A. 2007;71:915–924. doi: 10.1002/cyto.a.20445. [DOI] [PubMed] [Google Scholar]
Associated Data
This section collects any data citations, data availability statements, or supplementary materials included in this article.