Abstract
There is considerable interest in the properties of the unfolded states of proteins, particularly unfolded states which can be populated in the absence of high concentrations of denaturants. Interest in the unfolded state ensemble reflects the fact that it is the starting point for protein folding as well as the reference state for protein stability studies, and can be the starting state for pathological aggregation. The unfolded state of the C-terminal domain (residues 58 to 149) of the ribosomal protein L9 (CTL9) can be populated in the absence of denaturant at low pH. CTL9 is a 92 residue globular α, β protein. The low pH unfolded state contains more secondary structure than low pH urea unfolded state but it is not a molten globule. Backbone (1H, 13C and 15N) NMR assignments as well as side chain 13Cβ and 1Hβ assignments and 15N R2 values were obtained for the pH 2.0 unfolded form of CTL9 and for the urea unfolded state at pH 2.5. Analysis of the deviations of the chemical shifts from random coil values indicates that residues that comprise the two helices in the native state show a clear preference to adopt helical φ, ψ angles in the pH 2.0 unfolded state. There is a less pronounced but nevertheless clear tendency for residues 107 to 124 to preferentially populate helical φ, ψ values in the unfolded state. The urea unfolded state has no detectable tendency to populate any type of secondary structure even though it is as compact as the pH 2.0 unfolded state. Comparison of the two unfolded forms of CTL9 provides direct experimental evidence that states which differ significantly in their secondary structure can have identical hydrodynamic properties. This in turn demonstrates that global parameters such as Rh or Rg are very poor indicators of “random coil” behavior.
Keywords: Unfolded state, Protein folding, C-terminal domain of L9, NMR, Chemical shift analysis, Denatured state
Characterization of the unfolded state ensemble of proteins is an essential step in the development of a complete description of the protein folding process (1, 2). A detailed understanding of the unfolded state, particularly the nature and energetics of any residual interactions, is important because the unfolded state is the thermodynamic reference state for protein engineering studies, as well as the starting state for protein folding, and can be the starting state for pathological protein aggregation. Along these lines, recent work has highlighted the fact that mutations can exert significant effects upon the energetics of the unfolded state ensemble and can also alter a protein’s propensity to aggregate (3–7). Interest in the unfolded state has increased dramatically with the realization that actual unfolded state ensembles can, and often do, deviate significantly from the classic random coil model (3, 5–13). It is now recognized that the properties and structural propensities of unfolded state can vary widely depending upon experimental conditions, ranging from relatively expanded ensembles with little propensity to form persistent structure to more compact ensembles containing elements of native and non-native structure(14–17). The latter are often found under more native conditions while the former are often populated under denaturing conditions. The unfolded ensemble populated under native conditions is clearly the most physiologically relevant state but it is difficult to characterize since it is normally sparsely populated owing to the cooperativity of folding and to the fact that the free energy balance favors the native state. These considerations have lead to increased interest in proteins whose unfolded states can be accessed in the absence of denaturant.
There is also considerable interest in characterizing the conformational propensities of the unfolded state ensemble at the level of individual residues. One question of particular importance is whether or not unfolded state structures are limited to native interactions or whether they include contributions from non-native interactions. A second important issue is whether or not global parameters which report on compactness such as the radius of hydration (Rh) or the radius of gyration (Rg) can be used to test if the unfolded state confirms to the random coil model. This is important because it is well known that Rh and Rg should obey a characteristic power law dependence on the number of residues in a random coil chain. However, computational studies have suggested that proteins can obey the “random coil” power law yet contain significant secondary structure (8, 14, 16, 18, 19). Thus Rh and Rg may not be good probes of deviations from random coil behavior.
NMR is ideally suited for investigations of the unfolded state since it is currently the only method which can provide residue specific information for every residue in the unfolded protein (15, 17, 20–22) The assignment of the NMR spectra of unfolded states can still be challenging because of limited spectral resolution. Fortunately, modern triple resonance methods can often overcome these problems and have opened the door to a detailed characterization of the unfolded state (23). Here we report the use of NMR to characterize the unfolded state of CTL9 in the absence of denaturant, and in the presence of 7.6 M urea. CTL9 is interesting in this regard since the low pH unfolded state in the absence of urea is no more compact than the urea unfolded state as judged by their respective radii of hydration.
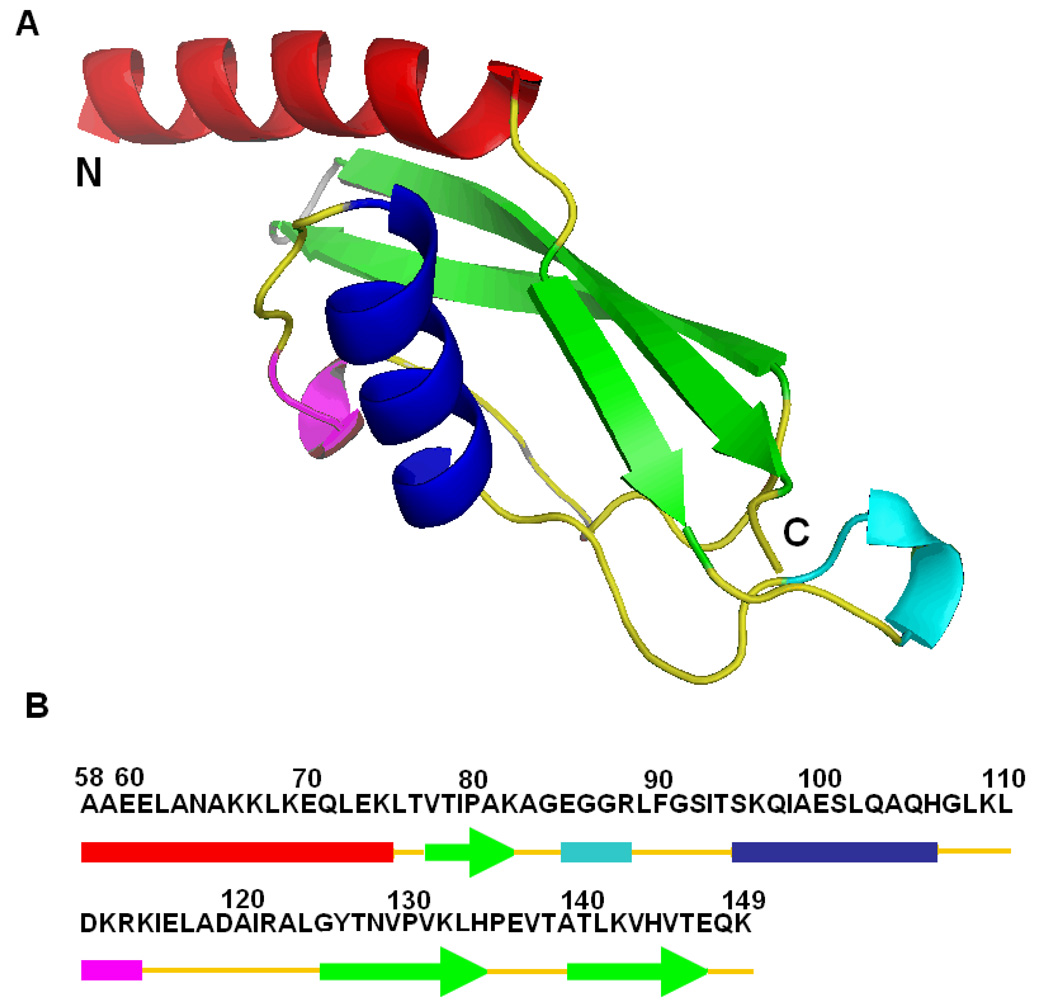
CTL9 is a 92 residue globular protein derived from the ribosomal protein L9 (Figure-1). The protein adopts an interesting fold made up of two α-helices and an unusual three-stranded mixed parallel, anti-parallel β-sheet. The folding kinetics and equilibrium unfolding thermodynamics have been analyzed and equilibrium unfolding is well described as two-state (24, 25). The domain can be unfolded by heat, by denaturant or by low pH. The acid induced unfolded state contains residual secondary structure as judged by CD but it is not a molten globule (26). The goal of the present work is to compare the secondary structure propensities of an unfolded state of CTL9 that is populated in the absence of denaturant and the one which is populated under strongly denaturing conditions. The terms unfolded state, denatured state ensemble and denatured state are all found in the literature and there is no convention as to when a particular terminology should be used. We use the term pH 2.0 unfolded state here to refer to the unfolded state populated in the absence of denaturant at pH 2.0.
Figure 1.
The structure of CTL9. (A) Ribbon diagram of residues 58 to 149 of L9 (pdb file code1DIV). The N and C termini are labeled. (B) The primary sequence of CTL9 is shown together with a schematic representation of the different elements of secondary structures (arrows represent β-strands, colored cylinders represent α-helices and 310 helices). The ribbon diagram was constructed using PyMOL.
Results and Discussion
Sequence specific assignments of CTL9 in the pH 2.0 acid unfolded state and in the pH 2.5, 7.6 M urea unfolded state
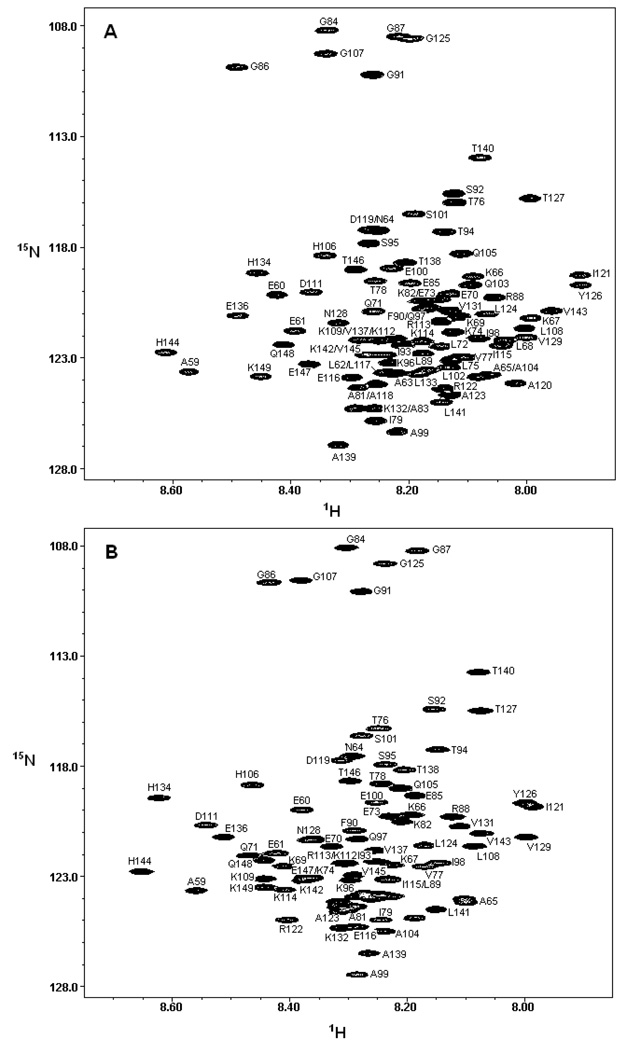
The unfolded state of CTL9 populated at pH 2.0 in the absence of urea and the pH 2.5, 7.6 M urea unfolded state were characterized using 15N, 1H, 13C triple resonance methods. We choose pH 2.5 for the urea unfolded state studies since low pH solutions of high urea concentration require the addition of significant amounts of acid owning to the buffering capability of urea near pH 2.0. Thus adjusting the pH to 2.0 would lead to a noticeable increase in the ionic strength. The pKa’s of all of the acidic residues in the urea unfolded state are expected to be very close to model compound values thus the choice of pH 2.0 or pH 2.5 should not affect the ionization state of any titratable side chains for the high urea studies. The HSQC spectrum of the pH 2.0 unfolded state of CTL9 is typical of that expected for an unfolded protein (Figure 2). A number of clearly resolved resonances are observed but a large number of peaks are clustered together in a limited frequency range, spanning less than 1 ppm in the 1H domain but covering about 20 ppm in the 15N dimension. The limited dispersion is typical of unfolded proteins but is worse in the case of CTL9 because of the small number of aromatic residues in the sequence. The peaks are sharp as expected for a monomeric protein. Previously reported PFG-NMR diffusion experiments have shown that CTL9 is monomeric under the conditions of these studies (26). The HSQC spectrum of the urea unfolded state is also poorly resolved (Figure-2), nevertheless, nearly complete 13C, 1H, 15N backbone, 13Cβ and 1Hβ assignments could be obtained. We also assigned the native state spectrum at pH 3.8 in order to provide a basis for comparison with the unfolded state data. The folded state assignments have been reported for CTL9 at pH 5.5. However, complete 13Cβ assignments are not available in the literature (27). In addition, pH 3.8 is closer to the pH used for the unfolded state studies.
Figure 2.
(A) The 15N-1H HSQC spectrum of the pH 2.0 unfolded state of CTL9. (B) The 15N-1H HSQC spectrum of the pH 2.5, 7.6 M urea unfolded state of CTL9. Peaks are labeled in both spectra. Spectra were collected at 25 °C.
HNCACB and CBCACONH triple resonance experiments were used to establish backbone connectivities for both states. The HNCO and HNCACO experiments were used to confirm these assignments and obtain 13C carbonyl assignments. 1Hα and 1Hβ chemical shifts were obtained from analysis of the HBHACONH spectrum while 13Cβ assignments were determined using the HNCACB experiment. HSQC-TOCSY experiments were used to confirm the assignments and aided in the assignments of resonances in residues immediately proceeding prolines. Complete backbone assignments were determined for 89 out of 92 residues, in the pH 2.0 unfolded state. The sole exceptions are the three prolines (P80, P130 and P135), for which we obtained 13C carbonyl, 13Cα, 13Cβ, 1Hα and 1Hβ assignments but not 15N assignments. 15N and amide 1H assignments were obtained for more than 85 % of the non-proline residues in the urea unfolded state and 13Cα, 1Hα, 13Cβ and 1Hβ assignments were obtained for all but 3 of the non-glycine residues, while 13C carbonyl assignments were made for 89 out of the 92 residues. No peaks could be detected for L62, L102 and L117. Overall at least partial assignments were obtained for 89 out of 92 residues. Native state assignments at pH 3.8 were obtained using the same strategy and are used here to compare with our unfolded state assignments. All of the assignments have been deposited in the BioMagResBank database (http://www.bmrb.wisc.edu/).
Analysis of 13C, 1H and 15N chemical shifts provides evidence for native secondary structure in the unfolded state in the absence of denaturant
It is well known that secondary chemical shifts, i.e., the deviations between observed and random coil chemical shifts, are very sensitive to secondary structure. We analyzed the deviations between our experimentally determined chemical shifts and the random coil values reported for pH 2.3 in 8M urea (28), as reported in NMRView. Since these chemical shifts were measured at pH 2.3, no pH correction is needed. Sequence dependent corrections of 13C carbonyl chemical shifts were made using reported protocols (29).
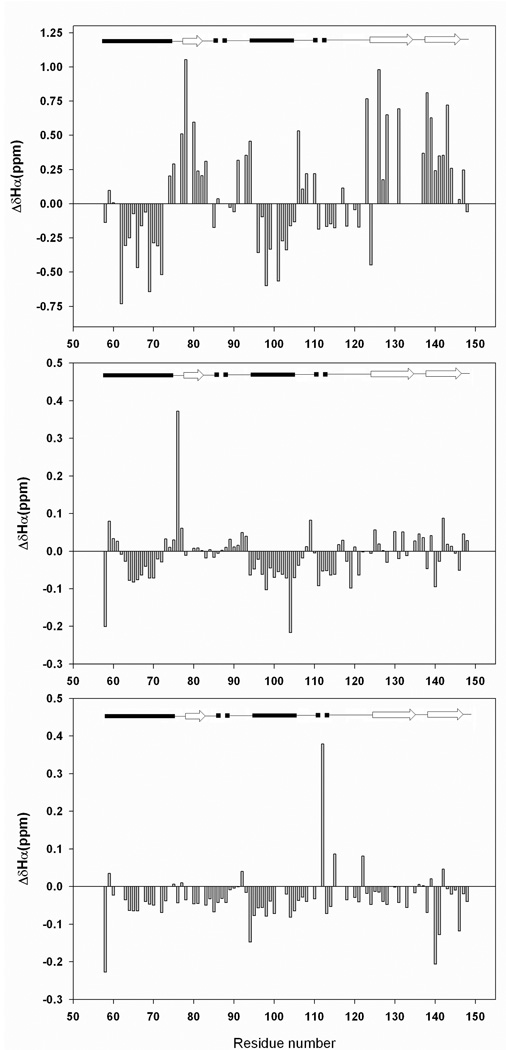
Figure 3 shows plots of the deviations of the Cα 1H chemical shifts. Cα 1H shifts are sensitive to secondary structure and are shifted upfield in α-helices and downfield in β-sheets. The first panel of the figure displays the deviations for the native state at pH 3.8, the second shows the plot for the pH 2.0 unfolded state, and the third panel displays the deviations for the urea unfolded state at pH 2.5. The deviations are large for the folded state, spanning the range of −0.73 ppm to 1.05 ppm. The secondary shifts of the folded state are consistent with the known secondary structure of the protein. As expected, the deviations are much smaller for the pH 2.0 unfolded state but are clearly different from zero. The sequences corresponding to the first and second α helices display contiguous negative deviations. For α-helix-1, the average deviation is −0.05 ppm while it is −0.09 ppm for α-helix-2. For comparison, both of these regions in the native state show average deviations of −0.23 ppm. The deviation from random coil values obtained for the sequence corresponding to the β-sheet exhibit no particular trend. A consecutive set of negative deviations (−0.07 ppm in average) is also observed from residue 112 to 114, a segment forming a 310 helix in the native state. The plot for the urea unfolded state (Figure 3C) displays even smaller negative deviations of Cα 1H chemical shifts, as compared with the pH 2.0 unfolded state. The averages are −0.04 and −0.06 ppm for α-helix-1 and α-helix-2 regions, respectively, while the segment corresponding to the 310 helix does not display any obvious trend. Taken in isolation, the Cα 1H deviations suggest a tendency to populate helical regions of the φ, ψ plot in the pH 2.0 unfolded state for the residues which are helical in the native state. In the urea unfolded state, the tendency to form α-helical structure is much weaker. The data are suggestive, however, Cα 1H secondary shifts are usually small for unfolded proteins and therefore may not be sensitive to small populations of residual secondary structure in a disordered protein. A more accurate and complete picture can be obtained by analyzing the 13Cα, 13Cβ, and 13C carbonyl shifts.
Figure-3.
Plots of the deviations of the measured Cα 1H chemical shifts and random coil chemical shifts. Data plotted as observed-random coil. Random coil values in acidic (pH 2.3) 8M urea were used (28) together with sequence specific corrections (29). (A) Deviations for the native state (pH 3.8); (B) Deviations for the pH 2.0 unfolded state. (C) Deviations for the pH 2.5, 7.6 M urea unfolded state. A schematic representation of the elements of secondary structure of the native state of CTL9 is shown at the top of the figure (arrows represent β-strands, filled cylinders represent α-helices, dashed cylinders represent 310 helices and single lines represent loop regions).
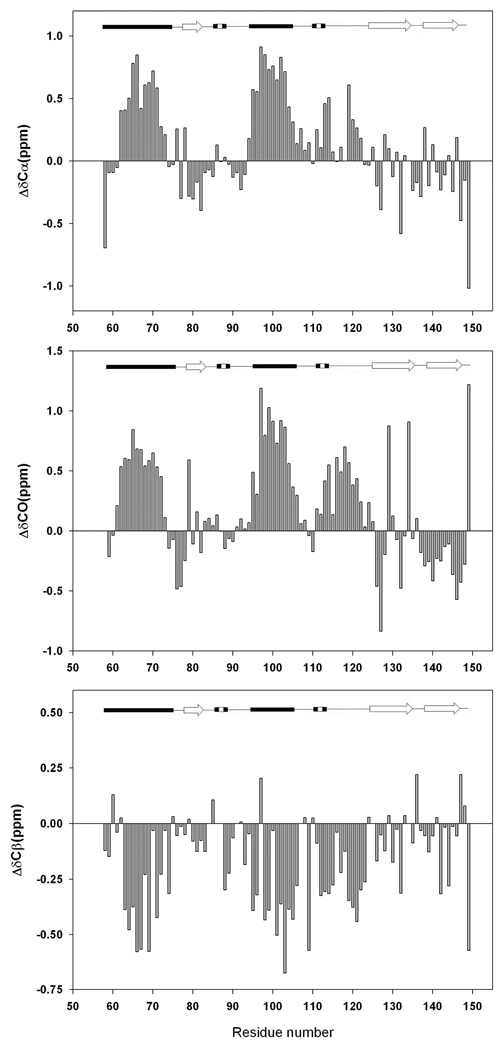
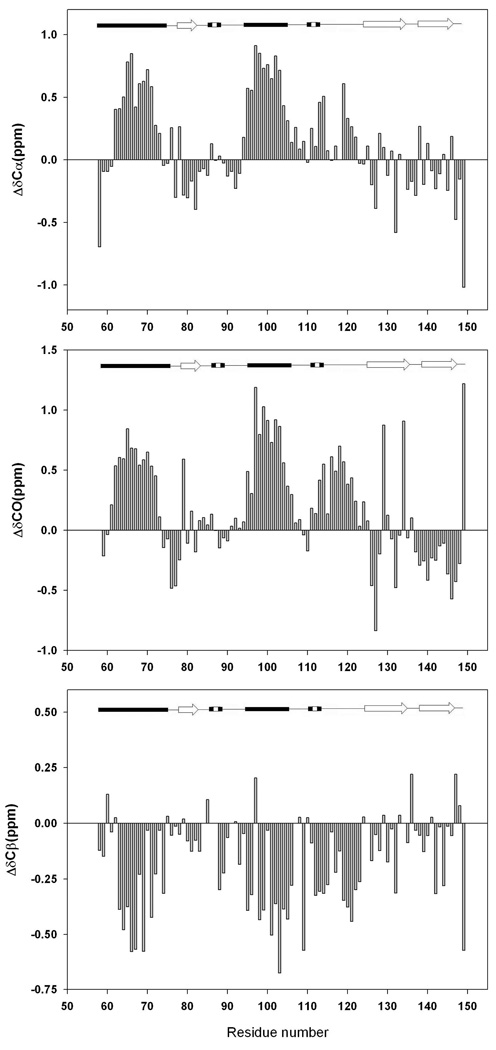
Figure-4 displays plots of the deviations of the 13Cα (Figure-4A), carbonyl 13C (Figure-4B), 13Cβ chemical shifts (Figure-4C) from random coil for the pH 2.0 unfolded state. 13Cα and 13CO shifts are expected to exhibit positive secondary shifts in α-helices and negative secondary shifts in β-strands. The pattern of the 13Cα secondary shifts is consistent with the Cα 1H secondary shifts. The largest deviations are found in the regions which correspond to the two native state α-helices. The average deviation for the segment corresponding to α-helix-1 is 0.32 ppm while it is 0.62 ppm for α-helix-2. Positive deviations are also observed for the loop region which connects α-helix-2 to β-strand-2 (residues 107 to 124), however they are somewhat smaller (0.19 ppm). No strong trend is observed for the β-sheet regions. A similar pattern was observed for the 13CO secondary shifts. The average is 0.41 ppm for α-helix-1 and it is 0.70 ppm in α-helix-2. Smaller positive deviations (0.28 ppm) are observed in the loop region between α-helix-2 and β-strand-2, in agreement with the smaller 13Cα and 1Hα secondary shifts for the region.
Figure-4.
Plots of the deviations of the measured 13C chemical shifts of the pH 2.0 unfolded state of CTL9 from random coil chemical values. Data plotted as observed-random coil. (A) 13Cα chemical shifts deviations, (B) Carbonyl 13C chemical shifts deviations, (C). 13Cβ chemical shifts deviations. Sequence dependent corrections were made (29). A schematic diagram of the elements of secondary structure of the native state of CTL9 is shown at the top of the figure.
13Cβ secondary shifts are also sensitive to secondary structure but the sign of the deviation is reversed relative to that observed for 13Cα shifts (28, 30). The 13Cβ secondary shifts are consistent with the Cα 1H, 13Cα and 13CO secondary shifts. Negative secondary shifts are detected for the segments corresponding to two α-helices in the native state, and for the connection between α-helix-2 and β-strand-2. The average values for α-helical regions are −0.26 ppm and −0.33 ppm, respectively, while the average for the connection region is −0.23 ppm. No consecutive regions of positive deviations are observed for segments corresponding to the three β-strands.
Figure-5 displays plots of the secondary shifts for the 13Cα (Figure-5A), carbonyl 13C (Figure-5B), 13Cβ (Figure-5C) chemical shifts for the pH 2.5, 7.6 M urea unfolded state. No consecutive set of residues can be found to display large secondary shifts. This indicates that the presence of a high concentration of denaturant abolishes most of the residual structure in the pH 2.0 unfolded state, making the urea unfolded state very different from the pH 2.0 unfolded state in terms of the amount of residual secondary structure elements. Consideration of the individual plots of secondary shifts gives rise to a self-consistent picture. Residues corresponding to α-helix-1 and α-helix-2 have a tendency to preferentially populate the helical region of the Ramachandran plot in the pH 2.0 unfolded state in the absence of urea. Also there are suggestive hints for α-helical propensity in the sequence between α-helix-2 and β-strand-2. The results are quite different for the pH 2.5, urea unfolded state. The deviations from random coil values are much smaller and no clear trends are detected.
Figure-5.
Plots of the deviations of the measured 13C chemical shifts of the pH 2.5, 7.6 M urea unfolded state of CTL9 from random coil chemical values. Data plotted as observedrandom coil. (A) 13Cα chemical shifts deviations, (B) Carbonyl 13C chemical shifts deviations, (C) 13Cβ chemical shifts deviations. Random coil values in acidic (pH 2.3) 8M urea were used (28) and sequence dependent corrections were made (29). A schematic diagram of the elements of secondary structure of the native state of CTL9 is shown at the top of the figure.
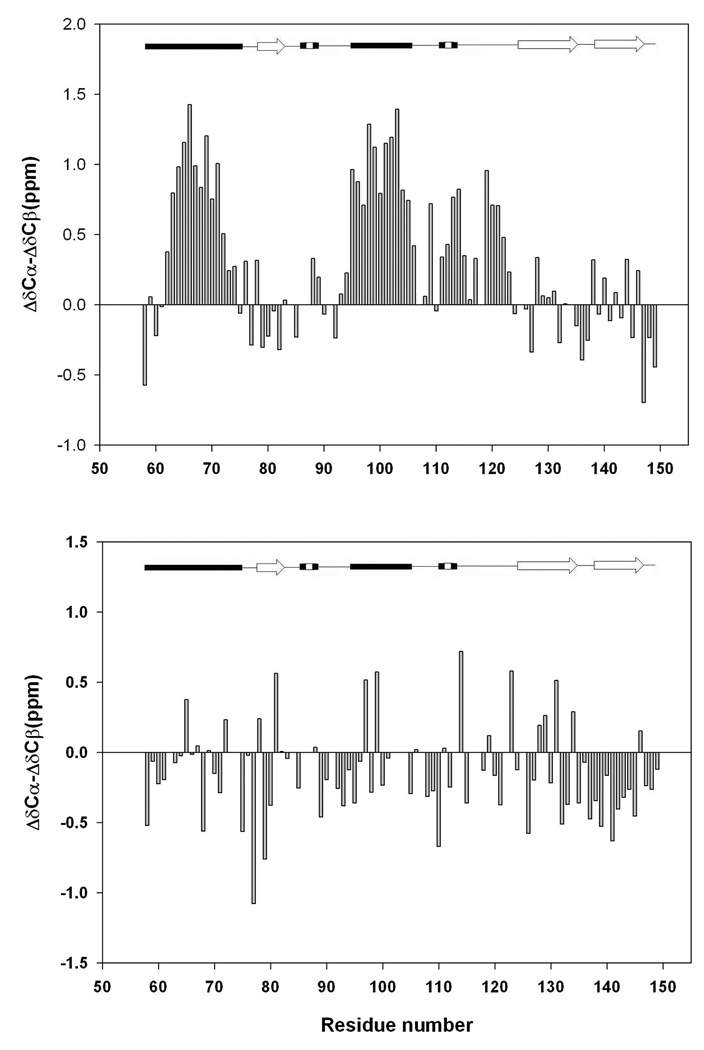
Individual secondary shifts are useful but, recent work has shown that combining these data can provide more reliable information. A common approach is to calculate the difference between 13Cα secondary shifts and 13Cβ secondary shifts. This method has the advantage of canceling out any uncertainty in the chemical shift reference. Positive ΔδCα-ΔδCβ values indicate α-helical structure and negative values indicate propensity to adopt β-strand structure (31). Figure-6 displays the plot of the difference in 13Cα and 13Cβ secondary shifts. Several obvious trends are readily apparent for the pH 2.0 unfolded state. Positive values are observed for α-helix-1 and α-helix-2. The average for α-helix-1 is 0.58 ppm and for α-helix-2 is 0.95 ppm. A set of consecutive positive deviations are observed for the loop between α-helix-2 and β-strand-2 as well. The average for this region, residue 107 to residue 124, is 0.44 ppm. The difference is much smaller for the urea unfolded state and no clear pattern is detected. The average deviation for helix-1 region is −0.10 ppm, while it is −0.02 ppm for helix-2 and only −0.09 ppm for residues 107 to 124.
Figure-6.
A plot of the difference of the secondary shifts of the 13Cα and 13Cβ chemical shifts for (A) the pH 2.0 unfolded state of CTL9 and (B) the pH 2.5, 7.6 M urea unfolded state. A schematic diagram of the elements of secondary structure of the native state of CTL9 is shown at the top of the figure.
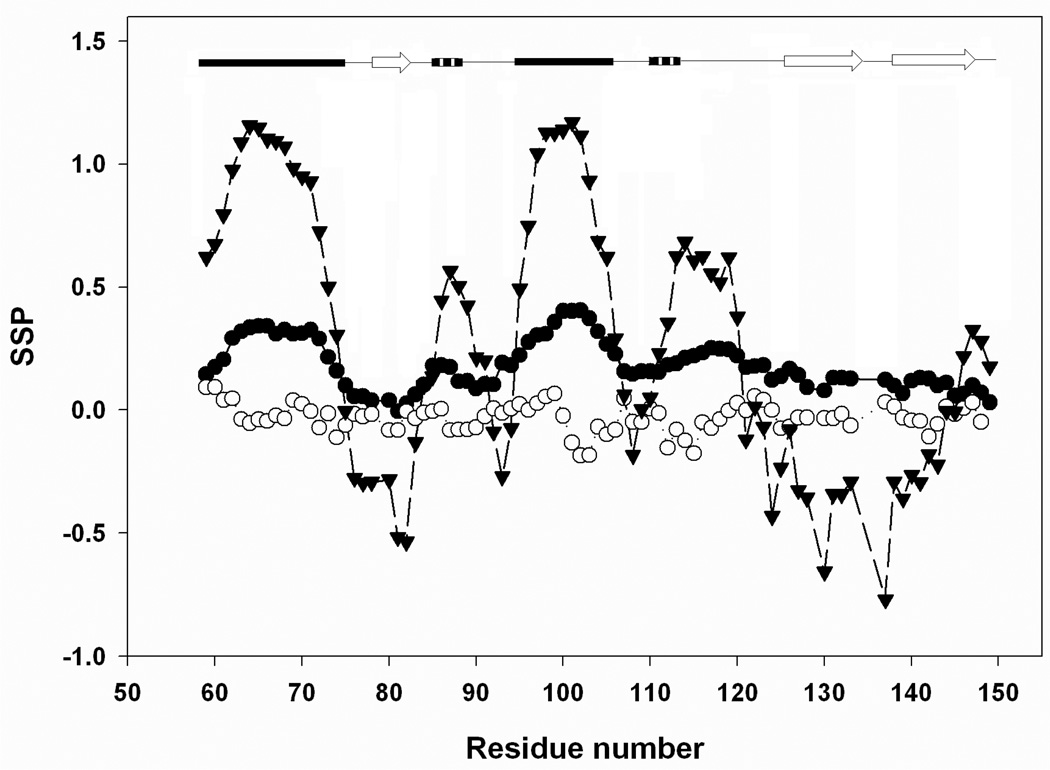
Recently, Forman-Kay and coworkers have used the weighted average of the secondary shifts to probe secondary structure where the weighting factors reflect the relative sensitivity of the secondary shifts to the type of structure. The method, known as SSP analysis, has recently been applied to the synucleins (31). Figure-7 shows the results of the SSP analysis applied to the pH 2.0 unfolded state and to the urea unfolded state. In this analysis, the higher the value of the SSP score, the greater the tendency to adopt helical φ, ψ angles. A value of 1.0 is expected for a residue which adopts helical φ, ψ angles 100% of the time and a value of −1.0 for a residue which exclusively populates the β-sheet region. The analysis is based upon the assumption that an observed secondary shift, relative to the average secondary shift for fully formed secondary structure represents the fractional population of the structure at a particular site. As such, SSP scores should exhibit a correspondence with the propensity to adopt secondary structure. The regions corresponding to α-helix-1 and α-helix-2 clearly have the highest SSP scores for the pH 2.0 unfolded state, with average scores of 0.28±0.07 and 0.32±0.07, respectively. The value for the connection linking α-helix-2 and β-strand-2 is 0.19. On the surface, the positive SSP score for this segment might imply that non-native structure is populated in this region. However, it is also possible that the native fold could generate positive SSP scores. Calculation of the SSP score for the pH 3.8 native state gives an average of 0.25 for residues 107 to 124, indicating that positive SSP values in this segment can result from native state structure, thus it is formally not clear, if the chemical shifts deviations between residues 107 to 124 represent a tendency to populate native or non-native structure (Figure-7). However, the key result is that the SSP analysis is completely consistent with all other measured parameters and indicates a tendency to form structure. The plot clearly reveals that helix propensity is significantly higher in the pH 2.0 unfolded state for regions of the protein that are helical in the native state. In contrast, the urea unfolded state shows no statistically significant tendency to populate non-random structure. The SSP values are −0.01±0.06 for α-helix-1, −0.05± 0.09 for α- helix-2 and −0.04± 0.07 for the connection between α-helix-2 and β-strand-2. Forman-Kay and colleagues have pointed out that 1H Cα secondary shifts can sometimes be unreliable and discussed how their inclusion or exclusion can alter the SSP analysis(31). Consequently, we repeated the analysis without including the 1H Cα secondary shifts. The overall shape of plot is essentially unaltered and the conclusions are not affected (supplementary material).
Figure-7.
SSP analysis of the pH 2.0 (●) and the pH 2.5, 7.6 M urea (○) unfolded state of CTL9 conducted using the method of Forman-Kay and coworkers (26). The calculation for the pH 3.8 native state is included for comparison (▼). Positive values represent a propensity to populate the helical region of the φ, ψ map while negative values indicate a preference for the β-sheets region. A schematic diagram of the elements of secondary structure of the native state of CTL9 is shown at the top of the figure. 13Cα, 13Cβ and Cα 1H chemical shifts were used in the analysis.
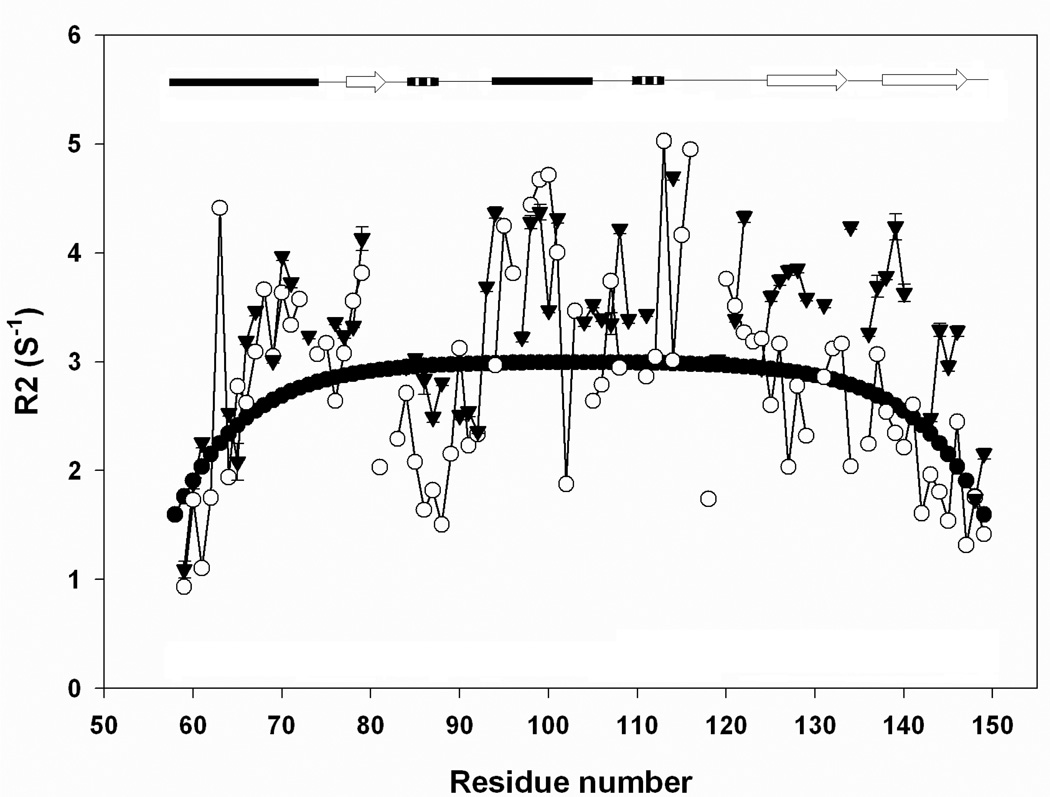
15N R2 relaxation rates have been used to detect apparent deviations from random coil behavior in unfolded proteins. Schwalbe and coworkers have pioneered the approach (5, 32). In their analysis, relaxation data is fit to a purely phenomenological model which assumes that the R2 value at a particular residue is correlated with the values of R2 at residues adjacent in primary sequence. The length of the correlated segment can, at some level, be viewed as being related to the persistence length. For a chain with only local interactions, a characteristic inverted U shape is predicted. Deviations from the predicted curve are typically taken to represent persistent clustering of hydrophobic side chains, although an atomic level description of the origin of the effect is not available. Figure-8 compares plots of the measured R2 values and the R2 values calculated using the random coil model. The calculated R2 values follow an inverted U-shaped curve, showing uniform relaxation rates in the middle of the polypeptide chain, with an average of 2.74 s−1. Smaller rates are observed at both terminal of the chain. There are no significant differences between the experimental data for the pH 2.0 unfolded state and the urea unfolded state. There are deviations from the phenomenological “random coil” model for both data sets, but these are smaller than what have been observed for other proteins (32, 33). The simplest interpretation of the relaxation data is that there are no long lived clusters in the unfolded state(s), of course one should bear in mind that the analysis involves comparison of experimental data to a phenomenological model.
Figure-8.
A plot of 15N R2 rates for the pH 2.0 unfolded state (○) and the pH 2.5, 7.6 M urea unfolded state (▼). The solid line is the best fit to the phenomenological model of Schwalbe and coworkers (5).
Conclusions
We have obtained essentially complete 1H, 13C and 15N backbone assignments, as well as 13Cβ and 1H Cβ assignments for the pH 2.0 unfolded state of CTL9 and virtually complete assignments for the pH 2.5 urea unfolded state. The secondary shifts, the difference between the 13Cα and 13Cβ secondary shifts and the SSP analysis all yield a self consistent picture; namely that residues which are helical in the native state have a propensity to preferentially populate helical φ, ψ angles in the pH 2.0 unfolded state. Residues 107 to 124, which form the connection between the second α-helix and the second β-strand, also exhibit a clear, albeit reduced, tendency to preferentially sample the helical region of the Ramachandran plot. Thus the unfolded state of CTL9 contains significant secondary structure in the absence of denaturant. There is a very good correlation between the regions predicted by the chemical shift analysis to sample helical φ, ψ angles and the regions predicted to have the highest helical propensity by the AGADIR algorithm of Serrano and coworkers (34). AGADIR predicts that the first and second α-helices and the loop connecting the second α-helix to the second β-sheet have the highest helical propensity in CTL9 (supplementary material). The urea unfolded state is very different and displays, as judged by the NMR analysis, no tendency to preferentially populate secondary structure.
It is difficult to precisely deduce the fractional population of a particular type of secondary structure from analysis of chemical shift data alone but the SSP method appears to be the most promising approach. It is thus interesting to compare the SSP analysis to estimates of the helical content based upon CD measurements. The mean residual ellipticity of the pH 2.0 unfolded state is −4900 deg cm−1mol−1 at 222 nm. The apparent fractional population of helix can be estimated from CD spectra if values for a fully helical peptide and for an unstructured peptide are known. The largest ambiguity arises in the choice of the ellipticity value for the random coil state. If we use the actual ellipticity measured in 8M urea, we obtain an estimate of 8.2 % α-helix. If, instead, we use empirical relations derived by Baldwin and coworkers, we obtain a value of 12.6 % α-helix (35). The SSP analysis leads to a somewhat higher predicted fraction of α-helix. The average SSP score for the entire sequence is 0.21, which, in the simplest interpretation corresponds to 21 % α-helix (a SSP score of 1.0 is taken to represent a 100% tendency to populate helical φ, ψ angles). The discrepancy may reflect difficulties associated with using the SSP methodology to precisely quantify the relative population of secondary structure. Of course, difficulties in interpreting the CD spectra of partially structured polypeptides could play a factor too. However it is worth bearing in mind that CD and chemical shifts have a fundamentally different sensitivity to helical structure and we believe this is the most likely explanation. Secondary shifts are largely local in origin and a short segment of chain that exclusively populates the helical region of φ, ψ space would give rise to SSP scores near 1.0. In contrast, the CD signal of α-helices is well known to depend on the length of the helix and short helices can give rise to much weaker intensity at 222 nm than longer helices (36). Thus the difference between the NMR and CD analysis could reflect a tendency for individual residues or short sections of the chain to adopt helical φ, ψ angles even though there is a much more modest propensity for a consecutive set of segment of residues to cooperatively sample helical conformations. Details aside, the NMR studies and CD measurements both demonstrate that the low pH unfolded state of CTL9 clearly deviates from the classic random coil model.
At first glance, the observation of helical structure in the low pH unfolded state may seem to be at variance with hydrodynamic measurements. Those studies showed the pD 2.1 unfolded state has the same radius of hydration, Rh = 33.5 Ǻ, as the urea unfolded state at pD 3.8, Rh = 33.6 Ǻ, even though the urea unfolded state has much less, if any, residual helical structure (26). In addition, the R2 data collected here for the pH 2.0 unfolded state and the pH 2.5, urea unfolded state are broadly similar. The apparent discrepancy simply reflects the fact that global parameters such as Rh or Rg can be insensitive to the presence of even significant amounts of secondary structure. This effect has been predicted based upon computational studies by Pande and coworkers (19). Those workers compared the calculated scattering profiles of random-flight chains to identical sequences that contained segments of α-helical structure. They found that the calculated values of Rg were very similar even though the sequences have quite different amounts of secondary structure. CTL9 provides a striking experimental example of this principle.
It is interesting to consider the results in light of a recently published analysis of the transition state of the folding of CTL9(25). That study made use of φ-value approaches and found that the largest φ-values were localized in the β-hairpin encompassing β-strands two and three and the connecting loop. Small φ-values were observed in mutations in both helix-1 and helix-2. Small φ-values, in the absence of the unfolded state effects, indicate that the region being probed is no more structured in the transition state than in the unfolded state. However, small φ-values do not necessarily mean that the region of the protein being studied is devoid of structure in the transition state. Instead, small φ-values could arise because the region is similarly structured in both the unfolded state and the transition state(37), thus there is a structural ambiguity in the interpretation of small φ-values. The analysis presented here indicates that the two helices are partially formed in the unfolded state and thus also partially structured in the transition state for folding.
Materials and Methods
Protein expression and purification
Uniformly 15N-labeled and 13C, 15N-labeled CTL9 was expressed in Escherichia coli BL21 cells in M9 minimal media. The media for expressing 15N-labeled protein contains 0.8 g/L 15NH4Cl as the sole nitrogen source and 10 g/L glucose as the sole carbon source, while 0.8 g/L 15NH4Cl and 10 g/L 13C-glucose were used in the expression of 13C, 15N-labeled CTL9. Ampicillin was added to the main media at a concentration of 100 mg/L. The cells were grown at 37 °C until the optical density (O.D.) at 600 nm reached 0.7, at which point 100 mg/L IPTG was added to induce expression. After 4 hours, cells were harvested and then lysed by sonication. The protein was purified as described previously (24). The molecular mass of the protein was confirmed by mass spectrometry.
NMR sample preparation
Protein samples for NMR experiments were prepared in 10% D2O at pH 2.0, no urea or at pH 2.5, in 7.6 M urea, both at a concentration of about 1 mM. The urea concentration was determined by refractometry. The sample used for the native state assignments was prepared in 20 mM sodium acetate and 100 mM NaCl at pH 3.8.
NMR spectroscopy
All heteronuclear NMR experiments were performed on uniformly 15N-labeled or 13C, 15N-labeled protein samples. All NMR spectra were recorded on a 700 or an 800 MHz Bruker spectrometer with a cryoprobe at the New York Structural Biology Center at 25 °C. In all NMR experiments, the 1H dimension was centered at the water resonance and the 15N offset frequency was set to 118.0 ppm.
15N-1H correlated heteronuclear single coherence (HSQC) spectra were collected using 1024 × 256 complex points and with 8 scans per increment. The spectra widths of the pH 2.0 sample were 7183.9 Hz and 2027.2 Hz for the 1H and 15N dimensions, respectively. The pH 2.5, in 7.6 M urea sample had spectra widths of 6009.6 Hz (1H) and 1561.0 Hz (15N).
The following set of triple resonance experiments performed on a 13C, 15N-labeled sample of CTL9 were used to generate backbone assignments: HNCO, HN(CA)CO, HNCACB and CBCACONH. In the HNCACB and CBCACONH experiments, the 13C offsets were 39.0 ppm, whereas the 13C offsets were set at 176.0 ppm in the HNCO and HN(CA)CO experiments. For the pH 2.0 unfolded CTL9, the HNCACB and CBCACONH spectra were recorded with 1024 × 80 × 160 complex points, with spectra widths of 7183.9 Hz, 2027.2 Hz and 13076.2 Hz, in the 1H, 15N, and 13C dimensions, respectively. The HNCO and HN(CA)CO spectra were acquired with 1024(1H) × 72(15N) × 144(13C) complex points, with spectra widths of 7183.9 Hz (1H), 2027.2 Hz (15N) and 3018.4 Hz (13C). For the pH 2.5, 7.6 M urea unfolded CTL9, the datasets for the HNCACB and CBCACONH spectra comprised 1024(1H) × 72(15N) × 128(13C) complex points. The spectra widths were 6009.6 Hz, 1561.0 Hz and 13210.04 Hz in the 1H, 15N and 13C dimensions, respectively. The HNCO and HN(CA)CO spectra were acquired with 1024(1H) × 72(15N) × 128(13C) complex points, with spectra widths of 6009.6 Hz (1H), 1561.0 Hz (15N) and 2816.9 Hz (13C).
3D HBHACONH experiments were carried out to determine the 13Cα 1H and 13Cβ 1H chemical shifts. For the pH 2.0 unfolded sample, the HBHACONH spectrum was collected with 1024 × 80 × 160 complex points, with spectra widths of 7183.9 Hz (direct 1H dimension), 2027.2 Hz (15N) and 7200.72 Hz (indirect 1H dimension). For the pH 2.5, 7.6 M urea unfolded sample, the spectra widths were 6009.6 Hz (direct 1H dimension), 1561.0 Hz (15N) and 7001.1 Hz (indirect 1H dimension) with 1024 (direct 1H dimension) × 72 (15N) × 128 (indirect 1H dimension) complex points, respectively.
A 3D TOCSY-HSQC experiment was performed on a 15N-labeled sample for the pH 2.0 unfolded state. A mixing time of 75 ms was used. The spectrum was recorded using a data matrix of 1024(direct 1H dimension) × 128(15N) × 256(indirect 1H dimension). Spectra widths were 8012.8 Hz in the direct 1H dimension, 2432.9 Hz in the 15N dimension and 8001.6 Hz in the indirect 1H dimension.
Measurement of transverse relaxation rates
The relaxation experiments were carried out as described (38). The spectra were collected at 10 delay times: 16.32 ms, 32.64 ms, 48.96 ms, 65.28 ms, 81.60 ms, 97.92 ms, 114.24 ms, 130.56 ms, 146.88 ms and 163.20 ms. Repeat measurements were made at 32.64 ms, 48.96 ms, 97.92 ms and 163.2 ms to allow estimation of uncertainty. Each T2 experiment was acquired with 4 scans using 1024 × 256 complex points. The spectra widths were 9615.4 Hz (1H) and 2027.7 Hz (15N) for the pH 2.0 unfolded state, and they were 7183.9 Hz (1H) and 2027.6 Hz (15N) for the pH 2.5, 7.6 M urea unfolded state. Recycle delay of 3 S was used.
Date processing and analysis
All spectra were processed using NMRPipe (39) and chemical shifts assignments were made using NMRView (40). All chemical shifts were referenced to the absolute frequency of DSS at zero ppm. Sequence dependent corrections of the chemical shifts were made using methods developed by Schwarzinger, Wright, Dyson and coworkers (29). Random coil values in acidic (pH 2.3) 8M urea (28) were used to calculate the secondary chemical shifts, except that the values used for Glu and Val 13Cβ random coil shifts are those reported in NMRView algorithm. SSP analysis was performed using the method of Forman-Kay as described (31). The software provided at their website at http://pound.med.utoronto.ca/software.html was used. R2 relaxation rates were determined using the automated program in NMRView by fitting the peak intensities to equation 1 which describes a two-parameter exponential decay:
| (1) |
where I(t) is the peak intensity after a delay of time t and I0 is the intensity at the time point t=0. The R2 rates were analyzed using a simple model by fitting the experimental R2 rates to equation 2:
| (2) |
where R2(i) is the experimental R2 value for residue i, R2(int) is the intrinsic relaxation rate which depends on the temperature and the viscosity of the solution, λ is the persistence length of the chain and N is the total number of residue in the protein (5).
Supplementary Material
Acknowledgements
We thank Prof. David Hoffman for providing the pH 5.5 native state assignments of CTL9 and we thank Dr. Ying Li for her contributions to the initial stages of this project.
This work was supported by NIH grants GM70941 (DPR) and AG019391 and AG025440 (DE). DPR, SB and DE are members of the New York Structural Biology Center, which is a STAR center supported by the New York State Office of Science, Technology and Academic Research, is supported by NIH grant P41 GM66354, and received funds from NIH, USA, the Keck Foundation, New York State, and the NYC Economic Development Corporation for the purchase of 900 MHz spectrometers.
Abbreviations used
- CTL9
the C-terminal domain of the ribosomal protein L9
- DSS
2,2-Dimethyl-2-silapentane-5-sulfonate sodium salt
- PFG-NMR
Pulse field gradient nuclear magnetic resonance
- Rg
Radius of gyration
- Rh
Radius of hydration.
Footnotes
Supplementary Data
Supplementary data associated with this article can be found, in the online version at http://pubs.acs.org. It consists of a figure showing the results of the SSP analysis conducted with the exclusion of the Cα 1H chemical shifts and a figure showing the results of the AGADIR analysis, as well as a table of 15N R2 values measured for the pH 2.0 and pH 2.5, 7.6 M urea unfolded states, and the assignments for the pH 2.0 unfoled state and the pH 2.5, 7.6 M urea unfolded state.
References
- 1.Baldwin RL. A new perspective on unfolded proteins. Advan. Protein Chem. 2002;62:361–367. doi: 10.1016/s0065-3233(02)62014-5. [DOI] [PubMed] [Google Scholar]
- 2.Dyson HJ, Wright PE. Intrinsically unstructured proteins and their functions. Nature Rev. Mol. Cell Biol. 2005;6:197–208. doi: 10.1038/nrm1589. [DOI] [PubMed] [Google Scholar]
- 3.Cho JH, Sato S, Raleigh DP. Thermodynamics and kinetics of nonnative interactions in protein folding: a single point mutant significantly stabilizes the N-terminal domain of L9 by modulating non-native interactions in the denatured state. J. Mol. Biol. 2004;338:827–837. doi: 10.1016/j.jmb.2004.02.073. [DOI] [PubMed] [Google Scholar]
- 4.Mok YK, Elisseeva EL, Davidson AR, Forman-Kay JD. Dramatic stabilization of an SH3 domain by a single substitution: roles of the folded and unfolded states. J. Mol. Biol. 2001;307:913–928. doi: 10.1006/jmbi.2001.4521. [DOI] [PubMed] [Google Scholar]
- 5.Klein-Seetharaman J, Oikawa M, Grimshaw SB, Wirmer J, Duchardt E, Ueda T, Imoto T, Smith LJ, Dobson CM, Schwalbe H. Long-range interactions within a nonnative protein. Science. 2002;295:1719–1722. doi: 10.1126/science.1067680. [DOI] [PubMed] [Google Scholar]
- 6.Cho JH, Raleigh DP. Mutational analysis demonstrates that specific electrostatic interactions can play a key role in the denatured state ensemble of proteins. J. Mol. Biol. 2005;353:174–185. doi: 10.1016/j.jmb.2005.08.019. [DOI] [PubMed] [Google Scholar]
- 7.Pace CN, Alston RW, Shaw KL. Charge-charge interactions influence the denatured state ensemble and contribute to protein stability. Protein Sci. 2000;9:1395–1398. doi: 10.1110/ps.9.7.1395. [DOI] [PMC free article] [PubMed] [Google Scholar]
- 8.Dill KA, Shortle D. Denatured states of proteins. Annu. Rev. Biochem. 1991;60:795–825. doi: 10.1146/annurev.bi.60.070191.004051. [DOI] [PubMed] [Google Scholar]
- 9.Yao J, Chung J, Eliezer D, Wright PE, Dyson DJ. NMR structural and dynamic characterization of the acid-unfolded state of apomyoglobin provides insights into the early events in protein folding. Biochemistry. 2001;40:3561–3571. doi: 10.1021/bi002776i. [DOI] [PubMed] [Google Scholar]
- 10.Shortle DR. Structural analysis of non-native states of proteins by NMR methods. Curr. Opin. Struct. Biol. 1996;6:24–30. doi: 10.1016/s0959-440x(96)80091-1. [DOI] [PubMed] [Google Scholar]
- 11.Choy WY, F.-K JD. Calculation of ensembles of structures representing the unfolded state of an SH3 domain. J. Mol. Biol. 2001:1011–1032. doi: 10.1006/jmbi.2001.4750. [DOI] [PubMed] [Google Scholar]
- 12.Lindorff-Larson K, Kristjansdottir S, Teilum K, Fieber W, Dobson CM, Poulsen FM, Vendruscolo M. Determination of an ensemble of structures representing the denatured state of the bovine acyl-coenzyme a binding protein. J. Am. Chem. Soc. 2004;126:3291–3299. doi: 10.1021/ja039250g. [DOI] [PubMed] [Google Scholar]
- 13.Zhang O, Forman-Kay JD. NMR studies of unfolded states of an SH3 domain and a stable mutant. Biochemistry. 1997;44:15550–15560. [Google Scholar]
- 14.Kohn JE, Millett IS, Jacob J, Zagrovic B, Dillon TM, Cingel N, Dothager RS, Seifert S, Thiyagarajan P, Sosnick TR, Hasen MZ, Pande VS, Ruczinski I, Doniach S, Plaxco KW. Random-coil behavior and the dimensions of chemically unfolded proteins. Proc. Natl. Acad. Sci. USA. 2004;101:12491–12496. doi: 10.1073/pnas.0403643101. [DOI] [PMC free article] [PubMed] [Google Scholar]
- 15.Dyson JH, Wright PE. Insights into the structure and dynamics of unfolded proteins from nuclear magnetic resonance. Advan. Protein Chem. 2002;62:311–340. doi: 10.1016/s0065-3233(02)62012-1. [DOI] [PubMed] [Google Scholar]
- 16.Fitzkee NC, Rose GD. Reassessing random-coil statistics in unfolded proteins. Proc. Natl. Acad. Sci. USA. 2004;101:12497–12502. doi: 10.1073/pnas.0404236101. [DOI] [PMC free article] [PubMed] [Google Scholar]
- 17.Mittag T, Forman-Kay JD. Atomic-level characterization of disordered protein ensembles. Curr. Opin. Struct. Biol. 2007;17:3–14. doi: 10.1016/j.sbi.2007.01.009. [DOI] [PubMed] [Google Scholar]
- 18.Goldenberg DP. Computational simulation of the statistical properties of unfolded proteins. J. Mol. Biol. 2003;326:1615–1633. doi: 10.1016/s0022-2836(03)00033-0. [DOI] [PubMed] [Google Scholar]
- 19.Zagrovic B, Pande VS. Structural correspondence between the α-helix and the random-flight chain resolves how the unfolded proteins can have native-like properties. Nature Struct. Biol. 2003;10:955–961. doi: 10.1038/nsb995. [DOI] [PubMed] [Google Scholar]
- 20.Neri D, Billeter M, Wider G, Wuthrich K. NMR determination of residual structure in a urea-denatured protein, the 434-repressor. Science. 1992;257:1559–1563. doi: 10.1126/science.1523410. [DOI] [PubMed] [Google Scholar]
- 21.Religa TL, Markson JS, Mayor U, Freund SMV, Fersht AR. Solution structure of a protein denatured state and folding intermediate. Nature. 2005;437:1053–1056. doi: 10.1038/nature04054. [DOI] [PubMed] [Google Scholar]
- 22.Eliezer D. Characterization residual structure in disordered protein states using nuclear magnetic resonance. Methods Mol. Biol. 2007;350:49–67. doi: 10.1385/1-59745-189-4:49. [DOI] [PMC free article] [PubMed] [Google Scholar]
- 23.Cavanagh J, Fairbrother WJ, Palmer AG, Skelton NJ. Protein NMR spectroscopy: Principles and practice. San Diego, California: Academic Press, Inc.; 1996. [Google Scholar]
- 24.Sato S, Raleigh DP. pH-dependent stability and folding kinetics of a protein with an unusual alpha-beta topology: the C-terminal domain of the ribosomal protein L9. J. Mol. Biol. 2002;345:163–173. doi: 10.1016/S0022-2836(02)00015-3. [DOI] [PubMed] [Google Scholar]
- 25.Li Y, Gupta R, Cho JH, Raleigh DP. Mutational analysis of the folding transition state of the C-terminal domain of ribosomal protein L9: A protein with an unusual β-sheet topology. Biochemistry. 2006;46:1013–1021. doi: 10.1021/bi061516j. [DOI] [PubMed] [Google Scholar]
- 26.Li Y, Picart F, Raleigh DP. Direct characterizatoin of the folded, unfolded and urea-denatured states of the C-terminal domain of the ribosomal protein L9. J. Mol. Biol. 2005;349:839–846. doi: 10.1016/j.jmb.2005.04.017. [DOI] [PubMed] [Google Scholar]
- 27.Hoffman DW, Cameron SC, Davies S, White SW, Ramakrishnan V. Ribosomal Protein L9: A structure determination by the combined use of X-ray crystallography and NMR spectroscopy. J. Mol. Biol. 1996;264:1058–1071. doi: 10.1006/jmbi.1996.0696. [DOI] [PubMed] [Google Scholar]
- 28.Schwarzinger S, Kroon GJA, Foss TR, Wright PE, Dyson HJ. Random coil chemical shifts in acidic 8M urea: Implementation of random coil shift data in NMRView. J. Biol. NMR. 2001;18:43–48. doi: 10.1023/a:1008386816521. [DOI] [PubMed] [Google Scholar]
- 29.Schwarzinger S, Kroon GJA, Foss TR, Chung J, Wright PE, Dyson HJ. Sequence-dependent correction of random coil NMR chemical shifts. J. Am. Chem. Soc. 2001;123:2970–2978. doi: 10.1021/ja003760i. [DOI] [PubMed] [Google Scholar]
- 30.Wishart DS, Bigam CG, Holm A, Hodges RS, Sykes BD. 1H, 13C and 15N random coil NMR chemical shifts of the common amino acids. I. Investigations of nearest-neighbor effects. J. Biol. NMR. 1995;5:67–81. doi: 10.1007/BF00227471. [DOI] [PubMed] [Google Scholar]
- 31.Marsh JA, Singh VK, Jia Z, Forman-Kay JD. Sensitivity of secondary structure propensities to sequence differences between α- and γ- synuclein: Implications for fibrillation. Protein Sci. 2006;15:2795–2804. doi: 10.1110/ps.062465306. [DOI] [PMC free article] [PubMed] [Google Scholar]
- 32.Schwalbe HFKM, Buck M, Jones JA, Grimshaw SB, Spencer A, Glaser SJ, Smith LJ, Dobson CM. Structural and dynamical properties of a denatured protein. Heteronuclear 3D NMR experiments and theoretical simulations of lysozyme in 8 M urea. Biochemistry. 1997;36:8977–8991. doi: 10.1021/bi970049q. [DOI] [PubMed] [Google Scholar]
- 33.Platt GW, McParland VJ, Kalverda AP, Homans SW, Radford SE. Dynamics in the unfolded state of β2-microglobulin studied by NMR. J. Mol. Biol. 2005;346:279–294. doi: 10.1016/j.jmb.2004.11.035. [DOI] [PubMed] [Google Scholar]
- 34.Lacroix E, Viguera AR, Serrano L. Elucidating the folding problem of α-helices: Local motifs, long-range electrostatics, ionic strength dependence and prediction of NMR parameters. J. Mol. Biol. 1998;284:173–191. doi: 10.1006/jmbi.1998.2145. [DOI] [PubMed] [Google Scholar]
- 35.Luo P, Baldwin RL. Mechanism of helix induction by trifluoroethanol: A framework for extrapolating the helix-forming properties of peptides from trifluoroethanol/water mixtures back to water. Biochemistry. 1997;36:8413–8421. doi: 10.1021/bi9707133. [DOI] [PubMed] [Google Scholar]
- 36.Chin DH, Woody RW, Rohl CA, Baldwin RL. Circular dichroism spectra of short, fixed-nucleus alanine helices. Proc. Natl. Acad. Sci. USA. 2002;99:15416–15421. doi: 10.1073/pnas.232591399. [DOI] [PMC free article] [PubMed] [Google Scholar]
- 37.Luisi DL, Kuhlman B, Sideras K, Evans PA, Raleigh DP. Effects of varying the local propensity to form secondary structure on the stability and folding kinetics of a rapid folding mixed α/β protein: characterization of a truncation mutant of the N-terminal domain of the ribosomal protein L9. J. Mol. Biol. 1999;289:167–174. doi: 10.1006/jmbi.1999.2742. [DOI] [PubMed] [Google Scholar]
- 38.Farrow NA, Muhandiram R, Singer AU, Pascal SM, Kay CM, Gish G, Shoelson SE, Pawson T, Forman-Kay JD, Kay LE. Backbone dynamics of a free and a phosphopeptide-complexed Src homology 2 domain studied by 15N NMR relaxation. Biochemistry. 1994;33:5984–6003. doi: 10.1021/bi00185a040. [DOI] [PubMed] [Google Scholar]
- 39.Delaglio F, Grzesiek S, Vuister GW, Zhu G, Pfeifer J, Bax A. NMRPipe-a multi-dimensional spectral processing system based on Unix Pipes. J. Biomol. NMR. 1995;6:277–293. doi: 10.1007/BF00197809. [DOI] [PubMed] [Google Scholar]
- 40.Johnson BA. Using NMRView to visualize and analyze NMR spectra of macromolecules. Methods Mol. Biol. 2004;278:313–352. doi: 10.1385/1-59259-809-9:313. [DOI] [PubMed] [Google Scholar]
Associated Data
This section collects any data citations, data availability statements, or supplementary materials included in this article.


