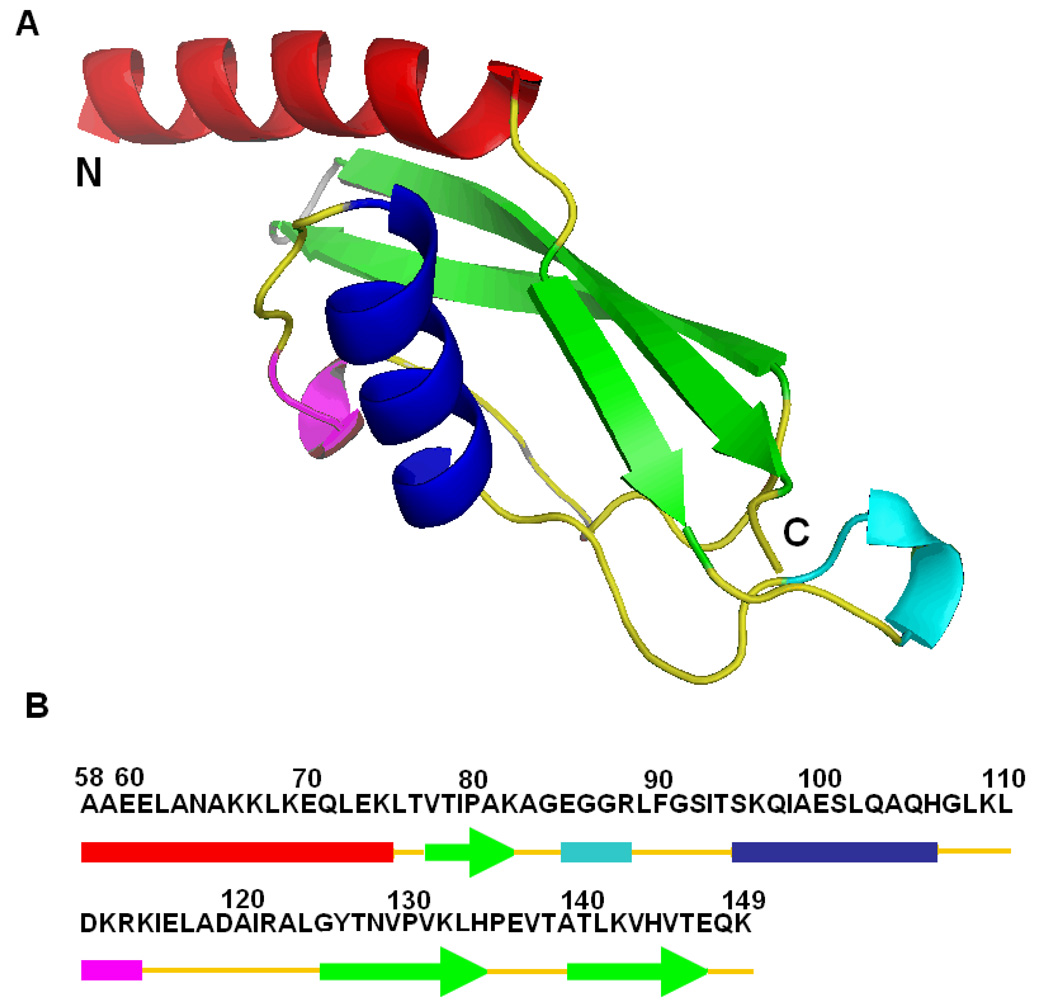
Figure 1.
The structure of CTL9. (A) Ribbon diagram of residues 58 to 149 of L9 (pdb file code1DIV). The N and C termini are labeled. (B) The primary sequence of CTL9 is shown together with a schematic representation of the different elements of secondary structures (arrows represent β-strands, colored cylinders represent α-helices and 310 helices). The ribbon diagram was constructed using PyMOL.

