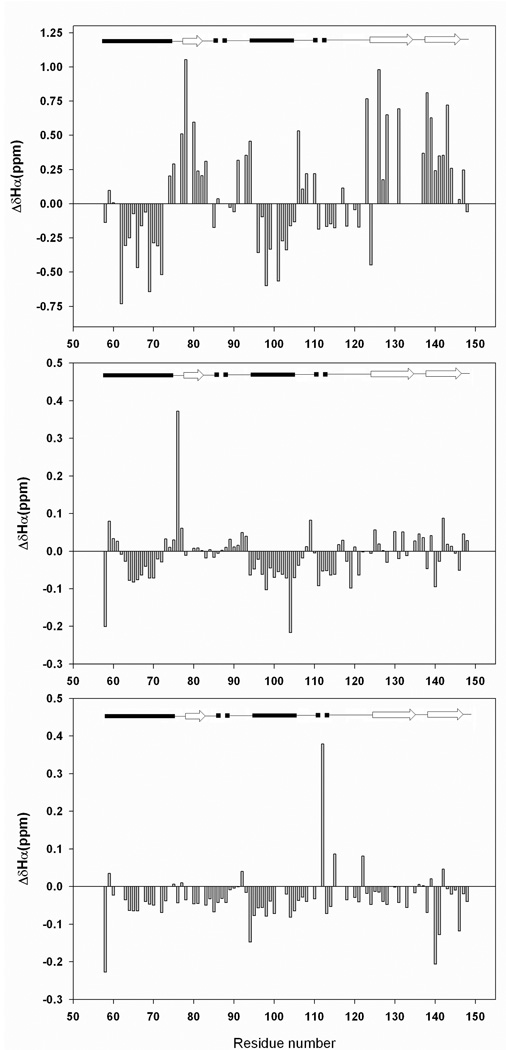
Figure-3.
Plots of the deviations of the measured Cα 1H chemical shifts and random coil chemical shifts. Data plotted as observed-random coil. Random coil values in acidic (pH 2.3) 8M urea were used (28) together with sequence specific corrections (29). (A) Deviations for the native state (pH 3.8); (B) Deviations for the pH 2.0 unfolded state. (C) Deviations for the pH 2.5, 7.6 M urea unfolded state. A schematic representation of the elements of secondary structure of the native state of CTL9 is shown at the top of the figure (arrows represent β-strands, filled cylinders represent α-helices, dashed cylinders represent 310 helices and single lines represent loop regions).

