Abstract
Purpose:
Noninvasive in vivo cell-tracking techniques are necessary to advance the field of cellular-based therapeutics as well as to elucidate mechanisms governing in vivo cell biology. Fluorescence is commonly used for in vitro and postmortem biomedical studies but has been limited by autofluorescence at the whole-animal level.
Procedures:
In this report, we demonstrate the ability of in vivo fluorescent lifetime imaging to remove autofluorescence and thereby enable in vivo dendritic cell tracking in naïve mice. Specifically, we track mature dendritic cells (DCs) labeled internally with near-infrared-emissive polymersomes (NIR-DCs).
Results:
We establish the ability to detect labeled cells in vivo and image NIR-DC trafficking after both intravenous and subcutaneous delivery. In addition, we demonstrate the longitudinal capacity of this method by characterizing NIR-DC migration kinetics in the popliteal lymph node.
Conclusions:
This work provides a tool to evaluate dendritic-cell-based immunotherapy and generates novel opportunities for in vivo fluorescence imaging.
Keywords: in vivo, Optical imaging, Fluorescence lifetime, Autofluorescence, Polymersomes, Near-infrared, Tat, Dendritic cells, Cell tracking
Introduction
Dendritic cell (DC)-based vaccines are one example of several strategies to use cells as therapeutic vehicles against disease [1, 2]. The ability to noninvasively track administered cell therapies in vivo would be an invaluable tool. Optical imaging is an inexpensive and high-throughput tool for imaging in murine models. To date, bioluminescence imaging (BLI) has dominated the cell-tracking field [3-5]. In this approach, cells are engineered to express a luciferase light-emitting enzyme. For example, the most commonly used enzyme, firefly luciferase, which emits light (λmax, 37°C=612 nm) upon interaction with an injected substrate such as d-luciferin [6]. BLI does not need an excitation light source, which minimizes background [6-8]. However, luciferin biodistribution and kinetics greatly impact signal intensity thus compromising quantification and longitudinal studies [8, 9]. Alternatively, fluorescence imaging (FLI) does not require substrate but is limited by tissue autofluorescence. Overcoming autofluorescence is now possible with the advent of time-domain fluorescence imaging (TD-FLI) [9, 10].
Here, we report the ability to track DCs using TD-FLI and a near-infrared (NIR) cell-tracking contrast agent previously developed by our group namely, Tat-NIR-emissive polymersomes [10, 11]. TD-FLI enables both fluorescence intensity and lifetime measurements. The excited-state lifetime (τ) describes the average length of time a fluorophore spends in the excited sate prior to return to the ground state. This intrinsic property is independent of excitation laser power, detected emission intensity, and integration time [9, 10]. We show that fluorescence lifetime imaging is able to decouple labeled dendritic cell (NIR-DC) fluorescence from tissue autofluorescence.
Utilizing near-infrared fluorophores such as the porphyrin-based molecules employed in this work that both absorb (λ=794 nm) and emit (λ=809 nm) photons in the near-infrared regime (650–900 nm) is an additional advantage unique to fluorescence imaging. All photons are subject to attenuation as they pass through tissue containing endogenous absorbers including hemoglobin, deoxyhemoglobin, and water. However, within the near-infrared window (650–900 nm), photon absorption by these molecules is at their nadir, enabling the maximal photon penetration and, therefore, the greatest signal intensity.
With this method, the combination of time-domain fluorescence and near-infrared fluorophores allowed us to track and confirm the migrating dendritic cells in vivo. We confirm that subcutaneous injection leads to NIR-DCs accumulating in the popliteal lymph node and that dendritic cells dynamically enter and leave the lymph node over 15 days. Intravenous injection leads to NIR-DC localization in the liver and spleen. The result of our efforts is a novel noninvasive in vivo cell-tracking method ideal for longitudinal investigations.
Materials and Methods
Tat-NIR-Emissive Polymersome Preparation
Tat-NIR-emissive polymersomes were prepared as described [10, 11] with one modification. Conjugation of Tat peptide (Alta Biosciences, Birmingham, UK) to the terminal hydroxyl of poly (ethylene glycol)-poly(butadiene) (Polymer Source, Dorval, PQ, Canada) was achieved using the method of Ladd and Snow [11, 12]. Briefly, a Fischer esterification reaction is used to modify the terminal hydroxyl of the block copolymer, poly(ethylene oxide (1300)-b-butadiene(2500)) with 4-fluoro-3-nitrobenzoic acid. The product of this reaction then reacts with aliphatic amines within the Tat peptide via a bimolecular aromatic nucleophilic substitution. This modification to the conjugation chemistry did not change the ability to form Tat-NIR polymersomes. All preparations incorporated the tris[(porphinato)zinc(II)] NIR fluorescent dye PZn3 [12-14]. Vesicles were formed in 290-mOsm sucrose solution, dialyzed with phosphate-buffered saline (PBS), sterilized via syringe filtration, and stored at 4°C prior to use.
Murine Dendritic Cell Preparation
DCs were prepared from CD34+ bone marrow precursors harvested from C57BL/6 female mice 4–6 weeks old. Granulocyte–macrophage colony-stimulating factor was used to generate immature DCs [14-16]. Maturation was induced with 10-ng/mL GM-CSF (Peprotech, Rocky Hill, NJ, USA), 1-μg lipopolysaccharide (Sigma, Saint Louis, MO, USA), and 10-ng/ml tumor necrosis factor alpha (Sigma). Polymersomes (5 μM PZn3) were added with cytokines overnight. Cells were then washed and replated with cytokines for an additional day before use. Expression of CD11c, CD86, CD80, and major histocompatibility complex II was confirmed with flow cytometry. Prior to injections, NIR-DCs were washed, counted, and resuspended in PBS. For all in vivo experiments, 105 NIR-DCs were delivered to each animal either subcutaneously in the right footpad or intravenously via retro-orbital injections.
Confocal Microscopy
Confocal imaging was performed at room temperature with fixed cells mounted in PBS. Images were acquired with a Leica TCS SP5 (Leica, Heidelberg, Germany) using a ×40.0 objective (HCX PL APO CS 1.25 Oil UV). PZn3 was excited at 488 nm and emission was collected over a 700–800-nm range. Image processing was performed with ImageJ (National Institute of Health, Bethesda, MD, USA).
Cell Population and Whole-Organ Imaging
Fluorescence imaging of cell suspensions and whole organs was performed with an Odyssey Infrared Imaging System (LI-COR Biosciences, Lincoln, NE, USA). Cell suspensions were plated in 96-well plates in PBS. Whole organs were washed with PBS then imaged in 35-mm tissue culture dishes. PZn3 was detected in the 800 channel (785-nm excitation, 810-nm-long pass filter). Odyssey 2.1 software enabled image processing.
Small Animal In Vivo Imaging
C57BL/6 mice were purchased from The Jackson Laboratory (Bar Harbor, ME, USA). Animals were fed either LabDiet 5053 or LabDiet 5001 for short-term and longitudinal studies, respectively. In vivo imaging was performed with an eXplore Optix MX2 System (Advanced Research Technologies, Saint-Laurent, QC, Canada). Prior to imaging, hair was removed by shaving or use of a depilatory cream. Fluorescence was detected with a 785-nm excitation laser and 850±50-nm band pass filter. Lifetime calculations were performed with OptiView 2.00.01 software.
Tissue Phantom Preparation
The phantom was constructed using a 2% weight agar (Agar Granulated, Fisher BP1423-500) gel containing intralipid (Liposyn III 30%, Abbott Laboratories 0074-6892-03) and carbon ink (Black India 4415, Design Higgins 44201) to simulate the optical scattering and adsorption properties of tissue. In order to mimic tissue levels of adsorption and scatter, we aimed to prepare a gel with μa=0.04 cm−1 and μs'=10 cm−1 respectively. Within the phantom mold, we positioned three 1.5-ml tubes at a depth of ∼2.5 mm. Each tube position was interchangeable allowing us to evaluate phantoms with 10,000, 2,500, or 625 cells per tube. Each tube was prepared by adding the described number of cells in the bottom of the tube in 20-μl volumes. Next, 100 μl of the above described phantom material was added. Once this solidified, the rest of the tube was filled with 1.3 ml of phantom material.
Results
NIR-DC fluorescence was characterized both In vitro and in vivo. Confocal microscopy imaging verified cellular internalization of our contrast agent. An image of a mature murine DC labeled with Tat-NIR-emissive polymersomes is presented in Fig. 1a. A punctate cytosolic distribution is observed indicating that our probe resides within intracellular vesicles. We further characterized the fluorescence of serially diluted NIR-DCs (Fig. 1b). The fluorescence intensity of each well versus cell number is linear (Fig. 1c). Finally, serial dilutions of NIR-DCs were injected subcutaneously into the back of live mice (Fig. 2). Here, we clearly detect fluorescence from an injection of 3,000 cells and over three orders of magnitude, from 3,000 to 300,000 NIR-DCs.
Fig. 1.
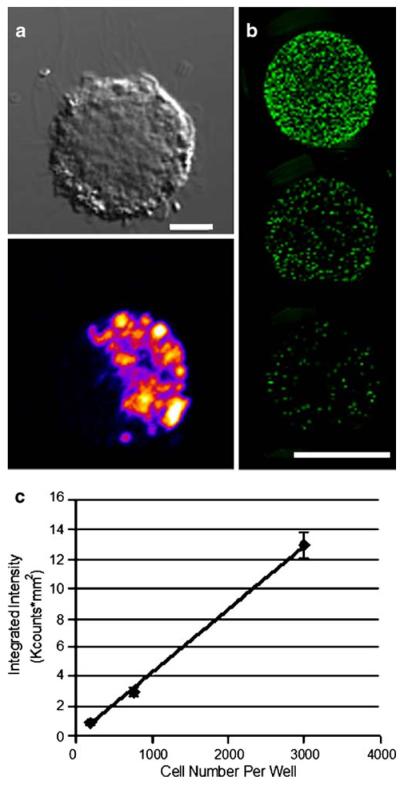
In vitro detection of Tat-NIR polymersome-loaded murine dendritic cells. a Differential interference contrast and fluorescent confocal microscopy images of a Tat-NIR polymersome-labeled murine dendritic cell. Scale bar is 5 μm. Color indicates local fluorescence intensity (blue < red < yellow). b Representative image of a 96-well plate with 100 μL of labeled NIR-DCs in serial dilution. Top well contains 3,000 NIR-DCs and subsequent wells are 4× dilutions. Scale bar is 5 mm. c Quantified fluorescence intensity values versus number of NIR-DCs per well. Error bars represent standard deviation for triplicate wells.
Fig. 2.
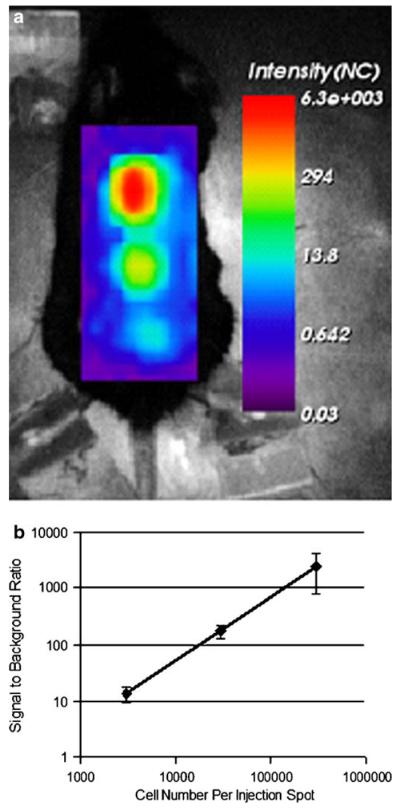
In vivo detection of Tat-NIR polymersome-loaded murine dendritic cells. a Intensity map of subcutaneously injected NIR-DCs at three different concentrations (top=300,000 NIR-DCs, middle=30,000 NIR-DCs, bottom=3,000 NIR-DCs). b Fluorescence intensity signal-to-background ratio for each injection spot versus NIR-DC number. Error bars represent standard deviation for measurements made in three mice.
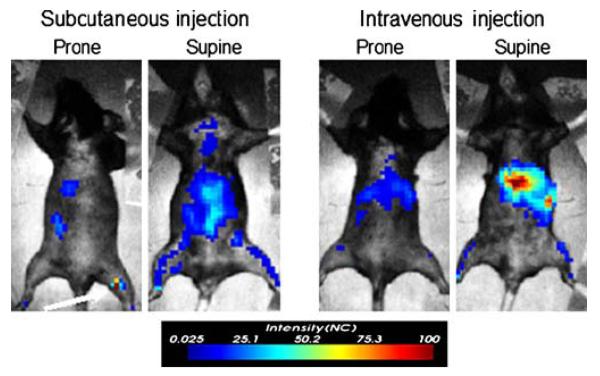
Next, short-term in vivo NIR-DC-tracking studies were performed for 105 NIR-DCs delivered either subcutaneously to the right footpad or intravenously via retro-orbital injection. Fluorescent intensity images acquired 3 days after NIR-DC administration reveal several areas of fluorescence (Fig. 3). In addition to fluorescence intensity, a pulsed laser and time-correlated single-photon counting system enables calculation of fluorescent lifetimes. The algorithm for calculating such lifetime maps is demonstrated in Fig. 4 for two pixels from the same mouse. The F1 pixel is near the popliteal lymph node corresponding to the footpad injected with NIR-DCs. The second pixel, F2, is possibly NIR-DC spleen accumulation or autofluorescence. A comparison of the time-resolved fluorescence intensity curves for each pixel is presented in the topmost graph of Fig. 4. While both curves show the same peak intensity, the shapes of the curves or rates of fluorescence decay are unique. Fitting each curve with a two-parameter exponential decay model is shown in the subsequent graphs of Fig. 4. The characteristic lifetime (τ) of the popliteal lymph node pixel is 0.7 ns while the second pixel has a much shorter lifetime of 0.4 ns. Similar lifetime analysis of surrounding pixels (n=12) yields average lifetimes of 0.702±0.026 ns and 0.454±0.029 ns corresponding to F1 and F2. These values are significantly different as determined by Student t test (p=0.0001). Furthermore, the lifetime value corresponding to the popliteal lymph node (F1) agrees with the value measured for NIR-DCs in a tissue phantom (0.7–0.75 ns; data not shown).
Fig. 3.
Demonstration of fluorescence intensity for short-term tracking of migrating NIR-DCs. in vivo imaging maps 3 days after 105 NIR-DCs were injected subcutaneously in the right footpad (top left) or intravenously via retro-orbital injection (top right). Image acquisition settings were 1.5-mm step size, 1-s integration time, and 803-mW laser power.
Fig. 4.
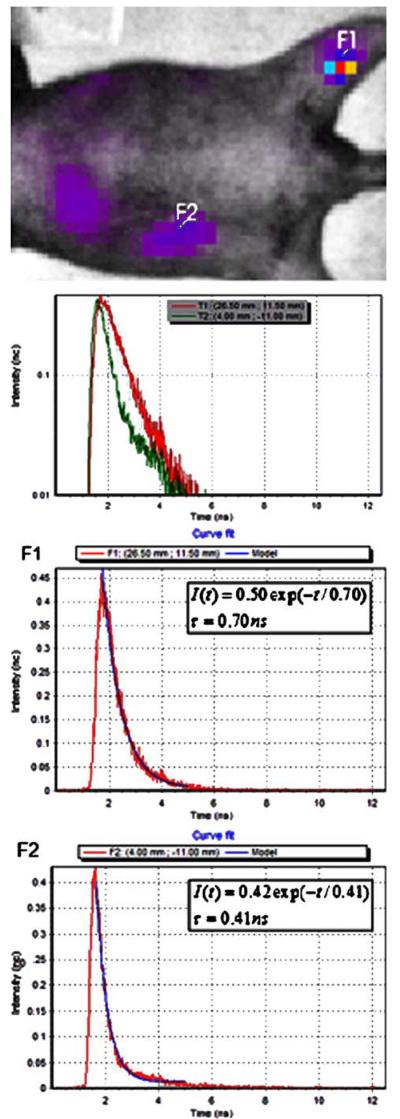
Example of lifetime fitting algorithm performed with OptiView 2.00.01 software. Top: Pixels of interest (F1, F2) are selected from the intensity map. F1 = popliteal lymph node positive for NIR-DCs. F2 = potential autofluorescence pixel of approximately equal intensity. Fluorescence intensity versus time curves for two selected pixels of interest. Computed exponential models (blue line) for fluorescence decay curves (red line) are presented for pixels F1 and F2, respectively. Model input: lifetime value range (0–1.1 ns) and fit range (1.75–5.0 ns).
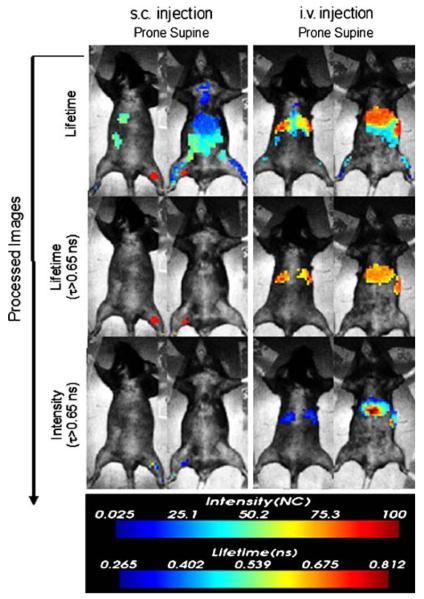
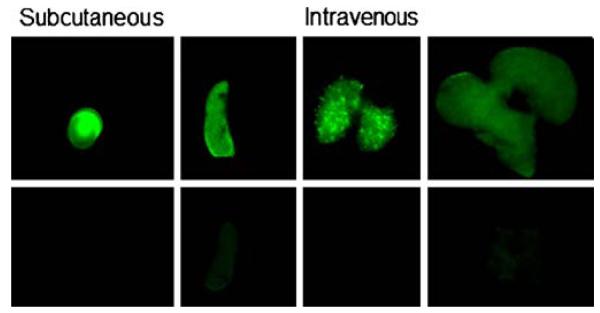
Image maps showing lifetime values for the whole body are displayed in the top row of Fig. 5. Several areas of the mice are clearly differentiated by longer lifetime values (0.65–0.8 ns). The second row of Fig. 5 shows lifetime maps gated to exclude pixels with lifetime values less than 0.65 ns. Finally, applying this lifetime gate to the initial intensity image yields a map of NIR-DC biodistributions deconvolved from autofluorescence. For the subcutaneously delivered NIR-DCs, we only observe signal corresponding to the right popliteal lymph node. In contrast, the fluorescence biodistributions of intravenously delivered NIR-DCs is localized to the liver and spleen. The accumulation of NIR-DCs within these organs is corroborated by ex vivo fluorescence imaging of excised organs as shown in Fig. 6.
Fig. 5.
Fluorescence lifetime image-processing steps for NIR-DC biodistributions shown in Fig. 3. Top row: fluorescent lifetime image maps. Middle row: fluorescent lifetime maps gated to display pixels with τ90.65 ns. Bottom row: fluorescent intensity maps gated to display pixels with Τ0.65 ns.
Fig. 6.
Near-infrared fluorescence images of extracted organs. Left panel: right popliteal lymph node (top) and left popliteal lymph node (bottom) from s.c. injected mouse. Right panel: spleen, lungs, and liver from the i.v. injected mouse (top row) and control organs (bottom row). Green color indicates NIR fluorescence.
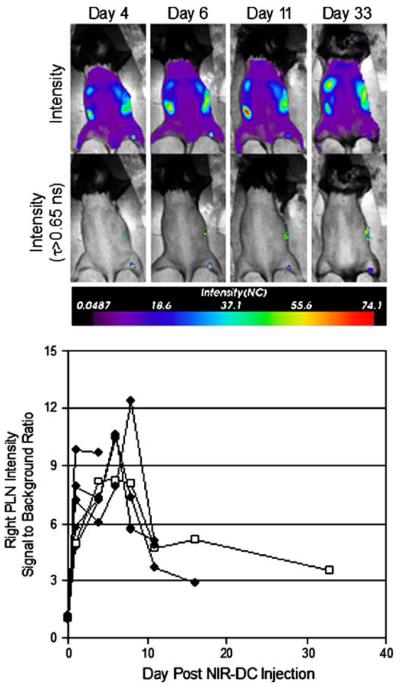
Finally, longitudinal experiments were performed to measure NIR-DC trafficking kinetics in vivo. Representative intensity and lifetime-gated intensity images of the same mouse over 33 days are presented (Fig. 7). The right popliteal lymph node is positive for NIR-DCs at each time point according to the lifetime-gated map; however, the intensity changes with time. A plot of lymph node signal-to-background ratio (SBR) intensity versus day (Fig. 7) shows both an influx and efflux of NIR-DCs. It is noteworthy that NIR fluorescence remains 33 days after injection.
Fig. 7.
In vivo longitudinal tracking of NIR-DCs migrating to the popliteal lymph node. Mice were scanned on days 1, 4, 6, 8, 11, 16, and 33 after a single subcutaneous injection of 105 NIR-DCs into the right footpad. Representative intensity maps (top row) and corresponding lifetime-gated intensity maps (bottom row) for a single mouse are presented for days 4, 6, 11, and 33. The measured signal-to-background ratio for right popliteal lymph node intensity is shown versus day. Each trace (n=6) represents a different mouse and terminates on the day each animal was sacrificed. Trace with open squares is quantification of the images appearing above.
In order to approximate the number of NIR-DCs migrating to the lymph node, we employed a phantom model whereby we could control the depth, number of NIR-DCs, tissue absorption, and tissue-scattering properties (Fig. 8). We placed cell pellets containing 600–10,000 NIR-DCs at the tip of Eppendorf tubes which were subsequently embedded in a solid phantom ∼2.5 mm from the imaging surface. The increase in signal intensity with increasing cell number is easily observed in images of the phantom. Furthermore, the SBR values correlate linearly with the number of cells. With regard to our in vivo data, SBR values for the popliteal lymph node ranged from 3 to 12. This suggests that the number of accumulated NIR-DCs is on the order of hundreds to thousands, respectively.
Fig. 8.
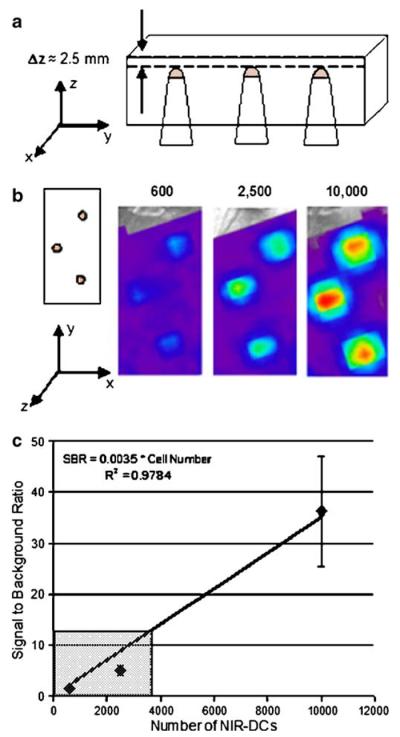
Example of a tissue phantom used to correlate signal-to-background ratio values with the number of NIR-DCs at a specified depth. a Schematic of tissue phantom. Side view showing three Eppendorf tubes placed at equal depths. Each tube contains the same number of cells for n=3. b Top view or imaging surface of tissue phantom adjacent to images collected for each of the three cell concentrations. All cells were placed at a depth of 2.5 mm below the imaging surface. c Signal-to-background ratio versus cell number for the presented images. The gray box indicates the range of signal-to-background ratios observed for popliteal lymph nodes positive for migrating dendritic cells.
Discussion
In vivo fluorescence-based imaging is a promising technology for tracking optically tagged therapeutics and diagnostic probes. The obstacles hindering widespread preclinical use of FLI include background fluorescence and a shortage of near-infrared fluorophores, which enable signal detection at the greatest depths. In this work, we apply fluorescence lifetime imaging and porphyrin-based near-infrared emitters to address each of these obstacles, respectively. Furthermore, we demonstrate this technology in the context of noninvasive tracking of dendritic cell migration in naïve mice.
Our in vitro results verify that Tat-NIR-emissive polymersomes label murine dendritic cells to a high extent in culture. This agrees with our previous work with human dendritic cells in which the material was reproducibly loaded into cells without interfering with cell phenotype, viability, or the capacity to differentiate [10, 11]. The ability to detect NIR-DCs in vivo was first evaluated using subcutaneous injections into the back of mice. This experiment established a lower in vivo detection limit on the order of a thousand cells at shallow depths. This notable sensitivity is a product of minimal photon absorption in the near-infrared regime and a high level of fluorophore loading per cell.
The limitation of using only fluorescent intensity imaging is exemplified with our initial image maps of fluorescence biodistributions following either subcutaneous or intravenous NIR-DC injections. It is not possible with these data alone to discriminate between NIR fluorescence from background fluorescence. However, with time-domain imaging and postacquisition lifetime calculations, we show that NIR-DC fluorescence can be differentiated from background fluorescence without sacrificing each mouse for postmortem analysis. The cellular biodistributions allow us to conclude without subjectivity that a subcutaneous injection led to NIR-DCs accumulating in the popliteal lymph node and an intravenous injection led to NIR-DCs localized to the liver and spleen. The ability to distinguish the spleen and liver from the gut is remarkable since autofluorescence signals from the gut are difficult to overcome [16, 17]. These observed NIR-DC biodistributions agree with DC-tracking studies performed using flow cytometry and histology to follow PKH2-labeled DCs [17, 18] as well as magnetic resonance imaging tracking studies which use either iron oxide [18, 19] or perfluoropolyether agents [19, 20] for contrast.
While static biodistributions are valuable information, the greatest utility of preclinical noninvasive imaging is the ability to perform longitudinal studies. This capacity allows researchers to use internal controls, reduce the number of animals required, and generate kinetic data. To this end, we followed NIR-DC trafficking in the popliteal lymph node for over a month. The observed kinetics are consistent with reported average residence times of DCs in lymph nodes of 5 [17, 18] to 14 days [20, 21] as determined by flow cytometric methods. The dynamics and maximum intensities among different mice are remarkably consistent. In contrast to published studies, we detect a persistent level of lymph node fluorescence beyond the 2-week time point. Our assay may be more sensitive than ex vivo methods which involve several processing steps prior to quantification. Alternatively, transfer of NIR polymersomes to resident phagocytic cells may explain the long-term persistence of NIR fluorescence. To our knowledge, we are the first to report in vivo DC lymph node kinetics using a noninvasive method.
It is important to recognize that the results of our longitudinal study are at most semiquantitative due to the number of variables that affect photon migration through diffuse media [22]. Briefly, the factors impacting fluorescence intensity include: excitation light incidence, photon attenuation of the excitation light and emitted light, fluorophore quantum efficiency, and autofluorescence efficiency. Each of these components is a function of wavelength, absorption coefficient, and scattering coefficient. Furthermore, the in vivo fluorescence intensity of NIR-DCs depends on cellular properties including the degree of Tat-NIR-emissive polymersome uptake, local cell density, and tissue depth [7]. However, when longitudinally imaging the same in vivo location, many of these variables are held constant allowing quantitative comparison of SBR values. While absolute quantification of the number of cells is not possible at this time, we employed a tissue phantom to estimate that on the order of a thousand cells migrated to the draining popliteal lymph node following subcutaneous injection into the footpad.
Beyond the methods reported here, the ability to perform longitudinal imaging experiments is limited. Other in vivo imaging modalities suffer from label decay (positron emission tomography, single-photon emission computed tomography) [21, 23], burdensome image acquisition times (magnetic resonance imaging) [22, 24] or substrate biodistribution variability (BLI) [23, 25]. In comparison, fluorescence imaging is sensitive to picomole quantities of fluorophore and requires short image acquisition times on the order of minutes. While we employed Tat-NIR-emissive polymersomes, it is noteworthy that other fluorophores are compatible with TD-FLI including: Cy5.5 [24, 26], GFP [9, 10], and AlexaFluor 750 [25, 27].
Conclusion
Molecular imaging is a rapidly growing area of research with immense potential for accelerating therapeutic discovery and optimization. In vivo fluorescence imaging is a valuable preclinical tool owing to its cost-effectiveness, fast whole-body acquisition times, and ease of translation from in vitro fluorescent studies. Nonetheless, background fluorescence and suboptimal depth penetration are two limitations that have prevented its widespread implementation. Our results demonstrate that lifetime imaging and near-infrared probes can mitigate these limitations and enable successful cellular-tracking experiments.
Acknowledgements
This work was supported by grants NIH EB003457 (D.A.H.), NIH/NCI R01-CA116779 (G.C.), NIH/NCI P50-CA083638 (G.C.), and NIH RO1CA115229 (M.J.T.). We also acknowledge the Optical Imaging Core at the University of Pennsylvania for access to the eXplore Optix instrument (NIH Grant CA 105008).
Footnotes
Presented in abstract form at the Joint Academy of Molecular Imaging and Society for Molecular Imaging annual meeting, Providence, Rhode Island, September 11, 2007
References
- 1.Gage FH. Cell therapy. Nature. 1998;392(6679):18–24. [PubMed] [Google Scholar]
- 2.Gilboa E. DC-based cancer vaccines. J Clin Invest. 2007;117(5):1195–1203. doi: 10.1172/JCI31205. [DOI] [PMC free article] [PubMed] [Google Scholar]
- 3.Welsh DK, Kay SA. Bioluminescence imaging in living organisms. Curr Opin Biotechnol. 2005;16(1):73–78. doi: 10.1016/j.copbio.2004.12.006. [DOI] [PubMed] [Google Scholar]
- 4.Wang XL, Rosol M, Ge SD, et al. Dynamic tracking of human hematopoietic stem cell engraftment using in vivo bioluminescence imaging. Blood. 2003;102(10):3478–3482. doi: 10.1182/blood-2003-05-1432. [DOI] [PubMed] [Google Scholar]
- 5.Hardy J, Edinger M, Bachmann MH, et al. Bioluminescence imaging of lymphocyte trafficking in vivo. Exp Hematol. 2001;29(12):1353–1360. doi: 10.1016/s0301-472x(01)00756-1. [DOI] [PubMed] [Google Scholar]
- 6.Zhao H, Doyle TC, Coquoz O, et al. Emission spectra of bioluminescent reporters and interaction with mammalian tissue determine the sensitivity of detection in vivo. J Biomed Opt. 2005;10(4):041210. doi: 10.1117/1.2032388. [DOI] [PubMed] [Google Scholar]
- 7.Troy T, Jekic-McMullen D, Sambucetti L, Rice B. Quantitative comparison of the sensitivity of detection of fluorescent and bioluminescent reporters in animal models. Mol Imaging. 2004;3(1):9–23. doi: 10.1162/15353500200403196. [DOI] [PubMed] [Google Scholar]
- 8.Massoud TF, Gambhir SS. Molecular imaging in living subjects: seeing fundamental biological processes in a new light. Genes Dev. 2003;17(5):545–580. doi: 10.1101/gad.1047403. [DOI] [PubMed] [Google Scholar]
- 9.Baba S, Cho SY, Ye Z, et al. How reproducible is bioluminescent imaging of tumor cell growth? Single time point versus the dynamic measurement approach. Mol Imaging. 2007;6(5):315–322. [PubMed] [Google Scholar]
- 10.McCormack E, Micklem DR, Pindard LE, et al. In vivo optical imaging of acute myeloid leukemia by green fluorescent protein: time-domain autofluorescence decoupling, fluorophore quantification, and localization. Mol Imaging. 2007;6(3):193–204. [PubMed] [Google Scholar]
- 11.Christian NA, Milone MC, Ranka SS, et al. Tat-functionalized near-infrared emissive polymersomes for dendritic cell labeling. Bioconjug Chem. 2007;18(1):31–40. doi: 10.1021/bc0601267. [DOI] [PubMed] [Google Scholar]
- 12.Ladd DL, Snow RA. Reagents for the preparation of chromophorically labeled polyethylene glycol-protein conjugates. Anal Biochem. 1993;210(2):258–261. doi: 10.1006/abio.1993.1193. [DOI] [PubMed] [Google Scholar]
- 13.Ghoroghchian PP, Lin JJ, Brannan AK, et al. Quantitative membrane loading of polymer vesicles. Soft Matter. 2006;2(11):973–980. doi: 10.1039/b604212k. [DOI] [PubMed] [Google Scholar]
- 14.Ghoroghchian PP, Frail PR, Susumu K, et al. Near-infrared-emissive polymersomes: self-assembled soft matter for in vivo optical imaging. Proc Natl Acad Sci U S A. 2005;102(8):2922–2927. doi: 10.1073/pnas.0409394102. [DOI] [PMC free article] [PubMed] [Google Scholar]
- 15.Courreges MC, Benencia F, Conejo-Garcia JR, Zhang L, Coukos G. Preparation of apoptotic tumor cells with replication-incompetent HSV augments the efficacy of dendritic cell vaccines. Cancer Gene Ther. 2006;13(2):182–193. doi: 10.1038/sj.cgt.7700888. [DOI] [PubMed] [Google Scholar]
- 16.Zhang L, Yang N, Garcia JRC, et al. Generation of a syngeneic mouse model to study the effects of vascular endothelial growth factor in ovarian carcinoma. Am J Pathol. 2002;161(6):2295–2309. doi: 10.1016/s0002-9440(10)64505-1. [DOI] [PMC free article] [PubMed] [Google Scholar]
- 17.Weagle G, Paterson PE, Kennedy J, Pottier R. The nature of the chromophore responsible for naturally-occurring fluorescence in mouse skin. J Photochem Photobiol B Biol. 1988;2(3):313–320. doi: 10.1016/1011-1344(88)85051-6. [DOI] [PubMed] [Google Scholar]
- 18.Lappin MB, Weiss JM, Delattre V, et al. Analysis of mouse dendritic cell migration in vivo upon subcutaneous and intravenous injection. Immunology. 1999;98(2):181–188. doi: 10.1046/j.1365-2567.1999.00850.x. [DOI] [PMC free article] [PubMed] [Google Scholar]
- 19.de Vries IJM, Lesterhuis WJ, Barentsz JO, et al. Magnetic resonance tracking of dendritic cells in melanoma patients for monitoring of cellular therapy. Nat Biotechnol. 2005;23(11):1407–1413. doi: 10.1038/nbt1154. [DOI] [PubMed] [Google Scholar]
- 20.Ahrens ET, Flores R, Xu HY, Morel PA. In vivo imaging platform for tracking immunotherapeutic cells. Nature Biotechnology. 2005;23(8):983–987. doi: 10.1038/nbt1121. [DOI] [PubMed] [Google Scholar]
- 21.Allan RS, Waithman J, Bedoui S, et al. Migratory dendritic cells transfer antigen to a lymph node-resident dendritic cell population for efficient CTL priming. Immunity. 2006;25(1):153–162. doi: 10.1016/j.immuni.2006.04.017. [DOI] [PubMed] [Google Scholar]
- 22.Yamada Y. Fundamental studies of photon migration in biological tissues and their application to optical tomography. Opt Rev. 2000;7(5):366–374. [Google Scholar]
- 23.McQuade P, Rowland DJ, Lewis JS, Welch MJ. Positron-emitting isotopes produced on biomedical cyclotrons. Curr Med Chem. 2005;12(7):807–818. doi: 10.2174/0929867053507397. [DOI] [PubMed] [Google Scholar]
- 24.Lucignani G, Ottobrini L, Martelli C, Rescigno M, Clerici M. Molecular imaging of cell-mediated cancer immunotherapy. Trends Biotech. 2006;24(9):410–418. doi: 10.1016/j.tibtech.2006.07.003. [DOI] [PubMed] [Google Scholar]
- 25.Shinde R, Perkins J, Contag CH. Luciferin derivatives for enhanced in vitro and in vivo bioluminescence assays. Biochemistry. 2006;45(37):11103–11112. doi: 10.1021/bi060475o. [DOI] [PubMed] [Google Scholar]
- 26.Abulrob A, Brunette E, Slinn J, Baumann E, Stanimirovic D. In vivo time domain optical imaging of renal ischemia–reperfusion injury: discrimination based on fluorescence lifetime. Mol Imaging. 2007;6(5):304–314. [PubMed] [Google Scholar]
- 27.Hassan M, Riley J, Chernomordik V, et al. Fluorescence lifetime imaging system for in vivo studies. Mol Imaging. 2007;6(4):229–236. [PMC free article] [PubMed] [Google Scholar]


