Abstract
We present a new quantitative phase microscopy technique, confocal diffraction phase microscopy, which provides quantitative phase measurements from localized sites on a sample with high sensitivity. The technique combines common-path interferometry with confocal microscopy in a transmission geometry. The capability of the technique for static imaging is demonstrated by imaging polystyrene microspheres and live HT29 cells, while dynamic imaging is demonstrated by quantifying the nanometer scale fluctuations of red blood cell membranes.
Quantifying the optical phase delays associated with live cells in culture provides access to information about morphology and dynamics at the nanometer scale. Therefore, there has been substantial interest in quantitative phase imaging (QPI) in recent years [1]. We have developed several full-field phase imaging techniques that are suitable for spatially resolved, dynamic investigation of live cells [2–4]. These techniques have been used for various applications, including quantifying the red blood cell (RBC) shape and dynamics [5,6] and refractive properties of live cells [7] and of tissues [8].
Confocal microscopy is a well-established, powerful technique for biomedical imaging mainly because of its ability to provide optical sectioning in relatively thick specimens [9]. In combination with fluorescence microscopy, especially using multiphoton excitation, confocal microscopy enables unprecedented studies of cells and tissue both in vitro and in vivo [10].
In this Letter, we combine the nanoscale sensitivity to structure and motions provided by quantitative phase imaging with the localization capability of confocal microscopy, which allows for optical sectioning through live cells. Using spatial modulation and a 2D array detector our method, which we refer to as confocal diffraction phase microscopy (cDPM), provides for the first time to our knowledge local phase sensitive information in a transmission geometry. Compared to a previous transmission confocal microscope developed by Yang and Mertz [11], cDPM provides increased sensitivity to structure and dynamics owing to its phase-base measurement and also has the benefit of not requiring a nonlinear optical interaction.
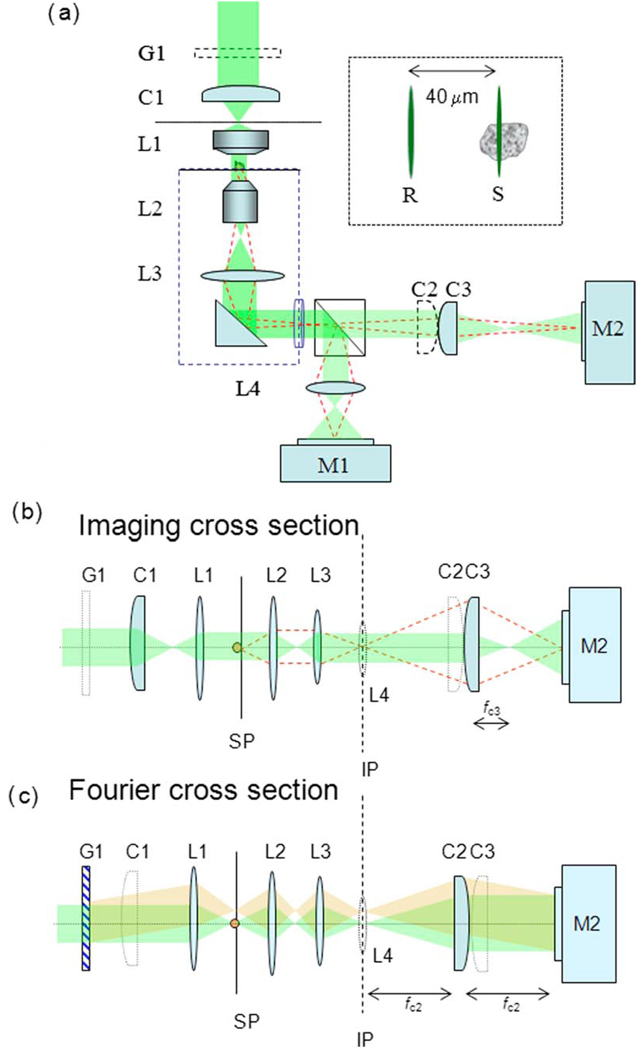
The setup [Fig. 1(a)] uses a diffraction grating to create a common path interferometer, as in the full field diffraction phase microscopy [3]. However, in cDPM the grating is used to split the illumination (rather than the image field) into sample and reference beams, which are focused at the sample plane. To eliminate one axis of scanning necessary to render a full image, we focus the beams into lines by means of cylindrical optics. The zeroth-order beam of the diffraction grating is aligned to pass through the sample and serves as the sample beam, whereas the first diffraction order travels outside of the sample and serves as the reference beam (inset of Fig. 1). The optical setup is best described in two different cross sections, as shown in Figs. 1(b) and 1(c). In the “imaging cross section,” the microscope images all the points along the focus line simultaneously at the CCD plane. The “Fourier cross section” records the Fourier transform of the field at the sample plane, i.e., generates at the CCD plane the interference fringes of the two beams (similar to a two-slit Young interferometer). This simultaneous operation is achieved by using two additional cylindrical lenses, C2 and C3, that converge on two perpendicular axes and have their focal distances double of one another (fC3=fC2/2) in Figs. 1(b) and 1(c). Thus, one dimension of the CCD is used to image one line from the sample, and the signal from the other dimension is used to extract the phase shift difference between the reference and object fields via a Hilbert transform, as described in [12]. The full quantitative phase image is reconstructed by scanning the sample in one dimension using a two-axis nanoposition translation stage (M-216GD, Physik Instrumente GmbH & Co. KG) controlled through a PC serial port. The NA of the objective is NA=1.3, which provides 0.2 µm transverse resolution. Thus, cDPM and confocal microscopy provide comparable transverse resolution performance. Because the illumination in cDPM consists of two identical beams copropagating through the imaging system (one through the sample and one not), phase changes due to aberrations will be largely canceled in the interference term.
Fig. 1.
(Color online) (a) cDPM experimental setup. The inset shows the reference (R) and sample (S) beams at the sample plane. Owing to the cylindrical optics involved, we present the optical diagram in two orthogonal axes: (b) imaging cross section and (c) Fourier cross section. In all figures, G1 is a 500 LPI grating; C1, C2, and C3 are cylindrical lenses; L1 is a high-NA oil immersion condenser lens; L2 is a 100× objective lens; L3 is a tube lens; and L4 is an imaging lens. M1 is a video camera; M2 is a CCD.
The second harmonic of the Nd:YAG laser (Crysta-Laser, λ=532 nm) was used as an illumination source. An inverted microscope (Axiovert S100, Zeiss) serves as the imaging platform. For alignment purposes, the image (IP) is relayed to the video camera (XC-75, Sony) via the beam splitter cube BS and lens L4. The interferogram is recorded with the CCD camera M2 (Sensys 0402E, Photometrics).
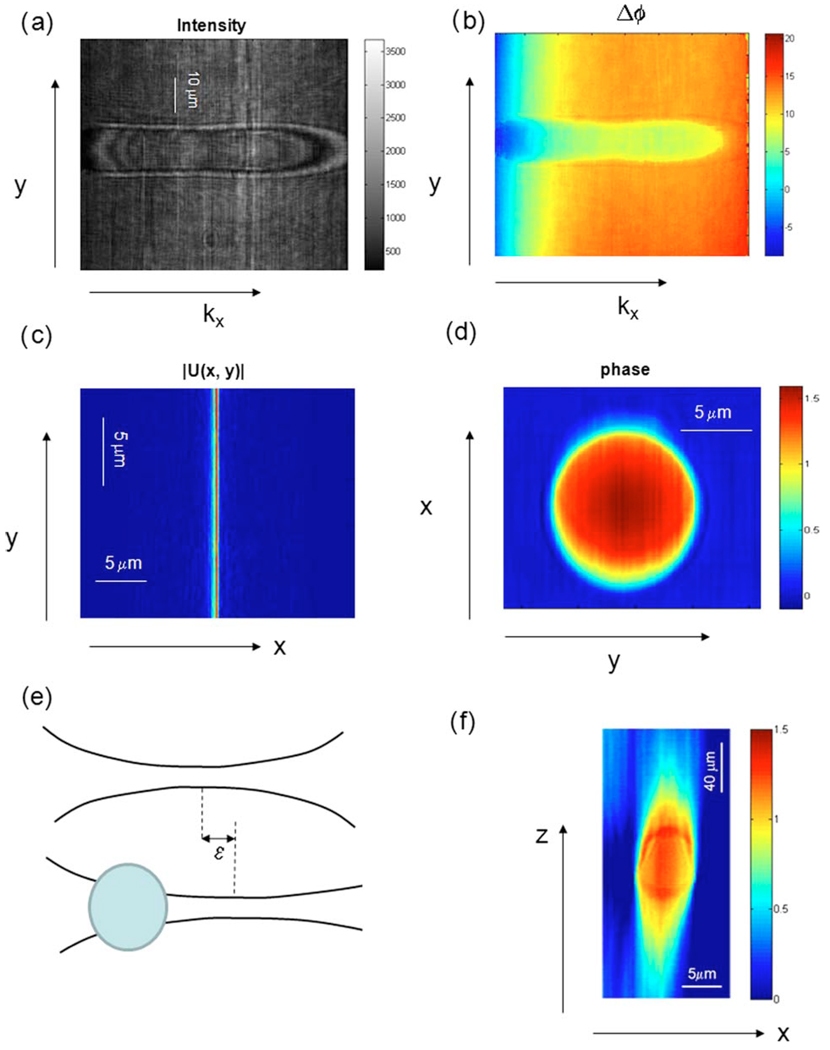
We first applied cDPM to image a polystyrene microsphere. Figure 2(a) shows the interferogram image associated with the sample beam traversing the center of a polystyrene microsphere. Figure 2(b) shows the phase image Δ ϕ(kx,y) extracted from the interferogram using a 2D Hilbert transform, where y is the imaging axis and kx is the Fourier frequency associated with the x axis. We then obtain the field at the camera plane as Ũ(kx,y)=A(kx,y)e−iΔϕ(kx,y), with the amplitude A obtained from the intensity envelope of the interferogram. Performing numerically the Fourier transform of the field on the kx dimension, we obtain the image field, U(x,y)∝∫Ũ(kx,y)ei2πkxxdkx. Confocal filtering is then performed numerically by selecting the phase associated with the peak of the focus line, Δ ϕ(0,y). The 2D quantitative phase image of the bead, reconstructed by scanning, is shown in Fig. 2(d). For polystyrene in oil at the 532 nm wavelength the refractive index mismatch was Δn =0.0135. The diameter distribution of the bead batch was 9.7±0.3 µm, as provided by the manufacturer. The expected phase shift is therefore 1.72±0.05 rad, which compares well with the maximum phase of the profile through the bead of 1.61 rad. The slight discrepancy is most likely due to the beam curvature in our high-NA setup.
Fig. 2.
(Color online) cDPM image of a 10 µm bead in 1.57, refractive index oil. (a) Fourier interferogram (kx−y). (b) Fourier quantitative phase images of the bead (kx−y). (c) The line imaging field in (x−y) after inverse 1D Fourier transform. (d) Quantitative x−y phase image of the bead. (e) Schematics of the focus shift that explains the elongation along z, as described in text. (f) Quantitative x−y phase cross section.
Scanning along the z axis was accomplished by translating the sample via a computerized stage, with a 1 µm step. As the sample beam passes through the object, its focus experiences a shift ε along the z axis with respect to the reference beam [Fig. 2(e)]. Thus, upon z scanning through the object the phase difference between the two fields measured in the Fourier cross section can be approximated by the Fresnel equation as
| (1) |
Equation (1) shows that, upon propagating a distance z from focus, the effect of the shift ε is to essentially rescale the z axis, by a factor 1+z/ε. Note that for ε →0, i.e., in the absence of a sample in the object beam, Δ ϕ→0, indicating that in this case both beams are equally defocused, regardless of the z position, and, thus, the phase z profile is flat. On the other hand, for a large focus shift ε the reference can be considered a plane wave and the phase difference simply becomes Δ ϕ(y,z)=kyy2/2z. Thus, in typical cell imaging measurements, we expect a situation between these two extremes, i.e., a finite “elongation” of the image along the z axis.
Figure 2(f) shows the x−z cross section obtained for the same bead as in Fig. 2(d), where the line phase data from the successive stage positions were stacked together to form a vertical section (z−x plane) phase image. We measured in this case an 8× elongation of the z axis, as expressed in Eq. (1).
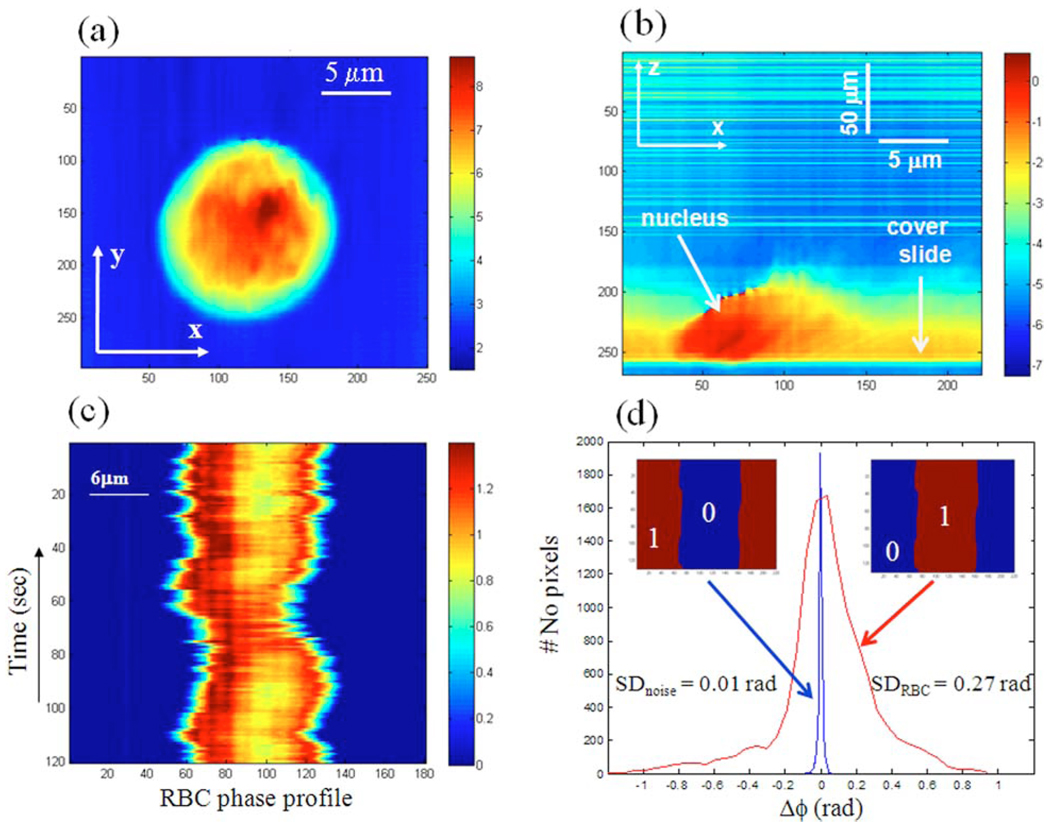
We applied cDPM to image live cells in culture. The x−y phase image of a T84 cell attached to a glass slide is shown in Fig. 3(a). Figure 3(b) shows the x−z scan of the same cell attached to a glass slide, where the z axis was rescaled by a factor of 10. This cross section clearly shows an area of higher optical density, which suggests the location of the nucleus. We are developing a theoretical model to account for scattering effects in our focused geometry, which will predict quantitatively the sample-dependent z axis rescaling for our experiments. This description will allow for decoupling the refractive index information from the thickness of an unknown sample, without the need for additional measurements.
Fig. 3.
(Color online) (a) Quantitative x−y phase image of a HT29 cell. (b) Quantitative x−y phase image of the HT29 cell in (a). (c) Line quantitative phase data from a red blood cell over time. (d) Histogram of measured RBC fluctuations (large curve) and noise (small curve) obtained by using the respective binary masks, as indicated in the insets. The corresponding standard deviations are also shown. All color bars show phase shifts in rad.
The capability of the new technique to measure dynamics was demonstrated by imaging fluctuating RBCs. A sample was prepared by diluting fresh blood with phosphate buffer solution and placing a droplet between cover glass slides. First, we observed a RBC movement over a period of 3 min, at acquisition rates of 1 frame per second. The data were processed to obtain phase profiles and, at a particular position on the line beam, we monitored the changing of phase over time. Figure 3(c) shows phase profile fluctuations associated with the focus line that crosses the cell. In Fig. 3(d), we show the histograms associated with the background noise and the fluctuating RBC. These histograms were obtained by using binary masks to isolate the background and cell signals, as shown in the insets of Fig. 3(c). The standard deviation of 0.27 rad associated with the RBC is much higher than the 0.01 rad value of the noise, which attests that cDPM is indeed sensitive to membrane motions. This high phase stability is due to the common path geometry employed.
In summary, cDPM provides, for the first time to our knowledge, depth-resolved dynamics in live cells without sample staining or preparation. Compared to existing projection tomography techniques [13–15], cDPM does not require angularly resolved measurements and does not involve heavy numerical reconstruction procedures. The horizontal optical sectioning can be readily performed by flowing the cells of interest in chambers or microfluidic devices. This development is particularly appealing for high-throughput applications such as flow cytometry and cell sorting.
Footnotes
OCIS codes: 180.0180, 170.1530, 170.1470.
References
- 1.Depeursinge C. In: Digital Holography and Three-Dimensional Display. Poon T-C, editor. Springer; 2006. p. 98. [Google Scholar]
- 2.Popescu G, Deflores LP, Vaughan JC, Badizadegan K, Iwai H, Dasari RR, Feld MS. Opt. Lett. 2004;29:2503. doi: 10.1364/ol.29.002503. [DOI] [PubMed] [Google Scholar]
- 3.Popescu G, Ikeda T, Dasari RR, Feld MS. Opt. Lett. 2006;31:775. doi: 10.1364/ol.31.000775. [DOI] [PubMed] [Google Scholar]
- 4.Ikeda T, Popescu G, Dasari RR, Feld MS. Opt. Lett. 2005;30:1165. doi: 10.1364/ol.30.001165. [DOI] [PubMed] [Google Scholar]
- 5.Popescu G, Park YK, Dasari RR, Badizadegan K, Feld MS. Phys. Rev. E. 2007;76:031902. doi: 10.1103/PhysRevE.76.031902. [DOI] [PubMed] [Google Scholar]
- 6.Popescu G, Ikeda T, Goda K, Best-Popescu CA, Laposata M, Manley S, Dasari RR, Badizadegan K, Feld MS. Phys. Rev. Lett. 2006;97:218101. doi: 10.1103/PhysRevLett.97.218101. [DOI] [PubMed] [Google Scholar]
- 7.Lue N, Popescu G, Ikeda T, Dasari RR, Badizadegan K, Feld MS. Opt. Lett. 2006;31:2759. doi: 10.1364/ol.31.002759. [DOI] [PubMed] [Google Scholar]
- 8.Lue N, Bewersdorf J, Lessard MD, Badizadegan K, Dasari K, Feld MS, Popescu G. Opt. Lett. 2007;32:3522. doi: 10.1364/ol.32.003522. [DOI] [PMC free article] [PubMed] [Google Scholar]
- 9.Wilson T, Masters BR. Appl. Opt. 1994;33:565. doi: 10.1364/AO.33.000565. [DOI] [PubMed] [Google Scholar]
- 10.Denk W, Strickler JH, Webb WW. Science. 1990;248:73. doi: 10.1126/science.2321027. [DOI] [PubMed] [Google Scholar]
- 11.Yang C, Mertz J. Opt. Lett. 2003;28:224. doi: 10.1364/ol.28.000224. [DOI] [PubMed] [Google Scholar]
- 12.Popescu G, Ikeda T, Best CA, Badizadegan K, Dasari RR, Feld MS. J. Biomed. Opt. 2005;10:060503. doi: 10.1117/1.2149847. [DOI] [PubMed] [Google Scholar]
- 13.Zysk AM, Reynolds JJ, Marks DL, Carney PS, Boppart SA. Opt. Lett. 2003;28:701. doi: 10.1364/ol.28.000701. [DOI] [PubMed] [Google Scholar]
- 14.Charriere F, Marian A, Montfort F, Kuehn J, Colomb T, Cuche E, Marquet P, Depeursinge C. Opt. Lett. 2006;31:178. doi: 10.1364/ol.31.000178. [DOI] [PubMed] [Google Scholar]
- 15.Choi W, Fang-Yen C, Badizadegan K, Oh S, Lue N, Dasari RR, Feld MS. Nat. Methods. 2007;4:717. doi: 10.1038/nmeth1078. [DOI] [PubMed] [Google Scholar]


