

Abstract
Purpose
To study fixation patterns and reading rates in eyes with central scotomas from geographic atrophy (GA) of age-related macular degeneration and to compare fixation patterns with those of patients with Stargardt disease.
Methods
Scanning laser ophthalmoscope analysis of fixation patterns in eyes with 20/80 to 20/200 visual acuity. Included were 41 eyes of 35 patients with GA and 10 eyes of 5 patients with Stargardt disease. The patients with GA also were tested for maximum reading rate, and the size of the areas of atrophy were measured by fundus photograph analysis.
Results
Sixty-three percent of GA eyes fixating outside the atrophy placed the scotoma to the right of fixation in visual field space, 22% placed the scotoma above fixation, and 15% placed it to the left, regardless of the laterality of the GA eye. Fixation was stable in subsequent years of testing for scotoma placement to the right of or above fixation. All GA eyes fixated immediately adjacent to the atrophy. In contrast, seven of ten eyes with Stargardt disease fixated at a considerable distance from the scotoma border, with the dense scotoma far above the fixation site in visual field space.
For the patients with GA, the maximum reading rate was highly correlated with size of the atrophic area, but not with age or visual acuity within the limited visual acuity range tested. There was a trend to more rapid reading with the scotoma above fixation and slower reading with the scotoma to the left.
Conclusion
There is a preference for fixation with the scotoma to the right in eyes with GA. Patients with Stargardt disease use different strategies for fixation, perhaps due to subclinical pathology adjacent to the atrophic regions.
The size of the atrophic area in GA plays the predominant role in reading rate for eyes that have already lost foveal vision.
Fundus perimetry, the ability to view the retina and the stimulus on it while testing retinal sensitivity, is a tool that has great potential for better understanding how patients with macular disease use their remaining vision and how macular diseases evolve over time. The scanning laser ophthalmoscope (SLO) is the most recent and most flexible of fundus perimeters in terms of stimulus generation and fundus visualization. With the SLO, one is able to see what retinal location a patient uses for fixating targets and reading letters. One can map out the location of scotomas (blind spots) on the retina and plot the results in the proper retinal location by correcting for eye movements.1
Geographic atrophy (GA) is a form of advanced age-related macular degeneration, in which areas of atrophy develop and enlarge surrounding the fovea, but often spare the foveal center for a period of years.2 In the late stages, the fovea becomes atrophic and the patient loses central fixation. Although GA does not always follow this classic course, the atrophy often is centered on the fovea in late stages. There is an absolute scotoma in areas of full GA, which corresponds well to the borders of the atrophy.1,3 Thus, GA may be a model system for learning about how extrafoveal fixation sites are chosen. We have performed extensive testing of eyes with GA in the context of a 5-year natural history study funded by the National Institutes of Health. We noticed characteristic properties of the choice of preferred retinal locus for fixation when the fovea has become involved and extrafoveal fixation must be used. Surprisingly, those patients we have tested who have Stargardt disease and central scotomas do not show the same fixation patterns as do these with age-related GA. In the context of our natural history study of GA, we also have analyzed fundus photographs and measured areas of atrophy, and we have been able to correlate these measurements with reading rate. An evaluation of fixation patterns and reading rate is presented here.
Subjects and Methods
Subjects with Geographic Atrophy
The subjects with GA in this study were those participants in our natural history study of GA at the Wilmer Ophthalmological Institute1,4 with best-corrected visual acuity in at least one eye of 20/80 through 20/200 from GA, using an Early Treatment Diabetic Retinopathy Study chart. Eligible eyes had GA from age-related macular degeneration and no evidence of choroidal neovascularization on fluorescein angiography. All patients seen from June 1992 through October 1994 who met these criteria were selected. This range of visual acuities was chosen to ensure that we were dealing primarily with extrafoveal vision and to match the visual acuities of the subjects with Stargardt disease with which the GA subjects were compared. In addition, the lower limit on visual acuity (20/200) was selected to ensure that the preferred retinal locus was likely to be located within the SLO's field of 15°. Forty-one eyes of 35 patients were found to have GA and visual acuities from 20/78 through 20/182 (median, 20/112) with analyzable SLO evaluation. (One additional eye met the study eligibility but had inadequate SLO testing.) Six Patients had bilateral GA, with both eyes eligible for this study, and an additional 22 patients had bilateral GA with only one eye meeting the visual acuity criteria for this study. Six other patients had eligible GA in one eye and choroidal neovascularization in the fellow eye, and one patient had lost her fellow eye to trauma. The median age of the patients was 79 years (range, 72–95 years).
Nuclear, cortical, and posterior subcapsular opacities were graded at the slit lamp using a modification of the Taylor–West5 system. Thirty phakic eyes were graded in this manner; 5 other phakic eyes were graded more qualitatively early in the study and were not included in the lens analysis. Six eyes were pseudophakic with a clear central path.
Written informed consent was obtained from all patients.
Subjects with Stargardt Disease
The subjects with Stargardt disease had been referred to the Visual Function Service for macular perimetry and other testing for clinical purposes. Five patients with Stargardt disease and with visual acuity in the eligible range in both eyes were tested. Median age was 19 years (range, 12–30 years). Median visual acuity was 20/125 (range, 20/100–20/166).
Scanning Laser Ophthalmoscope Testing. A prototype Rodenstock SLO (G. Rodenstock Instrumente GmbH, Munich, Germany) was used. The fundus was imaged on a video monitor using an infrared laser. The stimuli were generated using a helium–neon red laser with an acoustooptic modulator, allowing the intensity of the beam to be changed pixel by pixel, with a resolution of 2 minutes of arc (10 μm). A fixation cross of 1° in size was used. The stimulus was a 0.4-second flash of 10 minutes (50 μm) in size. The maximum stimulus intensity, used for detecting dense scotomas, was approximately 70,000 trolands. The sites of fixation and scotoma were determined on the SLO using a technique called landmark-driven fundus perimetry, which has been described in detail in a recent publication.1 Briefly, this method allows for making a testing plan (generally a circular grid of 5 concentric circles centered on fixation, each 1° apart, with 12 meridia tested per circle) and randomizing the order of stimulus presentation. This technique provides retinally correct testing by using the change in position of a retinal landmark to drive the presentation of the stimulus at the desired retinal location.
The location of fixation relative to the scotoma (and atrophy) was characterized in two ways. First, fixation was characterized in terms of whether it was at the edge of the atrophy; that is, whether there were measurable areas of seeing retina between the dense scotoma and the fixation site. Second, the spatial direction of fixation relative to the atrophy was described. The fixation locus was characterized as being surrounded by atrophy, being superior, inferior, to the right, or to the left of the atrophy, or being within the atrophy (where the cross was not seen). The pattern was described by the most dominant direction (i.e., fixation at the right aspect of the superior border was considered superior). The right–left orientation of the SLO images and fundus images is identical to the orientation in visual field space. The superior–inferior orientation of the SLO images and fundus images is reversed relative to the visual field space. To avoid confusion, orientations in this article are given in visual field space.
The patients also underwent testing of letter and word reading in the SLO. Letters or words appeared one at a time in the center of the SLO screen. The patient was instructed to read each letter or word. For 18 eyes, a staircase strategy was used to measure best letter visual acuity, defined as the minimum size for which two of three letters could be read correctly.
Most sessions were videotaped, and the videotapes of the testing session were analyzed to measure fixation stability for the perimetry task and for letter reading. Fixation stability was measured as the average absolute change in fixation position for ten randomly chosen stimulus presentations.
Approximate Location of the Fovea and Atrophy Size
To define the location and size of GA, fundus drawings of each eye were made in the Wilmer Photograph Reading Center using techniques described elsewhere (unpublished data; Sunness et al, 1996) that were adapted from the Macular Photocoagulation Study.6 The fundus photograph was projected onto a white piece of paper, and the disc and retinal vessels were drawn. The fovea often is difficult to localize in GA due to the changes in macular appearance. When adequate landmarks such as perifoveal capillaries or xanthophyll were not visible, the location of the foveal avascular zone was approximated by measuring 3.0 mm from the temporal edge of the disc horizontally, and measuring vertically 0.5 mm down from the center of the disc (unpublished data; Macular Photocoagulation Study). Without reference to the SLO findings, the estimated foveal center was graded as being within the left, middle, or right one third of the atrophy, and as being within the upper, middle, or lower one third of the atrophy. These data were used to determine qualitatively whether the side of the scotoma used for fixation was chosen because of its greater proximity to the fovea. The borders of the GA were drawn from the fundus photograph by an experienced grader. Spared regions within the atrophy also were outlined. All drawings were reviewed by one of us (JSS), and were adjudicated openly when there were differences of opinion. The borders of areas of GA then were traced on a digitizing tablet, and a measurement of area was computed for each atrophic region. Any spared area within an atrophic area was subtracted from the atrophic area measurement to obtain a true measure of the total area of GA. The areas of GA reported here do not include noncontiguous peripapillary atrophy.
Reading Rate
Reading was measured using random words. Text was displayed on a 19-inch black and white television monitor controlled by a laboratory computer. Dark letters were presented on a bright background of 181 cd/m2 at a contrast of 97%. Text was composed of random words selected from a list of the 300 most common three-, four-, five-, and six-letter words.7 A paragraph of random words was presented for 15 seconds and the subject read the words aloud. Reading rate (in words per minute) was computed from the number of words read correctly. Nine different character sizes were used, ranging from approximately 1.3 times the visual acuity to approximately six limes greater than this (limited by the monitor size and distance for the lower visual acuities). The range of character sizes was 0.4° to 2.5° for eyes with 20/80 visual acuity, and 1.0° to 4.6° for subjects with 20/200 visual acuity. The maximum reading rate and the critical character size, defined as the smallest character size with which the patient could attain 90% of the maximum reading rate, were determined. In the original phases of this study, reading rate was not always measured for the worse-seeing eye. Reading rate data were not available for 6 of the 19 worse-seeing eyes or 3 of the 22 better-seeing eyes.
Results
Fixation Patterns
Geographic Atrophy
All 41 study eyes had dense scotomas by SLO testing, corresponding to the area of atrophy. The distribution of fixation locations is shown in Table 1. Direction is specified by orientation in visual field space. For left and right directions, this is identical to fundus photographs, but for upper and lower directions, this is the reverse of the fundus photograph. The average absolute deviation of fixation from the mean location for each stimulus presentation was 0.8°.
Table 1.
Fixation Patterns for Eyes with Geographic Atrophy*
| All Eyes (n = 41) | No. Eyes |
|---|---|
| Places cross in atrophy (ATR) | 7 |
| Fixates in clear area within atrophy (CLR) | 7 |
| Fixates with scotoma to right (SC RT) | 17 |
| Fixates with scotoma to left (SC LT) | 4 |
| Fixates with scotoma above (SC AB) | 6 |
| Fixates with scotoma below (SC BE) | 0 |
Fixation patterns are specified by the location of the scotoma relative to fixation in visual field space. The lateral orientations are the same in retinal and visual field space, while the vertical orientations are reversed. Thus, fixating with the scotoma to the right is the same as having atrophy to the right of fixation in a fundus photograph. Fixating with the scotoma above fixation is the same as having fixation above the atrophy (i.e., the atrophy below fixation) in the fundus photograph.
For seven eyes, the fixation cross was placed on non-seeing retina and could not be placed on a stable location elsewhere. Seven eyes fixated in a spared area that was surrounded by atrophy. The remaining 27 eyes all fixated with the cross immediately adjacent to the dense scotoma (atrophy). Of these, 17 eyes (63%) fixated with the scotoma to the right in visual field space (Figs 1 and 2), 4 (15%) fixated with the scotoma to the left, and 6 (22%) fixated with the scotoma above fixation in visual field space. No eye fixated with the scotoma below fixation. These results did not change significantly when we eliminated one eye of each of the six patients with two eligible eyes. The same pattern of preference for fixation with the scotoma to the right also was seen when the eyes were subdivided into right eyes alone and left eyes alone (Fig 2), or were subdivided by whether the study eyes was the better-seeing eye or the worse-seeing eye for each patient.
Figure 1.
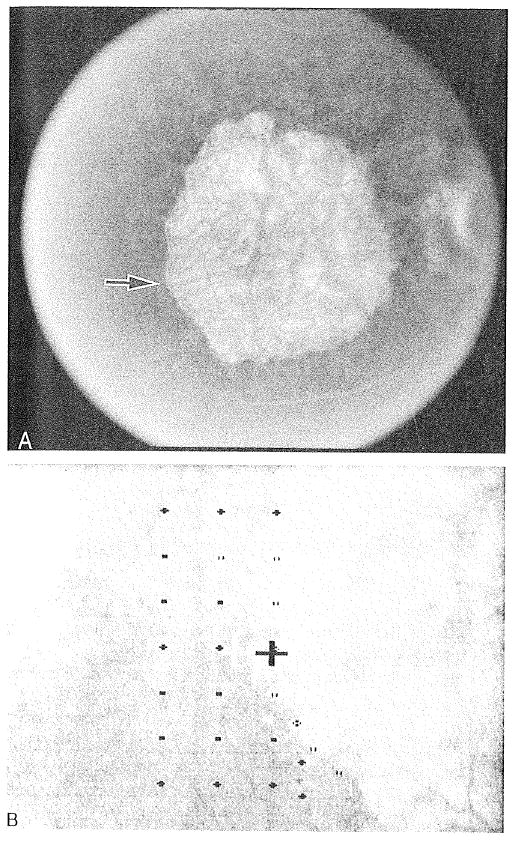
Right eye. Visual acuity was 20/145. A, fluorescein angiography at baseline shows a large, discrete, hyperfluorescent area corresponding to the central geographic atrophy, measured as 8.4 disc areas in size. B, in scanning laser ophthalmoscope (SLO) testing, fixation was placed so that the area of atrophy was immediately to the right of fixation. There was a dense scotoma corresponding to the atrophy. In the SLO image, the thick white cross is the fixation target for the patient. The black cross is not seen by the patient. Open symbols = an area with a dense scotoma; closed symbols = a seeing area. The narrower cross is used for landmark registration. On the fluorescein angiographic images, the arrow indicates the site of fixation as determined by SLO testing.
Figure 2.
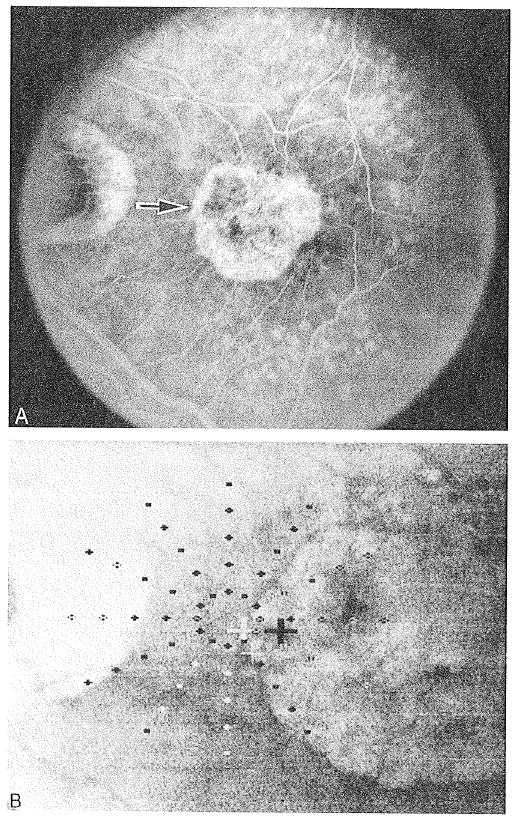
Left eye. Visual acuity was 20/145. A, fluorescein angiography at baseline shows a large discrete hyperfluorescent area corresponding to the central geographic atrophy, measured as 2.3 disc areas in size. B, in scanning laser ophthalmoscope (SLO) testing, fixation is placed so that the atrophy is immediately to the right. There is a dense scotoma corresponding to the central atrophy and to the peripapillary atrophy. Fixation is placed with the central scotoma to the right, despite the limiting peripapillary atrophy to the left. In the SLO image, the thick white cross is the fixation target for the patient. The black cross is not seen by the patient. The open symbols indicate an area with a dense scotoma, whereas closed symbols indicate a seeing area. The narrower cross is used for landmark registration. On the fluorescein angiographic images, the arrow indicates the site of fixation as determined by SLO testing.
To determine whether the proximity of the fovea to the fixation site was a factor driving the fixation preferences, the location of the fovea relative to the atrophy was categorized as being in the left, central, or right one third of the atrophy, and in the upper, middle, or lower one third of the atrophy on the retina (Table 2). For the 24 eyes with fixation outside the atrophy that had adequate photographic data, 15 had the fovea within the central one third horizontally, and all except 1 eye had the fovea within the middle one third vertically. Five eyes had foveal location in the right one third of the atrophy on the retina. Based on proximity, one would assume these eyes would fixate with the scotoma to the left so that fixation is near the right edge. However, only two of the eyes assumed this pattern of fixation with the scotoma to the left (accounting for 2 of 3 eyes with adequate photographic data that fixated with the scotoma to the left). The remaining three eyes fixated with the scotoma to the right. Thus, the preference for fixation with the scotoma to the right appears to override the consideration of proximity to the fovea, whereas fixation with the scotoma to the left appears to be more narrowly limited to eyes in which the fovea is near the right edge of the scotoma. Foveal position does not appear to explain the second most-selected preference for fixating so that the scotoma is superior.
Table 2.
Fixation Patterns as a Function of Foveal Position in Atrophy
| Horizontal Foveal Position in Atrophy (in thirds) | Vertical Foveal Position in Atrophy (in thirds) | ||||||
|---|---|---|---|---|---|---|---|
| Fixation Pattern (n = 24) | No. of Eyes | Left | Central | Right | Upper | Middle | Lower |
| Fixates with scotoma to right (SC RT) | 16 | 4 | 9 | 3 | 0 | 15 | 1 |
| Fixates with scotoma to left (SC LT) | 3 | 0 | 1 | 2 | 0 | 3 | 0 |
| Fixates with scotoma above (SC AB) | 5 | 0 | 5 | 0 | 0 | 5 | 0 |
An author who was masked to the baseline fixation pattern reviewed the SLO perimetry that was available for subsequent years. All the 14 eyes with the scotoma placed to the right at the first visit retained that fixation pattern at the next annual visit, and the six who were seen again at 2 years also retained this pattern. Three of the four eyes with the scotoma placed superiorly remained in this pattern for the next annual visit, and two of four eyes with the scotoma placed to the left retained this pattern at the next annual visit and for 2 additional years of follow-up. The patients with fixation within the atrophy or in clear zones in the atrophy were variable over time.
Letter and word reading were assessed in the SLO. There was a minimal difference between the visual acuity measured using the SLO and the visual acuity measured using the Early Treatment Diabetic Retinopathy Study chart (−0.03 logMAR, or 1.5 letters), supporting the assumption that the same site to perform reading tasks was used in the SLO and in more conventional viewing situations. Letters were fixated at the same site as the fixation cross during perimetry. Most patients also fixated words in this location. However, two patients, who fixated the cross with the scotoma to the right, placed words below the scotoma in visual field space. Two other patients tried both sides of the scotoma for reading words. One patient used a letter fixation site with the scotoma to the right as in perimetry, but at a location superior in the visual field to the site of fixation of the cross.
Comparison with Fixation Patterns in Stargardt Disease
A different pattern of fixation from GA was noted in most of the patients with Stargardt disease. There was a dense scotoma corresponding to the atrophic macular lesion in each eye. Nine of the ten eyes fixated with the scotoma superior to fixation in visual field space (on the retina, this corresponds to fixating superior to the atrophy); the tenth eye fixated in a clear region within the atrophy. However, in only two of the nine eyes (both in the same patient), the fixation was at the edge of the atrophy and scotoma (as was seen in the patients with GA). The remaining seven eyes did not fixate at the edge of the scotoma or atrophy, but rather at a significant distance from the edge. Figures 3 and 4 show two patients for whom this is true. For all seven eyes, there were at least 2° (600 μm) of seeing retina between the fixation location and the dense scotoma. The intervening retina in some eyes had a slight decrease in retinal sensitivity, but this was not different in degree from the relative scotomas seen in some patients with GA at the borders of the atrophy.1
Figure 3.
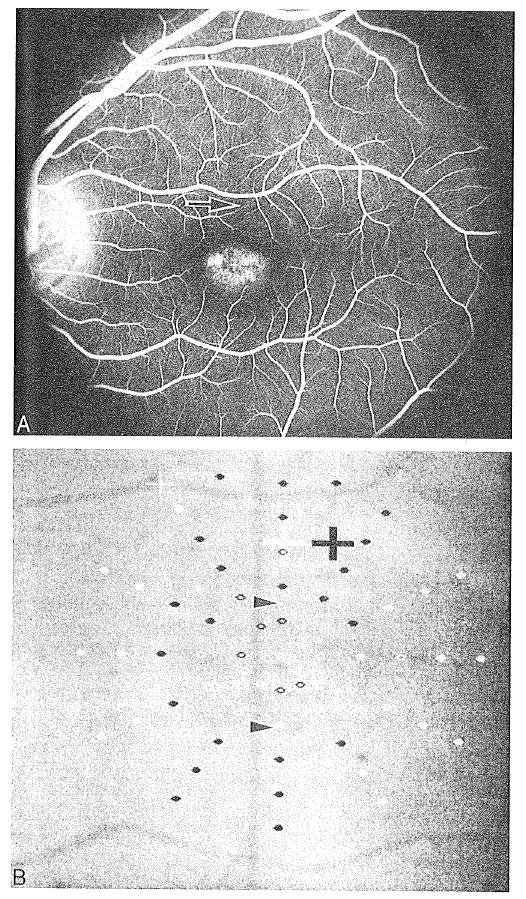
Left eye of a 12-year-old girl with Stargardt disease. Visual acuity was 20/107. A, fluorescein angiography shows a central atrophic hyperfluorescent lesion and a dark choroid. B, on scanning laser ophthalmoscope (SLO) testing, there was a dense scotoma, bounded by the arrowheads, corresponding to the hyperfluorescent area on the fluorescein angiogram. However, fixation was placed 2° superior to the margin of the dense scotoma, near the arcade vessel (marked an an arrow in Fig 3A). Letter and word reading were performed at the indicated site of fixation. In the SLO image, the thick white cross is the fixation target tor the patient. The black cross is not seen by the patient. Open symbols = an area with a dense scotoma; closed symbols = a seeing area. The narrower cross is used for landmark registration. On the fluorescein angiographic images, the arrow indicates the site of fixation as determined by SLO testing.
Figure 4.
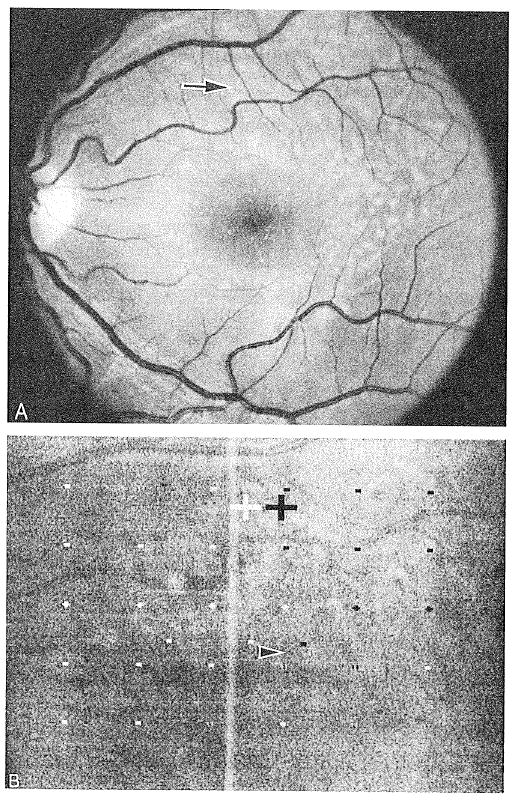
Left eye of an 18-year-old woman with Stargardt disease. Visual acuity was 20/132. A, the fundus photograph shows a poorly defined central atrophic lesion, surrounded by flecks. B, scanning laser ophthalmoscope (SLO) testing shows a central dense scotoma, with fixation nearly 4° above the superior border of the dense scotoma (arrowhead). Fixation is superior to the arcade vessel (marked by arrow on fundus photograph). Letter and word reading were performed at the indicated site of fixation. In the SLO image, the thick white cross is the fixation target for the patient. The black cross is not seen by the patient. Open symbols = an area with a dense scotoma; closed symbols = a seeing area. The narrower cross is used for landmark registration.
Size of Atrophic Area in Geographic Atrophy
Thirty-nine eyes with GA had fundus photographs from which the boundaries of the areas of atrophy could be drawn and the areas of atrophy measured. Twelve eyes had more than one atrophic area within the macular region that could affect visual performance; the secondary sites were generally small and were added to the largest site. The total area of GA for each eye ranged from 1.4 to 25.3 mm2 (median, 5.8 mm2, corresponding to a median of 3.3 da [standard Macular Photocoagulation Study disc areas, 1 da = 1.77 mm2]). There was no significant difference in mean total atrophic area among the different patterns of fixation outside the atrophy (one-way analysis of variance, F < 1). The group with fixation in a clear area within the atrophy tended to have a larger total atrophic area than the other groups.
Reading Rate
The relation of reading rate, pattern of fixation, and area of atrophy was studied. The maximum reading rate using a conventional display was measured for 32 of the study eyes, and ranged from 0 to 116 words per minute. Within the visual acuity range for subjects in this study, visual acuity accounted for less than 1% of the variability in the maximum reading rate (r = 0.03) (Fig 5). There was no statistically significant difference in the maximum reading rate for each fixation group (one-way analysis of variance, F < 1), but there was a trend toward a higher reading rate in those eyes fixating with the scotoma superiorly and a lower reading rate in those eyes with the scotoma to the left of fixation.
Figure 5.
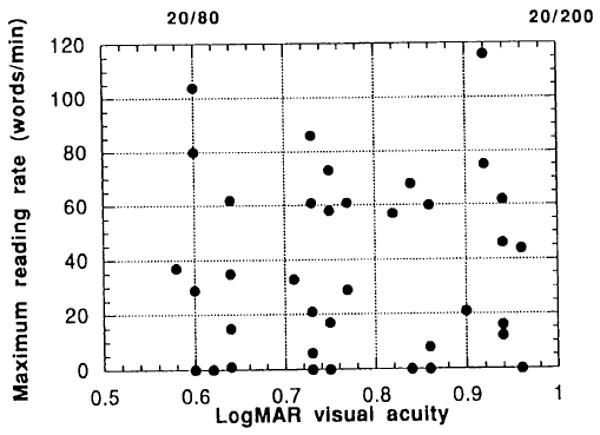
Maximum reading rate versus visual acuity. For the visual acuity range of this study (20/80–20/200, inclusive), the visual acuity accounts for less than 1% of the variability in reading rate.
There was a very strong inverse correlation (r = 0.75) of maximum reading rate with size of the atrophic area for the 30 study eyes for which both reading rate and area measurements were available (Fig 6). When only the 22 eyes with extrafoveal fixation patterns outside the atrophy are analyzed (Fig 6, solid symbols), the correlation remains equally strong (r = 0.76).
Figure 6.
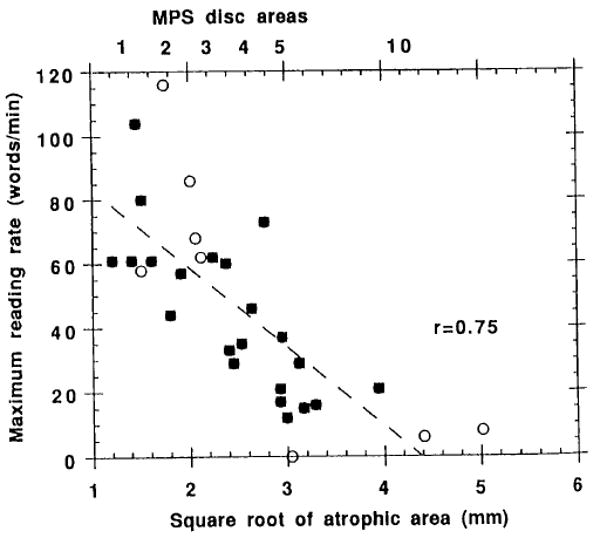
The maximum reading rate in words per minute as a function of size of the atrophic area (in millimeters square on the retina). The equivalent in Macular Photocoagulation Study disc areas is given at the top of the graph. Expressing size as the square root of area makes the distribution most normally distributed. There is a very strong inverse correlation of reading rate with square root of atrophic area (r = 0.75 for all eyes). Open symbols = eyes in which fixation was placed within the atrophy (either unseen on atrophic regions, or in clear regions); closed symbols = eyes that fixated outside the atrophy (r = 0.76).
There was a significant difference in the maximum reading rate between those eyes that were better-seeing for the patients and those that were the worse-seeing (means, 55 versus 32 words per minute, respectively; Student's t test t = 2.28, P = 0.03). Within these two subgroups, maximum reading rate remained highly correlated with the size of the atrophic area (r = 0.73 for the better-seeing eyes; r = 0.87 for the worse-seeing eyes).
The critical character size did not correlate with the size of the atrophic area (r = 0.15) or with the location of fixation (one-way analysis of variance, F < 1). There was only weak correlation (r = 0.38) with visual acuity within the range tested.
There was no significant correlation of maximum reading rate with lens opacity (r = 0.17), and there was no significant difference in maximum reading rate between phakic and pseudophakic eyes (Student's t test t = 0.24; P = 0.81), despite a trend toward larger atrophic area size in phakic eyes.
There was no significant correlation with age of size of atrophic area (r = 0.19), maximum reading rate (r = 0.02), or fixation pattern (one-way analysis of variance, F = 1.17, P = 0.34) within the group of GA eyes.
Discussion
Fixation Patterns in Patients with Geographic Atrophy
Geographic atrophy, by perhaps being more symmetric about the fovea than other conditions, offers a good substrate for studying fixation preferences. Reading studies using subjects with normal sight have shown that textual information is obtained more efficiently from the right visual field than the left (at least for readers of the English language).8 Thus, one would expect subjects with macular scotomas to fixate to the right of the scotoma (placing the scotoma to the left). This expectation is contradicted by the current findings. The preference for fixation to the left, with the scotoma to the right, as was found in the patients with GA, has been found in other studies of patients with central scotomas.9 Scotomas in this location tend to cut off the ends of the fixated words, or the beginning of the next word, during reading. The presence of a scotoma at the beginning of a word or line can be more troubling because of the need to find the beginning of a line or the words just read,9 although one could equally well make an argument emphasizing the value of seeing the words to come, which would run counter to these fixation findings.
Eighteen percent of the GA eyes with a fixation site outside the atrophy adopted a site that placed the scotoma above fixation in visual field space (i.e., fixation was superior to the atrophy on the retina). This also has been a common pattern in age-related macular degeneration,9 and is the main location of fixation for eyes with macular holes.10,11 This positioning also was seen in all eyes in this study with Stargardt disease that fixated outside the dense scotoma, and in most eyes with Stargardt disease in another study.12 Teleologically, this is the preferred site for scotoma placement, because the field above fixation is less used than that below in most everyday tasks, and placement of the scotoma above fixation allows for reading in an unobscured manner. It was surprising then that more patients with GA did not have this pattern of fixation. There were two patients who fixated with the scotoma superior and to the right of fixation. These patients were classified in this study as fixating with the scotoma superior, and we did not underestimate fixation with the scotoma superior in this study. One can hypothesize that GA may have a somewhat lower prevalence of fixation with the scotoma superior because of the natural progression of GA2 (Sunness et al, unpublished data; presented as a paper at the 1996 ARVO Annual Meeting, Fort Lauderdale). Geographic atrophy begins with scattered small foci of atrophy in the parafoveal region. Over time, GA progresses with enlargement and coalescence of the atrophic regions. A horseshoe of atrophy often develops, with an open seeing region to the right or left, with the foveal center still spared in the clear central zone of the atrophic horseshoe. Over time, the horseshoe closes into a ring, and then gradually the fovea is encroached upon, until foveal vision is lost. It may be that the patient becomes accustomed to having a wider horizontal than vertical seeing region when in the stage of GA with a horseshoe scotoma, and this may translate later into preferring to place fixation to the side rather than below the scotoma in visual field space. The baseline pattern of fixation was stable during follow-up for fixation with the scotoma to the right and above, but less so for the other patterns.
None of the patients in this study used a fixation site such that the scotoma was inferior to fixation. In other contexts, we occasionally have seen patients fixate in this manner. This study and the others cited above suggest that this would be infrequent, and probably would be a choice dictated by the location of the fovea relative to the atrophy.
Fixation Patterns in Patients with Stargardt Disease
The fixation pattern of the eyes of the patients with Stargardt disease was different from the those with GA. As noted above, all patients with Stargardt disease with fixation outside the atrophic lesion chose to fixate superior to the central lesion on the retina (with the scotoma superior to fixation in visual field space). Apart from the advantages of this position described above, many patients with Stargardt disease appear to have lesions that are wider horizontally than vertically, so that one would assume that placement of fixation superior on the retina to the lesion (with the scotoma superior to fixation in visual field space) would confer a significant advantage in terms of proximity to the fovea relative to fixating to the right or the left. However, in seven of the ten Stargardt eyes, fixation and letter reading were not at the margin of the lesion but were a significant distance away from the border of the dense scotoma and atrophic lesion seen on fundus examination. This finding suggests that visual acuity in this condition may be worse than one might expect based on the size of the atrophic lesion. In some patients, the seeing retina intervening between the dense scotoma and the fixation site has a mild relative scotoma, but this level of retinal sensitivity was also common in patients with GA who fixated immediately adjacent to the atrophy and dense scotoma. This finding bears more study, but it suggests that there may be “subclinical” pathology that is affecting visual performance even though it is not visualized on ophthalmoscopy or fluorescein angiography. A recent report of indocyanine green angiography in Stargardt disease suggests that there is more extensive pathology than is seen with fundus examination or fluorescein angiography.13 Further study of what limits the use of seeing retina in eyes with Stargardt disease may shed further light on this disorder and help patients with this condition use their remaining seeing retina more effectively.
Reading Rate
The fixation pattern did not correlate with maximum reading rate (nor with size of atrophic area) in the eyes of the patients with GA. The number of eyes in some of the subgroups was small and may have masked an effect. The reading test used paragraphs of random words that would minimize the benefit of seeing earlier or later words that would be conferred in normal paragraph reading. It may be that the fixation patterns are chosen on some other basis than reading performance, although Guez et al (unpublished data; presented at the 1995 SLO Meeting, San Antonio, October 1995) recently showed a reversal of the preference for scotoma to the right in native readers of languages that are read from right to left.
Maximum reading rate strongly correlated with the size of the atrophic area. Within the range of visual acuities included (i.e., 20/80–20/200), visual acuity accounted for less than 1% of the variability in maximum reading rate. These findings suggest that an intervention that could slow the spread of atrophy could be beneficial for visual performance even when a central scotoma is already present. The highest correlation was found with the square root of the area, suggesting that a linear dimension (for example, the horizontal or vertical length of the scotoma) may be the significant factor involved. The area of the atrophy was clearly the major determinant of maximum reading rate in our patients with GA.
Acknowledgments
The authors thank Dr. Neil Bressler, Ms. Judith Alexander, and Ms. Yan Tian for analyzing the fundus photographs and calculating the size of the atrophic area. The authors also thank the following physicians for referring the patients included in this study: Lisa Abrams, Neil Bressler, Susan Bressler, Stuart Dankner, J. P. Dunn, Michael Elman, Stephen Feinberg, Dan Finkelstein, Richard Hairston, Julia Haller, James Kelley, Robert Liss, Irvin Pollack, and Andrew Schachat.
Supported by research grants NE1 EY08552 (Drs. Sunness, Applegate, and Haselwood) and EY06380 (Drs. Rubin and Sunness), Bethesda, Maryland; and from the Harry and Jeanette Weinberg Foundation, Baltimore, Maryland, the Altsheler-Durell Foundation, Louisville, Kentucky, the Grousbeck Family Foundation, Boston, Massachusetts, and the Macula Foundation, New York, New York, for work with the scanning laser ophthalmoscope.
Footnotes
Presented in part as a poster at the American Academy of Ophthalmology Annual Meeting, Atlanta, Oct/Nov 1995.
The authors have no proprietary interest in the development or marketing of any product mentioned in this article.
References
- 1.Sunness JS, Schuchard R, Shen N, et al. Landmark-driven fundus perimetry using the scanning laser ophthalmoscope (SLO) Invest Ophthalmol Vis Sci. 1995;36:1863–74. [PMC free article] [PubMed] [Google Scholar]
- 2.Sarks JP, Sarks SH, Killingsworth MC. Evolution of geographic atrophy of the retinal pigment epithelium. Eye. 1988;2:552–77. doi: 10.1038/eye.1988.106. [DOI] [PubMed] [Google Scholar]
- 3.Sunness JS, Johnson MA, Massof RW, et al. Retinal sensitivity over drusen and nondrusen areas. A study using fundus perimetry. Arch Ophthalmol. 1988;106:1081–4. doi: 10.1001/archopht.1988.01060140237032. [DOI] [PubMed] [Google Scholar]
- 4.Sunness JS, Bressler NM, Maguire MG. Scanning laser ophthalmoscope analysis of the pattern of visual loss in age-related geographic atrophy of the macula. Am J Ophthalmol. 1995;119:143–51. doi: 10.1016/s0002-9394(14)73866-8. [DOI] [PubMed] [Google Scholar]
- 5.Taylor HR, West SK. The clinical grading of lens opacities. Aust N Z J Ophthalmol. 1989;17:81–6. [PubMed] [Google Scholar]
- 6.Chamberlin JA, Bressler NM, Bressler SB, et al. The use of fundus photographs and fluorescein angiograms in the identification and treatment of choroidal neovascularization in the Macular Photocoagulation Study. Ophthalmology. 1989;96:1526–34. doi: 10.1016/s0161-6420(89)32707-2. [DOI] [PubMed] [Google Scholar]
- 7.Legge GE, Ross JA, Luebker A, et al. Psychophysics of reading. VIII. The Minnesota Low-Vision Reading Test. Optom Vis Sci. 1989;66:843–53. doi: 10.1097/00006324-198912000-00008. [DOI] [PubMed] [Google Scholar]
- 8.Rayner K, Well AD, Pollatsek A. Asymmetry of the effective visual field in reading. Perception and Psychophysics. 1980;27:537–44. doi: 10.3758/bf03198682. [DOI] [PubMed] [Google Scholar]
- 9.Guez JE, Gargasson JFL, Rigaudiere F, et al. Is there a systematic location for the pseudo-fovea in patients with central scotoma? Vision Res. 1993;9:1271–9. doi: 10.1016/0042-6989(93)90213-g. [DOI] [PubMed] [Google Scholar]
- 10.Sjaarda RN, Frank DA, Glaser BM, et al. Assessment of vision in idiopathic macular holes with macular microperimetry using the scanning laser ophthalmoscope. Ophthalmology. 1993;100:1513–8. doi: 10.1016/s0161-6420(93)31448-x. [DOI] [PubMed] [Google Scholar]
- 11.Acosta F, Lashkar K, Reynaud X, et al. Characterization of functional changes in macular holes and cysts. Ophthalmology. 1991;98:1820–3. doi: 10.1016/s0161-6420(91)32044-x. [DOI] [PubMed] [Google Scholar]
- 12.White JM, Bedell HE. The oculomotor reference in human with bilateral macular disease. Invest Ophthalmol Vis Sci. 1990;31:1149–61. [PubMed] [Google Scholar]
- 13.Wroblewski JJ, Gitter KA, Cohen G, et al. Indocyanine green angiography in Stargardt's flavimaculatus. Am J Ophthalmol. 1995;120:208–18. doi: 10.1016/s0002-9394(14)72609-1. [DOI] [PubMed] [Google Scholar]