

Abstract
Purpose
Geographic atrophy (GA) may cause significant compromise of visual function, even when there still is good visual acuity (VA), because of parafoveal scotomas and foveal function abnormalities antedating visible atrophy. This study evaluates the visual function abnormalities at baseline and the 2-year worsening of VA and reading rate for eyes with GA compared with a group of eyes with drusen only.
Methods
Seventy-four eyes with GA and VA greater than or equal to 20/50 from a prospective natural history study of GA were included, as were 13 eyes with only drusen. Baseline visual function testing and 2-year VA and maximum reading rate are reported.
Results
The worsening of VA in decreased luminance and foveal dark-adapted sensitivity showed severe abnormalities for the GA group. Contrast sensitivity was significantly reduced for the eyes with GA. Half the eyes with GA, but none of the drusen eyes, had maximum reading rates below 100 words per minute. A scanning laser ophthalmoscope (SLO) measure of the scotoma near fixation combined with a measure of residual foveal function accounted for 54% of the variability in maximum reading rate in the eyes with GA.
Of 40 eyes with GA observed for 2 years, half lost greater than or equal to 3 lines of VA and one quarter lost greater than or equal to 6 lines. The nine eyes with drusen with follow-up had no significant change in VA. Low foveal dark-adapted sensitivity, SLO measures of the scotoma within 1° of fixation, and low maximum reading rate were statistically significant risk factors for doubling of the visual angle. Significant reduction in maximum reading rates at 2 years was present for the eyes with GA.
Conclusions
The eyes with GA with good VA have profound decreases in visual function, particularly in dim lighting and in reading. Half the eyes with GA had doubling in visual angle at 2 years after the baseline examination, whereas the drusen eyes remained essentially unchanged. Impaired visual function at baseline was predictive of an adverse outcome for the eyes with GA.
Geographic atrophy (GA) of the retinal pigment epithelium (RPE) is a form of advanced age-related macular degeneration (AMD) that can cause central visual loss. It differs from neovascular AMD, the other form of advanced AMD that includes choroidal neovascularization (CNV) and subretinal fibrosis (disciform scarring), in that GA tends to spare the foveal center until late in the disease. Although GA is responsible for approximately 20% of all patients with visual acuity (VA) of 20/200 or worse from advanced AMD,1,2 more than half of all patients with GA do not have severe VA loss2 and yet may be compromised in everyday vision-related activity. Therefore, the full impact of GA is not reflected by the severe VA loss statistic.
Studies of GA have been limited in scope, but suggest that GA often begins as one or more foci of atrophy in the parafoveal region. Over the course of months to years, more of these foci develop, enlarge, and coalesce, leading to a horseshoe of atrophy surrounding, but still sparing, the fovea. Eventually, the horseshoe closes to form a ring of atrophy surrounding the fovea. Finally, the fovea itself becomes atrophic, and the patient must use nonfoveal retina for visual tasks.3,4 Areas of GA are associated with absolute scotomas.5,6 Thus, for a period of years, many patients with GA have good VA because of foveal preservation but are limited by the scotomas surrounding the fovea. For example, a patient may have VA of 20/40 or better, but be unable to fit more than a few letters of a word or a full face in the seeing foveal region (Fig 1). Patients sometimes report the seemingly paradoxic situation of being able to read newsprint, but not news headlines, because the headline letters are too large to fit in the spared region. Such a patient will have difficulty reading and recognizing faces over and above what one would predict on the basis of VA alone. In addition, previous work has shown that even when the VA is good in GA, there still may be decreased function in dim illumination, reflected by patient-reported problems of difficulty adapting to the dark or craving more light to read better and by having decreased dark-adapted foveal sensitivity (Steinmetz RL, Walter D, Fitzke F. ARVO abstract. Invest Ophthalmol Vis Sci 1991; 32:711).7,8 To characterize and quantify these visual impairments in GA, we describe visual function abnormalities among those eyes with GA and good VA (better than 20/50) in patients enrolled in a prospective National Institutes of Health-funded study of the natural history and the risk factors for the progression of GA. We also report abnormalities in contrast sensitivity that are present before the center of the fovea itself becomes atrophic and the extent of the scotomas present around fixation. The impact of these changes on reading performance is evaluated.
Figure 1.
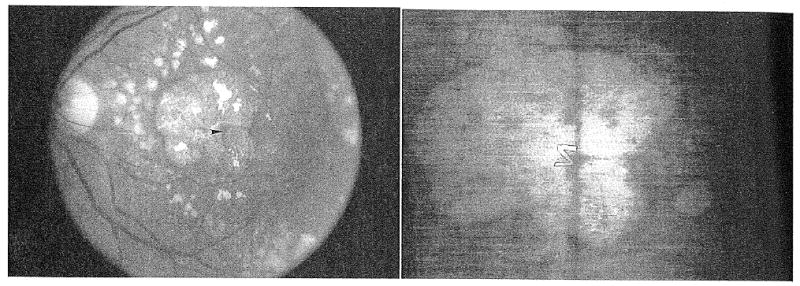
(Left) This eye has a small central spared region (arrowhead) surrounded by geographic atrophy. There was a dense scotoma corresponding to the area of atrophy. (Right) Scanning laser ophthalmoscope retinal image of the patient attempting to read the letter ‘Z’ of size 20/240. The letter on the photographed retinal image has been outlined in pencil to improve visibility. The entire 20/240 letter does not ‘fit’ within the central spared region, and the patient was unable to read it. However, she was able to read small letters down to 20/40 in size (because these smaller letters fit into the spared region).
The visual prognosis of eyes with GA and good VA has not been investigated thoroughly, although earlier studies have provided some insight into the progression of GA and the loss of VA.3,9,10 We have documented quantitatively the 2-year VA outcome for these eyes with GA with good VA initially and the relation of doubling of the visual angle to baseline visual function characteristics and scotoma size and location. We also have looked at the maximum reading rate at 2 years. A group of eyes with only drusen or pigmentary alteration or both and no advanced AMD underwent the same visual function testing, and 2-year VA data for this group are reported as well.
Methods
Patients with Geographic Atrophy
From March 1992 through September 1996, 153 patients with GA were enrolled in a prospective natural history study of GA. The criteria for GA were at least one area of discrete retinal pigment epithelial atrophy of at least 500 μm in diameter within one disc diameter of the fovea, in at least one eye, with no significant concurrent eye disorder in the study eye (other than lens changes), and no evidence of choroidal neovascularization in the study eye on a baseline fluorescein angiogram. Patients with phakia, pseudophakia, and aphakia were enrolled. Of the 153 patients enrolled, 74 had GA with VA better than 20/50, defined here as “good acuity,” in at least 1 eye. Twelve of the 74 patients had GA with good acuity in both eyes, but given the high correlation of visual function between eyes, data from only 1 eye of each patient were analyzed. For 10 of these 12 patients, the eye with the better VA was chosen as the study eye for analysis; for 2 patients with equal VA in both eyes, the right eye was chosen arbitrarily as the study eye for analysis.
For 40 of 74 patients with GA with good VA initially, 2-year follow-up data are available. Thirty-seven patients completed a 2-year follow-up examination, defined as a follow-up examination taking place between 18 and 30 months after the baseline examination. Three other patients completed a 1-year follow-up examination and a 3-year follow-up examination but missed the window for the 2-year follow-up examination. Two of these patients already had lost more than three lines of acuity (doubled the visual angle) by the 1-year examination and had similar acuities at the 3-year examination. The third patient had preserved good acuity at the same level for the 1-year and 3-year examinations. The differences in acuity between the 1- and 3-year examinations were 0 for one patient and 0.04 logarithm of the minimum angle of resolution (logMAR) units for the other two patients. The 2-year VA for these three patients is given for the purpose of analysis as the means of the first- and third-year visits. Thus, data regarding the doubling of the visual angle by the 2-year follow-up examination are available for 40 (54%) of the 74 patients with good acuity at baseline; data from these eyes have been used for preliminary risk factor evaluations. Data from patients who completed only the 1 -year visit were not used, even if there had been a three-line VA loss by that time, to avoid potential bias.
Eyes with Drusen
All patients older than 60 years of age with VA better than 20/50 in at least one eye with, at most, early AMD (i.e., only drusen and pigmentary change) and no advanced AMD, in either eye, and with no other significant ocular disease other than lens changes in the study eye who underwent the same set of tests as the GA study participants are included for comparison. The patients with drusen included those who had been observed in previous studies of AMD at Wilmer, and patients who were referred for the GA study but were found not to have GA. Thirteen patients satisfied these criteria. Because of the high correlations between eyes in patients who satisfied these criteria in both eyes, only one eye of each patient was chosen for inclusion. During the early portion of the study, only the better-seeing eye of the patient with drusen underwent complete testing. If only one eye had undergone complete testing, that eye was chosen as the study eye. If both eyes underwent complete testing, the eye with the worse VA (but still better than 20/50) was included as the study eye, to be more comparable to the eyes with GA in VA. This resulted in the eye included in the analysis being the better-seeing eye in six patients and the worse-seeing eye in seven patients. Selection of an appropriate comparison group for elderly patients often is difficult, and issues related to this selection are presented in the Discussion section. These patients were asked to return biannually for follow-up. Two-year follow-up data are available for 9 of the 13 drusen eyes.
In addition to the two groups of eyes presented in detail, we have findings for eight eyes with good acuity and only early AMD in one eye and GA in the fellow eye. For five of these patients, the eye with GA had good acuity and is part of the GA group described above; for three patients, the VA in the GA eye was worse than 20/50. This group is mentioned briefly in the discussion.
The institutional review board of the Johns Hopkins University School of Medicine approved the study, and written informed consent was obtained from all patients.
Tests Performed
The patients who participate in the study undergo a set of visual function tests at the first visit, and these tests are repeated at each annual visit. This article reports the visual function findings at the baseline visit, and the VA and maximum reading rate at the 2-year follow-up visit.
Visual Acuity
Best-corrected VA for each eye was measured using a back-lit Early Treatment Diabetic Retinopathy Study (ETDRS) chart with luminance of 130 cd/m2 and a standard protocol for refraction and measurement of VA. The ETDRS chart was 3 m from the patient for the study eyes. A testing distance of 1 m was used for fellow eyes with VAs less than 20/267 or eyes unable to read one or more lines at 3 m in decreased luminance (see below). The patient began at the top of the chart and continued reading until he or she could no longer read three of the five letters on a line. This line was given as the acuity, with letters added for letters read on lines with smaller letters and letters subtracted for letters missed on the acuity line. Acuity was converted to logMAR, which was used in all analyses. In this article, acuities will be expressed both in logMAR and in Snellen notation. In the ETDRS chart, the logMAR letter size of any line is 0.1 log unit smaller than that of the line above. A loss of three lines in acuity corresponds to a logMAR increase of 0.3, which is equal to a doubling of the minimum angle of resolution.
Visual Acuity in Decreased Luminance
Best-corrected VA for each eye then was measured under conditions of reduced luminance. A neutral density filter causing a reduction of 1.5 log unit in luminance was placed in front of the eye tested, and the patient began from the top of a different ETDRS chart and continued to read as far as possible. Scoring was done as for standard VA. To compensate for any delay in adaptation, the patient then was given an additional 5 minutes to adapt to reduced illumination, and the VA was remeasured with the neutral density filter in place.
Contrast Sensitivity
Contrast sensitivity was measured using a cathode ray tube display and sine wave gratings. Five spatial frequencies were tested: 1.5, 3.0, 6.0, 12.0, and 18.0 cycles per degree (cpd) using a two-alternative forced-choice staircase procedure.11
Reading
Reading was measured using random words. Text was displayed on a 19-inch black-and-white television monitor controlled by a laboratory computer. Dark letters were presented on a bright background of 181 cd/m2 at a contrast of 97%. Text was composed of random words selected from a list of the 300 most common 3-, 4-, 5-, and 6-letter words.12 A paragraph of random words was presented for 15 seconds and the subject read the words aloud. Reading rate (in words per minute [wpm]) was computed from the number of words read correctly. Nine different character sizes were used, ranging from 12.6 to 75.5 minutes of arc. The maximum reading rate and the critical character size, defined as the smallest character size for which the patient attained 90% of the maximum reading rate, were determined.
Foveal Dark-adapted Sensitivity
Dilating drops were instilled and the study eye was patched for 40 minutes of dark adaptation. After this, foveal dark-adapted sensitivity to a 1.8° red light flash of 0.5 second in duration was evaluated using a Tubingen perimeter by a technique described previously.7,13
Scanning Laser Ophthalmoscope Perimetry
This macular perimetry then was performed on the study eye using the SLO. The SLO allows the operator to view the retinal image on a monitor in real time, with the stimuli seen at their retinal location. The patient was instructed to look at a 1° fixation cross generated by the SLO. The position of fixation relative to retinal landmarks and to areas of observed atrophy was noted. Perimetry then was performed to determine the sites of scotoma.
For the SLO perimetry, a landmark-driven fundus perimetry technique was used, which is described in detail elsewhere.6 Briefly, this technique corrects stimulus position for eye movements and provides for a standardized way of testing the central retina within 5° of fixation. For this study, a circular grid of points was used. Twelve points (meridia) on each of 5 concentric circles centered on fixation are tested. The circles are spaced 1° apart, so that 60 points within 5° of fixation are tested. The order of stimulus presentation is randomized. To present each stimulus, the operator positions a cursor over a prespecified landmark and presses a button. The computer then presents the stimulus at a location corrected for any movement in the landmark location, so that the proper retinal site is tested even if the eye has moved. When testing is completed, a retinal image is grabbed, the location of the landmarks is defined, and the results of testing are displayed in their correct retinal position, with symbols denoting whether the stimulus was seen at each retinal site (Figs 2 through 4). A maximal stimulus intensity is used to test for a dense scotoma. The stimulus duration is 400 msec, size is 10 minutes of arc (40 μm), and maximal stimulus intensity is approximately 70,000 td. The number of points (of 12) with a dense scotoma in the central circle at 1° from fixation (inner scotoma points) and the total number of dense scotoma points (of 60) within 5° eccentricity of the center (total scotoma points) were determined.
Figure 2.
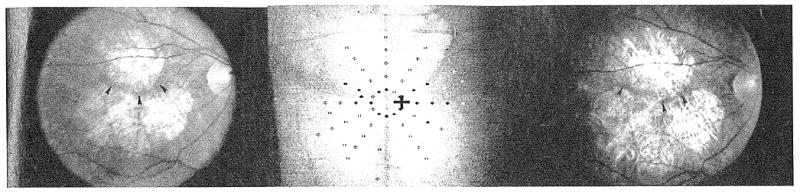
(Left) Fundus photograph of geographic atrophy (GA) at baseline. Visual acuity was 20/29, and maximum reading rate was 110 words per minute. There were areas of GA superior and inferior to the fovea, with a roughly horizontal small spared retinal region (arrowheads). (Center) Scanning laser ophthalmoscope map of dense scotoma at the baseline visit. The white cross in the center of the grid is the fixation cross. The patient does not see the black cross. Solid symbols indicate where the stimulus was seen, and open symbols indicate where the stimulus was not seen (dense scotoma). The symbol may be black or white, depending on the background color. The areas with GA had a dense scotoma, and there was a preserved horizontal strip of seeing retina from the 2 o'clock to the 3 o'clock positions, and from the 9 o'clock to the 10 o'clock positions. There were 3 inner scotoma points, and 39 total scotoma points. (Right) Fundus photograph of GA at 2-year visit. Visual acuity was 20/29, unchanged from the baseline, but maximum reading rate decreased to 51 words per minute. The fundus photograph shows narrowing of the horizontal strip of uninvolved retina (arrowheads) and enlargement of the areas of GA.
Figure 4.
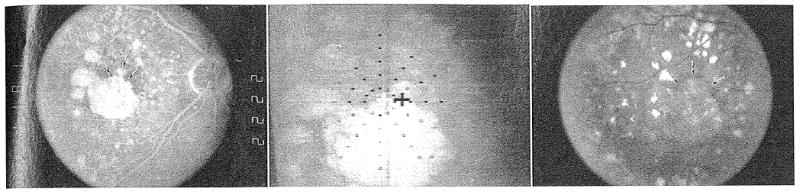
(Left) Fluorescein angiogram of geographic atrophy (GA) at baseline. Visual acuity was 20/44, and maximum reading rate was 72 words per minute. The arrows delineate the superonasal extent of the large GA area, and the presence of a small additional area of GA just superior to this region. Several other small areas of atrophy are also present. (Center) Scanning laser ophthalmoscope map of dense scotoma at the baseline visit. The white cross in the center of the grid is the fixation cross. The patient does not see the black cross. Solid symbols indicate where the stimulus was seen, and open symbols indicate where the stimulus was not seen (dense scotoma). The symbol may be black or white, depending on the background color. Fixation at baseline is superior to the large area of GA, just inferotemporal to the small area of GA shown by the middle arrow in Figure 4, left. There was a dense scotoma corresponding to the areas of atrophy. There were 5 inner scotoma points and 31 total scotoma points. (Right) Fundus photograph of GA at 2-year visit. Visual acuity was 20/289, 8 lines worse than the baseline visit, and maximum reading rate was 44 words per minute. The GA has enlarged. The large area of GA has coalesced with the small area of GA superonasally (arrows) and now includes the foveal region.
The landmark-driven fundus perimetry technique was introduced in March 1993 and was used on all patients from June 1993 on. The patients first seen before this time were tested using a manual technique with registration of landmarks after stimulus presentation. The manual technique did not allow for the same uniform testing of the field as the above-described technique.6 Fourteen eyes with GA tested using the manual technique had adequate testing of the visual field to determine the number of inner and total scotoma points when the data were converted to the circular grid pattern. Three other eyes with GA had inadequate data collected, and their SLO results are not included. Three additional patients with GA had baseline examinations in July 1994 when the SLO was not functioning.
Clinical Evaluation
All patients underwent a clinical evaluation at each visit, including evaluation of the anterior segment, lens, and intraocular pressure, and a dilated funduscopic evaluation using an indirect ophthalmoscope and 90-diopter slit-lamp biomicroscopy. For eyes that were phakic, the lenses were graded at the slip lamp by the first author using a modification of the system by Taylor and West.14 Nuclear opacity was assessed using a comparison slide, the number of clock hours of cortical opacity was noted, and the size of any posterior subcapsular change was assessed. For eyes that were pseudophakic, the presence of posterior capsular opacification or the presence of a clear central path was noted. Fundus photographs were obtained at each study visit. A baseline fluorescein angiogram was performed; eyes with evidence of choroidal neovascularization or any retinal disease other than atrophic AMD and GA were excluded.
Data Analysis
Distributions of individual baseline characteristics classified in ordered categories, VA scores, changes in VA scores, and visual function measurements have been compared by Wilcoxon rank–sum test with calculations performed using JMP 3.1.5 software (SAS Institute, Cary, NC). Correlation among visual function measures was assessed using the Spearman correlation coefficient and pairwise comparisons. The test for trend for the visual function measures within VA subgroups was performed using Cuzick's method.15,16 Univariate and multiple regression techniques were used to determine which variables were important in determining maximum reading rate. For the VA in decreased luminance, foveal dark-adapted sensitivity, and contrast sensitivity, data were included for eyes unable to see the maximum stimulus, and the level at or just above the maximum stimulus was taken as the functional measure. The conclusions are not changed if these data points are excluded. Ninety-five percent confidence limits on the relative risk of visual angle doubling in 2 years were computed by the method of Katz et al.17
There was some variation in testing during the first year of the study, as procedures were established and refined. All available data were used, and the number of patients tested for each visual function measure are given.
We chose to use the reduction in VA at the 2-year visit as our outcome measure. If one analyzes instead the rate of visual loss (i.e., the logMAR change per 24 months with time as a continuous variable) rather than considering the change by the 2-year visit, only one eye would change for the outcome of doubling of visual angle. Therefore, the VA of the 2-year visit is used for analysis in this study.
Results
Visual Function in Patients with Geographic Atrophy and Patients with Drusen
Table 1 provides demographic information for the patients with GA and the patients with drusen. The age range at baseline was 63 to 89 years. The median for the patients with GA was 76.4 years, and the median for the patients with drusen was 71.6 years (Wilcoxon rank–sum test, P = 0.04). Forty-three patients with GA (58%) had GA in the fellow eye as well, and 20 patients (27%) had CNV in the fellow eye at baseline. Ten patients with GA had drusen or pigmentary alteration in the fellow eye; one patient with questionable GA in the fellow eye also is included in this group. One patient had a corneal leukoma in the fellow eye that precluded macular evaluation. In the drusen group, 12 patients had bilateral drusen and pigmentary alteration without evidence of advanced AMD or other retinal disease in either eye. One additional patient had drusen in the study eye and had a macular scar from a central retinal vein occlusion in the fellow eye. Of the 13 drusen study eyes, 4 had drusen larger than 250 μm, 2 had pigmentary alteration, 5 had both drusen larger than 250 μm and pigmentary alteration, and 2 had only small drusen. In both groups, most eyes were phakic and most had early nuclear opacities. Few patients had cortical changes, and none had posterior subcapsular opacities.
Table 1.
Baseline Characteristics [Number (%) of Eyes]
| GA Eyes (n = 74) |
Drusen Eyes (n = 13) |
P* | |
|---|---|---|---|
| Age (yrs) | |||
| 63–69 | 12 (16) | 4 (31) | |
| 70–79 | 39 (53) | 7 (54) | |
| 80–89 | 23 (31) | 2 (15) | |
| Median age | 76.4 | 71.6 | 0.04 |
| Gender | |||
| Male | 31 (42) | 7 (54) | |
| Female | 43 (58) | 6 (46) | 0.42 |
| Diagnosis of fellow eye | |||
| GA | 43 (58) | 0 (0) | |
| GA, with VA > 20/50 | [12 (16)] | ||
| GA, with VA ≤ 20/50 | [31 (42)] | ||
| CNV, disciform scar | 20 (27) | 0 (0) | |
| Drusen, pigmentary alteration | 10 (13) | 12 (92) | |
| Corneal scar | 1 (1) | 0 (0) | |
| Central retinal vein occlusion | 0 (0) | 1 (8) | |
| Lens status | |||
| Phakic | 57 (77) | 11 (85) | |
| Pseudophakic | 16 (22) | 2 (15) | |
| Aphakic | 1 (1) | 0 (0) | 0.73 |
| Nuclear opacity (phakic eyes)† | (n = 51) | (n = 12) | |
| Grades 1–2 | 33 (65) | 10 (83) | |
| Grades 3–4 | 18 (35) | 2 (17) | 0.19 |
GA = geographic atrophy; VA = visual acuity.
P values are given for Wilcoxon's rank-sum test for age, and for chi-square for gender, lens status, and nuclear opacity.
Graded by the Taylor-West system15 using a comparison slide at the slit lamp.
Table 2 provides baseline visual function measurements for the GA and drusen eyes. In all measures, the eyes with GA had significantly worse visual function than the drusen eyes (Wilcoxon rank–sum test, P ≤ 0.0002 for all measures). The median VA for the eyes with GA was 20/33, and the median VA for the eyes with drusen was 20/26. Table 2 provides a description of the range of findings for each function. Further consideration is given below to comparing eyes with similar acuity levels.
Table 2.
Baseline Visual Function* [Number (%) of Eyes]
| GA Eyes (n = 74) |
Drusen Eyes (n = 13) |
|
|---|---|---|
| Visual acuity | ||
| 20/14–20/25 (logMAR < 0.1) | 9 (12) | 6 (46) |
| 20/26–20/31 (logMAR 0.10–0.19) | 22 (30) | 5 (38) |
| 20/32–20/39 (logMAR 0.20–0.29) | 25 (34) | 2 (15) |
| 20/40–20/49 (logMAR 0.30–0.39) | 18 (24) | 0 (0) |
| Median visual acuity | 20/33 | 20/26 |
| Number of lines of VA worsening with decreased luminance† | (n = 73) | (n = 13) |
| >1 and ≤3 | 17 (23) | 10 (77) |
| >3 and ≤5 | 26 (36) | 3 (23) |
| >5 and ≤7 | 9 (12) | 0 (0) |
| >7 and ≤9 | 12 (16) | 0 (0) |
| >9 and ≤11 | 8 (11) | 0 (0) |
| Unable to read chart | 1 (1) | 0 (0) |
| Median worsening | 4.6 lines | 2.2 lines |
| Foveal dark-adapted sensitivity (dB) | (n = 60) | (n = 12) |
| >40 | 3 (5) | 4 (33) |
| >30 and ≤40 | 15 (25) | 7 (58) |
| >20 and ≤30 | 23 (38) | 1 (8) |
| >10 and ≤20 | 14 (23) | 0 (0) |
| 0–10 | 2 (3) | 0 (0) |
| Unable to see brightest stimulus | 3 (5) | 0 (0) |
| Median sensitivity | 26 | 38 |
| Number of SLO inner scotoma points out of 12 | (n = 69) | (n = 12) |
| 0 | 10 (14) | 12 (100) |
| 1–3 | 31 (45) | 0 (0) |
| 4–6 | 16 (23) | 0 (0) |
| 7–9 | 8 (12) | 0 (0) |
| 10–12 | 4 (6) | 0 (0) |
| Median number of inner scotoma points | 3 | 0 |
| Number of SLO total scotoma points out of 60 | (n = 69) | (n = 12) |
| 0 | 0 (0) | 11 (92) |
| 1–15 | 23 (33) | 1 (8) |
| 16–30 | 22 (32) | 0 (0) |
| 31–45 | 15 (22) | 0 (0) |
| 46–60 | 7 (10) | 0 (0) |
| Median number of total scotoma points | 21 | 0 |
| Log contrast sensitivity (CS) 1.5 cpd | (n = 69) | (n= 11) |
| >1.50 | 26 (38) | 9 (82) |
| >1.00 and ≤1.50 | 31 (45) | 2 (18) |
| ≤1.00 | 11 (16) | 0 (0) |
| Unable to see highest contrast | 1 (1) | 0 (0) |
| Median log CS, 1.5 cpd | 1.39 | 1.86 |
| Log CS 3.0 cpd | ||
| >1.50 | 30 (43) | 10 (91) |
| > 1.00 and ≤1.50 | 28 (41) | 0 (0) |
| ≤1.00 | 8 (12) | 1 (9) |
| Unable to see highest contrast | 3 (4) | 0 (0) |
| Median log CS, 3.0 cpd | 1.45 | 2.10 |
| Log CS 6.0 cpd | ||
| >1.50 | 28 (41) | 10 (91) |
| > 1.00 and ≤1.50 | 25 (36) | 0 (0) |
| ≤1.00 | 10 (14) | 1 (9) |
| Unable to see highest contrast | 6 (9) | 0 (0) |
| Median log CS, 6.0 cpd | 1.40 | 2.09 |
| Log CS 12.0 cpd | ||
| >1.50 | 5 (7) | 5 (45) |
| > 1.00 and ≤1.50 | 17 (25) | 5 (45) |
| ≤l.00 | 29 (42) | 0 (0) |
| Unable to see highest contrast | 18 (26) | 1 (9) |
| Median log CS, 12.0 cpd | 0.79 | 1.45 |
| Log CS 18.0 cpd | ||
| >1.00 and ≤1.50 | 1 (1) | 5 (38) |
| >0.50 and ≤1.00 | 8 (11) | 5 (38) |
| ≤0.50 | 8 (11) | 0 (0) |
| Unable to see highest contrast | 52 (70) | 1 (8) |
| Median log CS, 18.0 cpd | 0 | 0.67 |
| Maximum reading rate (words per minute) | (n = 69) | (n = 12) |
| 151–175 | 2 (3) | 2 (17) |
| 126–150 | 15 (22) | 5 (42) |
| 101–125 | 17 (25) | 5 (42) |
| 76–100 | 10 (14) | 0 (0) |
| 51–75 | 13 (19) | 0 (0) |
| 26–50 | 9 (13) | 0 (0) |
| 1–25 | 3 (4) | 0 (0) |
| Median maximum reading rate (words per minute) | 100 | 130 |
| Critical character size (degrees) | (n = 69) | (n = 12) |
| ≤0.25 | 3 (4) | 6 (50) |
| >0.25 and ≤0.50 | 31 (45) | 5 (42) |
| >0.50 and ≤0.75 | 21 (30) | 1 (8) |
| >0.75 | 14 (20) | 0 (0) |
| Median critical character size | 0.5.3 | 0.28 |
GA = geographic atrophy; VA = visual acuity; SLO = scanning laser ophthalmoscope macular perimetry; CS = contrast sensitivity; cpd = cycles per degree (spatial frequency).
All visual function measures for the GA group are significantly worse than those for the drusen group, at the P = 0.002 level, by Wilcoxon's rank-sum test. The categories within each visual function measure are ordered from best function to worst function.
Each line is a 0.1 log unit increase in logMAR acuity, with a 3-line worsening being a doubling of the visual angle and a 6-line worsening being a quadrupling of the visual angle.
Visual Acuity Worsening in Decreased Luminance
There was a median drop of 4.6 lines in VA (0.46 increase in logMAR) with decreased luminance in the eyes with GA, which would be equivalent to an eye with 20/33 VA, the median VA in the GA study eyes, dropping to 20/96. By comparison, the median drop in VA in decreased luminance for the eyes with drusen was 2.2 lines (0.22 increase in logMAR), equivalent to a drop from the median VA of 20/26 to 20/44.
For 65 eyes with GA given 5 additional minutes for adaptation to the decreased luminance, a median improvement in VA of only 3 letters (0.06 logMAR) was obtained. Only three eyes improved more than two lines (0.2 logMAR) with the additional adaptation time. One of these patients could read no letters when first exposed to dim illumination (i.e., VA ≤ 20/1000). After the additional 5 minutes of adaptation, she achieved a VA in dim illumination of 20/107, a drop of 3.9 lines from the VA without the filter.
Foveal Dark-adapted Sensitivity
The median foveal dark-adapted sensitivity for the eyes with GA was 12 dB (1.2 log units) lower than that of the eyes with drusen. Eighty-eight percent of the eyes with GA fell below the 25th percentile of the drusen group. Three eyes with GA were unable to see the brightest stimulus (38 dB brighter than the drusen median).
Scanning Laser Ophthalmoscope Macular Perimetry
The eyes with GA varied widely in the number of inner scotoma points, of a maximum of 12 points within 1° of fixation, and in the number of total scotoma points, of a maximum of 60 points within 5°. Figures 2 through 4 show the clinical appearance, along with the SLO scotoma maps, for eyes with different extents of scotoma.
Contrast Sensitivity
For each spatial frequency, the group of eyes with GA had lower contrast sensitivity than did the group of eyes with drusen. The median contrast sensitivity was at least 0.4 log units less for the eyes with GA for all spatial frequencies. More than one quarter of eyes with GA could not detect the 12 cpd stimulus, and three quarters could not detect the highest spatial frequency (18 cpd); only one drusen eye was unable to detect these.
Maximum Reading Rate
None of the eyes with drusen had a maximum reading rate lower than 100 wpm, but 34 eyes with GA (49%) had maximum reading rates lower than 100 wpm. Although we have not controlled for educational level, there is no educational bias inherent in the selection of our patients. The patient with the lowest baseline reading rate, 4 wpm, has a PhD degree.
Critical Character Size
The critical character size is the smallest character size for which the patient can read at 90% of the maximum reading rate. The median critical character size was nearly twice as large for eyes with GA (0.53° or 20/127 letters) as for control eyes (0.28° or 20/67 letters).
Relations among Visual Function Measures
We examined the correlation matrix for the various visual function measures performed at baseline for the eyes with GA. Most of the measures are highly correlated. Those measures having a correlation coefficient (Spearman rho) greater than 0.50 (all with P ≤ 0.01) include VA with contrast sensitivity, maximum reading rate, and critical character size; worsening of acuity in decreased luminance with foveal dark-adapted sensitivity, SLO inner and total scotoma points, and contrast sensitivity; foveal dark-adapted sensitivity with total SLO scotoma points; SLO inner scotoma points with SLO total scotoma points and maximum reading rate; SLO total scotoma points with contrast sensitivity and maximum reading rate; and contrast sensitivity at 1.5 cpd and 3.0 cpd with maximum reading rate. These relations will be analyzed in detail in a separate article.
We looked separately at VA and age and their correlation with the other visual function measures, because they are clinically important variables and because their baseline distributions for the GA group differ from those of the drusen group.
Visual Acuity and Other Visual Function Measures
The eyes with GA were subdivided into four VA subgroups, and each of the remaining visual function measures was analyzed for each subgroup. Results are presented in Table 3. For each of the visual function measures, function declines with each subgroup of poorer VA, and the trends arc statistically significant.
Table 3.
Visual Function Abnormalities by Visual Acuity Groups for Geographic Atrophy Eyes*
| Baseline Visual Acuity | ||||
|---|---|---|---|---|
| Baseline Visual Function Measure | (20/14–20/25) (logMAR < 0.10) |
20/26–20/31 (logMAR 0.10–0.19) |
20/32–20/39 (logMAR 0.20–0.29) |
20/40–20/49 (logMAR 0.30–0.39) |
| Number of lines of VA worsening with decreased luminance | 2.8 | 4.0 | 4.7 | 7.3 |
| Foveal dark-adapted sensitivity (dB) | 31 | 26 | 25 | 21 |
| Number of SLO inner scotoma points | 1 | 2 | 3 | 4.5 |
| Number of SLO total scotoma points | 12 | 18.5 | 20.5 | 31 |
| Log contrast sensitivity | ||||
| 1.5 cpd | 1.73 | 1.53 | 1.38 | 0.96 |
| 3.0 cpd | 2.07 | 1.68 | 1.43 | 0.98 |
| 6.0 cpd | 1.89 | 1.54 | 1.39 | 0.65 |
| 12.0 cpd | 1.32 | 0.99 | 0.71 | 0 |
| 18.0 cpd | 0.68 | 0 | 0 | 0 |
| Maximum reading rate (words per minute) | 132 | 111 | 97 | 64 |
| Critical character size (degrees) | 0.28 | 0.35 | 0.69 | 0.65 |
VA = visual acuity; SLO = scanning laser ophthalmoscope macular perimetry.
The median of each measure for the subgroup is given. Cuzick's test for trend yields P ≤ 0.02 for SLO inner scotoma points and foveal dark-adapted sensitivity, and P ≤ 0.004 for the remaining measures.
None of the eyes with GA with VA of 20/25 or better had more than 4 inner scotoma points or more than 31 total scotoma points. None of these eyes with GA had maximum reading rates lower than 100 wpm. For VA less than 20/25, there was a full range of inner and total scotoma points and a range of maximum reading rates with overlap among the acuity groups.
To assess the extent to which the differences in visual function measures between the eyes with GA and the eyes with drusen may be accounted for by the difference in baseline VA, the groups were compared within VA subgroups. Differences between GA and drusen groups were analyzed for eyes with VA 20/25 or better and separately for eyes with VA between 20/26 and 20/31 (logMAR, 0.10–0.19). Too few eyes with drusen with VA worse than 20/32 were available for comparison.
When the eyes with GA with VA better than 20/25 are compared to the eyes with drusen with comparable acuity, statistically significant differences are present for foveal dark-adapted sensitivity (median, 31 for GA group, 38 for drusen group, P = 0.05 by Wilcoxon rank–sum test) and for critical character size (median, 0.28° for GA group, 0.17 for drusen group, P = 0.01) and approach significance for the worsening of acuity in decreased luminance (median, 2.8 lines for GA group, 2.1 lines for drusen group, P = 0.06). For the other measures, there is a trend for the GA group to have worse function, but the differences were neither statistically nor clinically significant.
For the eyes with VA of 20/26 to 20/31, a statistically significant difference between the GA and drusen groups is present for the worsening of VA in reduced luminance, for foveal dark-adapted sensitivity, and for contrast sensitivity at the highest spatial frequency. The other contrast sensitivity measures are lower for the eyes with GA, but the difference is not statistically significant. Nine of 20 eyes with GA with VA between 20/25 and 20/31 had maximum reading rates of less than 100, whereas none of the eyes with drusen at any acuity had rates lower than 100. Thus, eyes with GA appear to be impaired under dim lighting conditions and for reading over and above the impairment caused by acuity alone.
Age and Visual Function Measure
Visual function was analyzed for the 30 patients with GA who were younger than 75 years of age and compared to the 44 patients with GA who were 75 years of age or older. The visual function was better in the younger group, with a difference between groups that was statistically significant for baseline VA, worsening of VA with decreased luminance, and contrast sensitivity at all spatial frequencies (P ≤ 0.05 for Wilcoxon rank–sum test). Because the younger group had better VA on average, we corrected for VA and found that age remained a statistically significant factor for worsening of VA with decreased luminance and for contrast sensitivity at 1.5, 3.0, and 6.0 cpd (P ≤ 0.02 for age for each of these measures using multiple regression analysis).
To account for differences in the age distributions of the eyes with GA and those with drusen, we compared visual function measures for patients with GA and drusen who were younger than 75 years of age and separately for patients with GA and drusen who were 75 years of age or older. Statistically and clinically significant differences between the eyes with GA and those with drusen for each age subgroup persisted for all measures, with worsening under decreased luminance, foveal dark-adapted sensitivity, and maximum reading rate yielding P values less than or equal to 0.01 (Wilcoxon rank–sum test) and contrast sensitivity at all spatial frequencies and critical character size yielding P values less than or equal to 0.04.
Relation of Visual Function to Maximum Reading Rate
The following visual function measures, in descending order, account for 20% to 32% of the variability in the maximum reading rate in univariate analysis: contrast sensitivity at 3 cpd, number of SLO inner scotoma points, VA, total SLO scotoma points, foveal darkadapted sensitivity, and worsening of VA in decreased luminance. One would anticipate that a measure of foveal function, together with a measure of the scotoma limiting the central seeing area, would be an important factor for predicting reading rate. Using multiple regression, the number of SLO inner scotoma points and the VA accounted for 43% of the variability of maximum reading rate at baseline.
We transformed the SLO scotoma data to look at the length of seeing retina along the horizontal that is continuous with fixation, which might be the most relevant aspect for reading. This SLO measure plus the VA accounted for 54% of the variability in maximum reading rate. Similar findings were obtained when using the contrast sensitivity at 3.0 cpd in place of the VA.
Visual Acuity and Maximum Reading Rate at 2-year Follow-up Visit
Table 4 lists the baseline VAs and the VAs at the 2-year follow-up visit for the 40 GA study eyes and 9 eyes with drusen for which 2-year data are available. The VA and age at baseline of the 40 eyes with GA did not differ significantly from the VA and age of the 34 eyes with GA for which 2-year follow-up data are not yet available (mean baseline VA, 0.22 for group with 2-year follow-up and 0.19 for group with shorter follow-up, t test, P = 0.22; mean age, 76.5 vs. 76.2 years, t test, P = 0.83). For the eyes with GA, VAs at the 2-year follow-up visit ranged from 20/20 (0.04 logMAR) to worse than 20/800 (1.6 logMAR) with median VA of 20/80. Twelve eyes with GA (30%) remained with VA better than 20/50 at the 2-year visit. Four eyes with GA (10%) became legally blind. Figures 2, 3, and 4 show the change from baseline to 2 years for three study eyes with GA. In contrast, the median VA at the 2-year follow-up visit for the eyes with drusen was 20/26, not significantly different from the baseline median VA. All but two eyes remained with VA better than 20/39, and the lowest VA was 20/59.
Table 4.
Visual Acuity at Baseline and at 2-year Follow-up Visit* [Number (%) of Eyes]
| Visual Acuity | GA Eyes (n = 40) | Drusen Eyes (n = 9) | ||
|---|---|---|---|---|
| Baseline | 2 yrs | Baseline | 2 yrs | |
| 20/14–20/25 (logMAR <0.1) | 4 (10) | 3 (7.5) | 3 (33) | 4 (44) |
| 20/26–20/31 (logMAR 0.10–0.19) | 11 (28) | 3 (7.5) | 4 (44) | 1 (11) |
| 20/32–20/39 (logMAR 0.20–0.29) | 14 (35) | 4 (10) | 2 (22) | 2 (22) |
| 20/40–20/49 (logMAR 0.30–0.39) | 11 (28) | 2 (5) | 0 (0) | 0 (0) |
| 20/50–20/78 (logMAR 0.40–0.59) | 0 (0) | 7 (17.5) | 0 (0) | 2 (22) |
| 20/80–20/123 (logMAR 0.60–0.79) | 0 (0) | 11 (27.5) | 0 (0) | 0 (0) |
| 20/126–20/195 (logMAR 0.80–0.99) | 0 (0) | 6 (15) | 0 (0) | 0 (0) |
| ≤20/200 (logMAR ≥ 1.00) | 0 (0) | 4 (10) | 0 (0) | 0 (0) |
| Median visual acuity | 20/35 (0.25 logMAR) | 20/80 (0.60 logMAR) | 20/28 (0.14 logMAR) | 20/26 (0.12 logMAR) |
GA = geographic atrophy.
There is a significant difference between baseline and 2-year acuities for the GA eyes (P = 0.0009), but there is no significant difference between baseline and 2-year acuities for the drusen eyes (P = 0.60) (Wilcoxon's rank-sum test).
Figure 3.
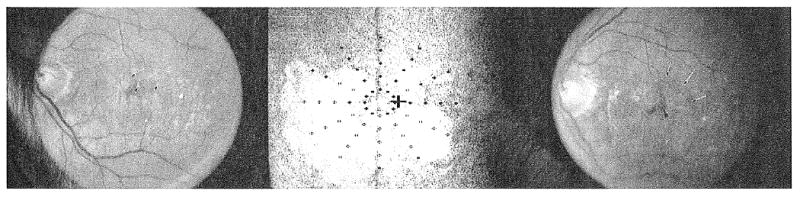
(Left) Fundus photograph of geographic atrophy (GA) at baseline. Visual acuity was 20/36 and maximum reading rate was 114 words per minute. There was GA surrounding the fovea from the 3 o'clock position to the 11 o'clock position. The superotemporal extent of the atrophy is shown by the arrows. (Center) Scanning laser ophthalmoscope map of dense scotoma at the baseline visit. The white cross in the center of the grid is the fixation cross. The patient does not see the black cross. Solid symbols indicate where the stimulus was seen, and open symbols indicate where the stimulus was not seen (dense scotoma). The symbol may be black or white, depending on the background color. There was a dense scotoma corresponding to the atrophy, with seeing retina superotemporal to fixation from the 11 o'clock position to the 3 o'clock position. There was 1 inner scotoma point, and 25 total scotoma points. (Right) Fundus photograph of GA at 2-year visit. Visual acuity was 20/58, 2 lines worse than the baseline visit, and maximum reading rate dropped to 7 words per minute. The GA has spread to involve the retina superotemporal to the fovea (arrows). There is a remaining small central spared region (arrowhead), and there is only a narrow spared vertical band at the 12 o'clock position.
Table 5 lists the change in VA from baseline to the 2-year visit. There was a median worsening in VA of 0.30 logMAR (a three-line drop in VA) for the eyes with GA. Twelve eyes with GA (30%) had a change of less than 2 lines over the follow-up interval. Twenty eyes with GA (50%) had at least a doubling of the visual angle (3-line drop in VA or 0.30 logMAR worsening), and 10 eyes with GA (25% of the whole group) had a quadrupling of the visual angle (6 line or greater loss, ≥0.60 logMAR worsening). In contrast, for the drusen group, there was a median change in logMAR of 0.06 (0.6 line, or three letter, VA drop) over the 2-year follow-up period. Only one eye with drusen (11%) dropped by three lines or more.
Table 5.
Change in Visual Acuity of Study Eye from Initial Visit to 2-year Follow-up Visit* [Number (%) of Eyes]
| Decrease in Visual Acuity (number of lines) |
GA Eyes (n = 40) |
Drusen Eyes (n = 9) |
|---|---|---|
| Stable or improved by ≤ 1.5 lines | 5 (12.5) | 3 (33) |
| <1 | 2 (5.0) | 3 (33) |
| ≥ 1 and <2 | 5 (12.5) | 0 (0) |
| ≥ 2 and <3 | 8 (20.0) | 2 (22) |
| ≥ 3 and <4 | 6 (15.0) | 1 (11) |
| ≥ 4 and <5 | 2 (5.0) | 0 (0) |
| ≥ 5 and <6 | 2 (5.0) | 0 (0) |
| ≥ 6 | 10 (25.0) | 0 (0) |
| Median decrease in visual acuity (number of lines) | 3 | 0.6 |
| Change in logMAR | 0.30 | 0.06 |
GA = geographic atrophy.
P = 0.004 (Wilcoxon's rank-sum test).
For 35 of the 40 eyes with GA, GA was the primary cause for the worsening in VA. The remaining five eyes with 2-year follow-up had CNV develop during the follow-up interval; all five had fellow eyes with CNV at baseline. None of the 21 patients with bilateral GA at baseline had CNV develop by the 2-year visit in either eye nor did the patients with GA with drusen in the fellow eye for whom follow-up data are available. Choroidal neovascularization was responsible for three of the ten eyes with a six-line worsening in VA over the follow-up period and for two of the four eyes with VA of 20/200 or less. One of the eyes with drusen had occult CNV develop during the follow-up period and experienced a 2.1 line worsening in VA; no other eye with drusen had advanced AMD develop.
Changes in nuclear opacity as measured at the slit lamp did not appear to be primarily responsible for the visual doubling outcome. For the 18 eyes with GA with adequate baseline characterization of nuclear opacity, 12 eyes stayed at the same grade and 6 eyes worsened by 1 or 2 grades. Half of each of these groups had doubling of the visual angle.
The relative risks of doubling of the visual angle at 2 years were computed for a number of potential risk factors and are given in Table 6. The following factors had relative risks of 2 or greater for doubling of the visual angle that are statistically significant (95% confidence interval does not include 1): low foveal dark-adapted sensitivity, 3 or more inner scotoma points on SLO testing, and maximum reading rate less than 100 wpm. Eyes that were phakic also had a relative risk of greater than 2 (vs. eyes that were pseudophakic), but the 95% confidence interval included a relative risk of 1.0. Age and gender had risk ratios at or near 1, as did most of the contrast sensitivity measures. Nine (64%) of the 14 patients with CNV fellow eyes doubled the visual angle of the study eye in 2 years: 5 of the eyes with a poor outcome had CNV develop and 4 had progression of GA without evidence of CNV. Forty-three percent of the patients with bilateral GA at baseline had a poor outcome at 2 years.
Table 6.
Risk Factors for Doubling of the Visual Angle at the 2-year Follow-up Visit for Geographic Atrophy Eyes
| Category of Potential Baseline Risk Factors* | Number of Eyes† | % with Poor Outcome | Relative Risk | 95% CI‡ |
|---|---|---|---|---|
| Female | 26 | 50 | 1.00 | 0.52–1.92 |
| Male | 14 | 50 | ||
| Age < 76 yrs | 19 | 53 | 1.11 | 0.60–2.05 |
| Age ≥ 76 yrs | 21 | 48 | ||
| Baseline VA worse than 20/33 | 21 | 57 | 1.36 | 0.73–2.52 |
| Baseline VA 20/33 or better | 19 | 42 | ||
| Phakic | 32 | 56 | 2.25 | 0.66–7.76 |
| Pseudophakic | 8 | 25 | ||
| Baseline nuclear lens grade < 3 | 20 | 60 | 1.60 | 0.70–3.63 |
| Baseline nuclear lens grade ≥ 3 | 8 | 38 | ||
| CNV in fellow eye | 14 | 64 | 1.50 | 0.76–2.95 |
| GA in fellow eye | 21 | 43 | ||
| Drusen in fellow eye | 4 | 50 | 1.17 | 0.40–3.40 |
| GA in fellow eye | 21 | 43 | ||
| VA drop ≥ 5 lines in dim light | 19 | 58 | 1.45 | 0.77–2.71 |
| VA drop < 5 lines in dim light | 20 | 40 | ||
| Foveal dark-adapted sensitivity < 26 dB§ | 20 | 70 | 2.38 | 1.08–5.25 |
| Foveal dark-adapted sensitivity ≥ 26 dB§ | 17 | 29 | ||
| ≥ 3 inner scotoma points in SLO (of 12)§ | 23 | 61 | 2.13 | 1.10–4.14 |
| ≤ 2 inner scotoma points in SLO (of 12)§ | 14 | 29 | ||
| ≥ 21 total scotoma points in SLO (of 60) | 22 | 59 | 1.77 | 0.92–3.42 |
| ≤ 20 total scotoma points in SLO (of 60) | 15 | 33 | ||
| Log contrast sensitivity (1.5 cpd) < 1.4 | 22 | 50 | 1.00 | 0.53–1.90 |
| Log contrast sensitivity (1.5 cpd) ≥ 1.4 | 16 | 50 | ||
| Log contrast sensitivity (3.0 cpd) < 1.4 | 17 | 59 | 1.37 | 0.73–2.59 |
| Log contrast sensitivity (3.0 cpd) ≥ 1.4 | 21 | 43 | ||
| Log contrast sensitivity (6.0 cpd) < 1.4 | 23 | 57 | 1.41 | 0.69–2.89 |
| Log contrast sensitivity (6.0 cpd) ≥ 1.4 | 15 | 40 | ||
| Log contrast sensitivity (12.0 cpd) < 0.8 | 21 | 52 | 1.11 | 0.58–2.13 |
| Log contrast sensitivity (12.0 cpd) ≥ 0.8 | 17 | 47 | ||
| Maximum reading rate < 100 words per minute§ | 16 | 69 | 2.16 | 1.08–4.33 |
| Maximum reading rate ≥ 100 words per minute§ | 22 | 32 |
GA = geographic atrophy; CI = confidence interval; CNV = choroidal neovascularization; VA = visual acuity; SLO = scanning laser ophthalmoscope macular perimetry; cpd = cycles per degree (spatial frequency).
For continuous measures, the categories were subdivided based on the approximate median for the study population.
Number of eyes with visual acuity > 20/50 at baseline with 2-year follow-up measurement.
The 95% confidence limits for the relative risk.
Relative risks greater than 2 that are statistically significant.
To separate out the effect of baseline acuity, we looked at the doubling of visual angle for each VA subgroup of Table 3. None of the four eyes with VA better than 20/25 at baseline underwent a doubling of the visual angle at 2 years. Thus, the 20/25 group has both better baseline visual function in all measures (Table 3) and a better 2-year prognosis. However, these eyes are on a continuum with those of worse VA, in that three of the four eyes had VA worse than 20/25 at the follow-up visit. For each of the remaining VA subgroups with VA worse than 20/25, the rate of visual angle doubling at 2 years was 55% to 57%. Within each VA subgroup, foveal dark-adapted sensitivity gave a relative risk of 2 or greater, reaching statistical significance for the 20/32 to 20/39 and the 20/40 to 20/49 groups. The number of inner scotoma points, maximum reading rate, and phakic status also gave relative risks near 2 for most of the subgroups but were not statistically significant, given the small numbers of patients in each group. Thus, the visual function risk factors confer additional risk over and above the baseline VA.
Four patients with GA and VA better than 20/50 in both eyes were among the patients with 2-year follow-up (with one eye of each patient included in the analysis). In all four cases, both eyes of each patient had the same 2-year outcome, with one patient having a doubling of the visual angle in both eyes and three patients having a doubling of the visual angle in neither eye.
Maximum Reading Rate at 2 Years
We chose visual angle doubling at 2 years as our primary outcome measure. However, just as VA at baseline was not an adequate descriptor of the extent of visual function abnormalities present, so VA at 2 years does not reflect the impact of progressive encroachment of the atrophy on the remaining functional foveal region. For this reason, we looked at maximum reading rate at 2 years as a second outcome measure. Table 7 lists the maximum reading rates at baseline and at 2 years for the GA and drusen groups. For those patients with GA with 2 years of follow-up, median maximum reading rate decreased significantly from 110 wpm at baseline to 51 wpm at 2 years; for the patients with drusen, the median maximum reading rate at baseline was 130 and at 2 years was 117 wpm, which was not a statistically significant difference (Table 7). The median change in maximum reading rate was 34 wpm for the GA group and 6 wpm for the drusen group.
Table 7.
Maximum Reading Rate at Baseline and 2 Years* [Number (%) of Eyes]
| Maximum Reading Rate (words per minute) |
GA Eyes (n = 29) | Drusen Eyes (n = 18) | ||
|---|---|---|---|---|
| Baseline | 2 yrs | Baseline | 2 yrs | |
| 151–175 | 0 (0) | 1 (3) | 1 (12) | 0 (0) |
| 126–150 | 9 (31) | 5 (17) | 4 (50) | 4 (50) |
| 101–125 | 9 (31) | 1 (3) | 3 (38) | 0 (0) |
| 76–100 | 5 (17) | 4 (14) | 0 (0) | 4 (50) |
| 51–75 | 4 (14) | 4 (14) | 0 (0) | 0 (0) |
| 26–50 | 2 (7) | 8 (28) | 0 (0) | 0 (0) |
| 1–25 | 0 (0) | 6 (21) | 0 (0) | 0 (0) |
| Median maximum reading rate (words per minute) | 110 | 51 | 130 | 117 |
GA = geographic atrophy.
There is a significant difference between baseline and 2-year maximum reading rates for the GA eyes (P = 0.0006), but there is no significant difference between baseline and 2-year maximum reading rate for the drusen eyes (P = 0.49) (Wilcoxon's rank-sum test). Only eyes with maximum reading rate measured at both the baseline and 2-year visits are included. Two additional GA eyes had 2-year maximum reading rates of 14 and 33 words per minute, but did not undergo the baseline reading test. With these two eyes, 52% of the GA eyes at 2 years had maximum reading rates below 50 words per minute.
For the GA group, potential risk factors for a maximum reading rate less than 50 wpm that had relative risks of greater than 2 and were statistically significant included worsening of VA in decreased luminance by 5 or more lines, total scotoma points above 20, and low contrast sensitivity at 12.0 cpd.
Overall, 52% of eyes with GA had maximum reading rates less than 50 wpm at 2 years. Thirty-five percent of eyes with GA that did not double in VA had reading rates less than 50 wpm; 82% of eyes with GA that doubled in VA had maximum reading rates less than 50 wpm. For the 12 eyes that still had VA better than 20/50 at 2 years, the median reading rate was 93, and 4 (33%) of these eyes with good VA at 2 years had 2-year maximum reading rates below 50 wpm. Further analysis of 2-year visual function data will be reported after all patients have completed 2 years of follow-up.
Discussion
Visual Function Abnormalities
The data presented illustrate the range of visual function loss observed in eyes with age-related GA of the macula while VA remains better than 20/50. Other than reading rate, the visual function measures presented reflect foveal function (rather than the combined effect of surrounding scotoma) and indicate significant abnormalities before the fovea itself appears atrophic. The eyes with GA with VA better than 20/25 were less severely affected in other visual function measures than those patients with VA of 20/25 or worse and had no more than 4 inner scotoma points and 31 total scotoma points by SLO testing. The data suggest that the extent of atrophy surrounding the fovea may set an upper limit to foveal function. The mechanism for this coupling of the amount of atrophy near the center with foveal function is not understood; it suggests, however, that an intervention that could halt the spread of GA might preserve foveal acuity and function. However, 38 eyes with VAs lower than 20/25 also had 4 or fewer inner scotoma points, suggesting that there is a variable amount of functional change in the fovea itself before its direct involvement by atrophy.
This study found significant changes in dark adaptation in eyes with GA despite good VA. Foveal dark-adapted sensitivity and VA reduction in dim luminance were affected profoundly in many patients. This finding is consistent with previous findings of the significant decrease and prolongation of dark adaptation in eyes with drusen that go on to have GA develop7,18 and corroborates the frequently reported problems regarding vision in dim environments of patients with GA and good VA (Applegate CA, Sunness JS, Haselwood DM, presented as a poster at the Association for Research in Vision and Ophthalmology, Fort Lauderdale, 1996). Improved lighting may be of tremendous help to these patients.19
In addition to the GA study eyes and the drusen comparison group, eight eyes with drusen and good acuity whose fellow eyes had GA were evaluated using these visual function measures and are not included in the results above. For all measures, these fellow eyes of patients with GA fell midway between the GA group and the drusen group, with statistically significant differences between the GA group and the fellow eye group for all functional measures except for foveal darkadapted sensitivity.
Reading
The reading data for patients with GA suggest that both the extent of limitation of the central field, as measured by the SLO scotoma points, and the function of the fovea itself, as reflected by VA, contrast sensitivity, or foveal dark-adapted sensitivity, contribute significantly to the maximum reading rate. The large critical character sizes required for the patients with GA as compared to the patients with drusen may be the reason that most patients with GA and good acuity use magnifiers (Applegate CA, presented as a poster at the Association for Research in Vision and Ophthalmology, Fort Lauderdale, 1996). In this study, eyes with GA needed twice as much magnification on average to achieve peak reading rates as did eyes with drusen. However, magnification often is a “catch-22” for patients with GA and small central seeing islands in that excessive magnification reduces the number of letters that can “fit” into the central seeing island. Low-vision strategies also should emphasize ways of helping patients proceed from one word to the next to counter the effects of the surrounding parafoveal atrophy.
Doubling of the Visual Angle at 2 Years
For the 40 GA study eyes for which follow-up data are available at this time, 50% had a doubling of the visual angle at the 2-year follow-up visit. Baseline risk factors of importance based on this preliminary analysis of eyes with relatively good VA included low foveal dark-adapted sensitivity and the presence of dense scotoma at more than one quarter of the points within 1° of fixation in the SLO. These factors remained important when VA was controlled for. Foveal dark-adapted sensitivity appears to be an important predictor for the loss of VA in the eyes with GA in this study, and it also has been shown to be a good predictor for the likelihood of having advanced AMD develop in eyes with drusen.7,18,20 The presence of dense scotomas near the foveal center is important not only for its impact on maximum reading rate but for the increased risk of more rapid future decline of vision. The maximum reading rate also was a risk factor for a poor visual outcome. The number of eyes with 2-year follow-up data was too small for meaningful multivariate analysis at this time.
Sarks et al3 found that eyes with less than one third of the central 1500 μm involved with GA had median VA of 20/40 or better. For patients with this degree of involvement, there was an average annual increase of 126% in area, but follow-up was not uniform and variation within the population was not described. Schatz and McDonald9 reported that 8% of eyes with VA of 20/50 and better progressed to 20/100 or worse annually, but the follow-up was incomplete, and this estimate of visual loss was made on the basis of the percentage of the population seen at each follow-up visit. Only 1 eye of 18 observed for 4 years (initial acuities unspecified) had VA of 20/40 or better at the 4-year visit. Maguire and Vine10 found in a small retrospective study that the 14 eyes with GA with initial good acuity that were likely to retain this acuity had in general no coarse foveal granularity or thinning of the foveal RPE and had many macular drusen, whereas the 5 eyes that had a relatively rapid loss of VA had in general coarse foveal granularity, thinning of the foveal RPE, increasing encirclement of the fovea by atrophy, and few macular drusen. Future work with longer and larger follow-up will focus on relations between funduscopic appearance and rate of progression of GA.
Lens Changes and Visual Acuity Outcome
Eyes that were phakic had a relative risk of 2.25 for doubling of the visual angle at 2 years relative to the pseudophakic group. However, the confidence interval on this estimate is wide because of the small number of pseudophakic eyes available. This finding suggests that antecedent cataract extraction does not place the patient at risk for a more rapid progression of GA.
Maximum Reading Rate at 2 Years
The reduction in maximum reading rate at 2 years reflects even more functional decrease than acuity alone might suggest. At baseline, 7% of eyes with GA with subsequent 2-year follow-up had maximum reading rates below 50 wpm; at 2 years, 52% of these eyes had maximum reading rates below 50 wpm. Baseline risk factors for low maximum reading rates at 2 years suggest that both intrinsic foveal function and scotoma size play a role in subsequent decreases in reading performance.
Development of Choroidal Neovascularization in Eyes with Geographic Atrophy and Good Acuity
In this study, 5 (36%) of the 14 GA study eyes observed for 2 years whose fellow eyes had CNV had CNV develop in the GA study eye (that had no evidence of CNV by clinical examination and fluorescein angiography at baseline). This represents 25% of all of the 20 eyes with GA with CNV in the fellow eye at baseline included in this analysis. In contrast, none of the patients with bilateral GA had CNV develop over the 2-year follow-up period. Our study confirms the finding of the Macular Photocoagulation Study21 that eyes with GA with CNV in the fellow eye are at high risk for development of CNV. Other previous studies that reported the development of CNV in eyes with GA3,9 did not specify the status of the fellow eye. This study reports the new finding that patients with bilateral GA and no CNV at baseline do not appear to be at high risk for the development of CNV. We are devoting separate study to the development and pattern of CNV in eyes with GA (Sunness JS, Bressler NM, Marsh MJ, et al, abstract submitted for 1997 ARVO meeting).
Measuring Residual Foveal Function
As part of our natural history study of GA, we are measuring the area of GA present each year and are analyzing rates of enlargement of GA for both the total retinal area and for the central retina within a four-disc area circle. Because of the obscuring of the retinal landmarks by the GA process, it often is hard to precisely localize the foveal avascular zone. In addition, the appearance of the foveal region may suggest that there is residual retinal tissue but does not allow for a determination of how much of a small central area spared from atrophy is functional. For these reasons, the SLO has been a valuable tool for studying foveal function and for defining areas with residual function. Future work will involve studying the level of retinal sensitivity present and its change over time and more precisely comparing SLO maps with foveal appearance on fundus photographs. Likewise, fundus photographic features will be studied as risk factors for a more rapid drop in acuity and for a more rapid enlargement of atrophy.
Control and Comparison Groups for Studies of Age-related Macular Degeneration
It is difficult to define an appropriate control group for elderly patients with GA and, more generally, to define normal aging changes as opposed to pathologic changes. In studies of visual function measures in the elderly, there is a widening of the distribution and an increased variance within the population.22 Eyes with better than 20/25 VA and few drusen, for example, may represent a “supernormal” elderly population. Patients with good VA but many drusen may have some change related to early AMD.
In this analysis, we have presented for comparison patients with drusen and without evidence of advanced AMD in either eye who underwent the same testing protocol as did the patients with GA. Many of these patients had large drusen and pigmentary change, which led to their referral for research studies on AMD and GA. Thus, these patients may well have decreased function compared with a supernormal elderly group. Nonetheless, the eyes with drusen had worsening of acuity in decreased luminance that was similar to the mean worsening of 2.3 lines found in a group of 448 elderly subjects in the Salisbury Eye Evaluation study23 with VA of 20/25 or better and normal Pelli–Robson contrast sensitivity in both eyes (G. Rubin, personal communication, 1997).
The drusen comparison group included no eyes with VA worse than 20/40; median age (71.6 years) was lower than that for the GA group (76.4 years). The data illustrate the relative stability in VA during a 2-year period in the eyes with drusen, a finding strikingly different from the clinically significant VA loss in half the eyes with GA. The data also show that for the same VA, eyes with GA have worse function, particularly for dark-adapted measures and maximum reading rate, than eyes with drusen.
Acknowledgments
The work with the scanning laser ophthalmoscope has been supported in part by the Harry and Jeanette Weinberg Foundation, Baltimore, Maryland; the Morris Rodman Philanthropic Foundation, Rockville, Maryland; the Altsheler–Durell Foundation, Louisville, Kentucky; the Grousbeck Family Foundation, Boston, Massachusetts; and the Macula Foundation, New York, New York.
Supported by NE1 grants R0IEY08552 (JS, CA, NB, BH, MM, DH) and R01EY06380 (GR, JS).
The authors thank Mrs. Cathy Epstein for her assistance in preparation of the data for analysis. The authors also thank the following physicians who referred the palients for this study: Drs. James Bookman, Arthur Brandt, Susan Bressler, Peter Campochiaro, J. P. Dunn, David Dyer, Stephen Feinberg, Bruce Fick, Morton F. Goldberg, David Guyton, Eugene de Juan Jr, Richard Hairston, Julia Haller, Debra Keenum, James Kelley, Richard Kolker, Steven Luminais, Oscar Minoso, Irvin Pollack, Lois Ratner, John Ruderman, and Andrew Schachat.
Footnotes
The baseline visual function abnormalities were presented at the 1995 meeting of the Association for Research in Vision and Ophthalmology, Fort Lauderdale, Florida. The natural history aspect of this article is being submitted as an abstract for presentation at the 1997 American Academy of Ophthalmology Meeting, San Francisco, California.
The authors have no proprietary interest in the development or marketing of instruments used in this study or in competing instruments.
References
- 1.Ferris FL, III, Fine SL, Hyman L. Age-related macular degeneration and blindness due to neovascular maculopathy. Arch Ophthalmol. 1984;102:1640–12. doi: 10.1001/archopht.1984.01040031330019. [DOI] [PubMed] [Google Scholar]
- 2.Klein R, Wang Q, Klein BE, et al. The relationship of age-related maculopathy, cataract, and glaucoma to visual acuity. Invest Ophthalmol Vis Sci. 1995;36:182–91. [PubMed] [Google Scholar]
- 3.Sarks JP, Sarks SH, Killingsworth MC. Evolution of geographic atrophy of the retinal pigment epithelium. Eye. 1988;2:552–77. doi: 10.1038/eye.1988.106. [DOI] [PubMed] [Google Scholar]
- 4.Sunness JS, Bressler NM, Maguire MG. Scanning laser ophthalmoscopic analysis of the pattern of visual loss in age-related geographic atrophy of the macula. Am J Ophthalmol. 1995;119:143–51. doi: 10.1016/s0002-9394(14)73866-8. [DOI] [PubMed] [Google Scholar]
- 5.Sunness JS, Johnson MA, Massof RW, Marcus S. Retinal sensitivity over drusen and nondrusen areas. A study using fundus perimetry. Arch Ophthalmol. 1988;106:1081–4. doi: 10.1001/archopht.1988.01060140237032. [DOI] [PubMed] [Google Scholar]
- 6.Sunness JS, Schuchard R, Shen N, et al. Landmark-driven fundus perimetry using the scanning laser ophthalmoscope. Invest Ophthalmol Vis Sci. 1995;36:1863–174. [PMC free article] [PubMed] [Google Scholar]
- 7.Sunness JS, Massof RW, Johnson MA, et al. Diminished foveal sensitivity may predict the development of advanced age-related macular degeneration. Ophthalmology. 1989;96:375–81. doi: 10.1016/s0161-6420(89)32883-1. [DOI] [PubMed] [Google Scholar]
- 8.Brown B, Kitchin JL. Dark adaptation and the acuity/luminance response in senile macular degeneration (SMD) Am J Optom Physiol Optics. 1983;60:645–50. doi: 10.1097/00006324-198308000-00001. [DOI] [PubMed] [Google Scholar]
- 9.Schatz H, McDonald HR. Atrophic macular degeneration: rate of spread of geographic atrophy and visual loss. Ophthalmology. 1989;96:1541–51. doi: 10.1016/s0161-6420(89)32694-7. [DOI] [PubMed] [Google Scholar]
- 10.Maguire P, Vine AP. Geographic atrophy of the retinal pigment epithelium. Am J Ophthalmol. 1986;102:621–5. doi: 10.1016/0002-9394(86)90535-0. [DOI] [PubMed] [Google Scholar]
- 11.Rubin GS. Reliability and sensitivity of clinical contrast sensitivity tests. Clin Vis Sci. 1988;2:169–77. [Google Scholar]
- 12.Legge GE, Ross JA, Luebker A, LaMay JM. Psychophysics of reading. VIII. The Minnesota Low-Vision Reading Test. Optom Vis Sci. 1989;66:843–53. doi: 10.1097/00006324-198912000-00008. [DOI] [PubMed] [Google Scholar]
- 13.Sunness JS, Massof RW, Johnson MA, et al. Peripheral retinal function in age-related macular degeneration. Arch Ophthalmol. 1985;103:811–6. doi: 10.1001/archopht.1985.01050060071029. [DOI] [PubMed] [Google Scholar]
- 14.Taylor HR, West SK. The clinical grading of lens opacities. Aust N Z J Ophthalmol. 1989;17:81–6. [PubMed] [Google Scholar]
- 15.Cuzick J. A Wilcoxon-type test for trend. Stat Med. 1985;4:87–90. doi: 10.1002/sim.4780040112. [DOI] [PubMed] [Google Scholar]
- 16.Altman DG. Practical statistics for medical research. London; New York: Chapman and Hall; 1991. pp. 215–7. [Google Scholar]
- 17.Katz D, Baptista J, Azen SP, Pike MC. Obtaining confidence intervals for the risk ratio in cohort studies. Biometrics. 1978;34:469–74. [Google Scholar]
- 18.Steinmetz RL, Haimovici R, Jubb C, et al. Symptomatic abnormalities of dark adaptation in patients with age-related Bruch's membrane change. Br J Ophthalmol. 1993;77:549– 54. doi: 10.1136/bjo.77.9.549. [DOI] [PMC free article] [PubMed] [Google Scholar]
- 19.Sloan LL. Variation of acuity with luminance in ocular diseases and anomalies. Doc Ophthalmol. 1969;26:384–93. doi: 10.1007/BF00943999. [DOI] [PubMed] [Google Scholar]
- 20.Eisner A, Klein ML, Zilis JD, Watkins MD. Visual function and the subsequent development of exudative age-related macular degeneration. Invest Ophthalmol Vis Sci. 1992;33:3091–102. [PubMed] [Google Scholar]
- 21.Macular Photocoagulation Study Group. Five-year follow-up of fellow eyes of patients with age-related macular degeneration and unilateral extrafoveal choroidal neovascularization. Arch Ophthalmol. 1993;111:1189–99. doi: 10.1001/archopht.1993.01090090041018. [DOI] [PubMed] [Google Scholar]
- 22.Johnson MA, Choy D. On the definition of age-related norms for visual function testing. Appl Opt. 1987;26:1449–54. doi: 10.1364/AO.26.001449. [DOI] [PubMed] [Google Scholar]
- 23.Rubin GS, West SK, Munoz B, et al. A comprehensive assessment of visual impairment in a population of older Americans. Invest Ophthalmol Vis Sci. 1997;38:557–68. [PubMed] [Google Scholar]