Abstract
Pilocytic astrocytomas (PAs) are WHO grade I gliomas; they most often affect children and young adults and occur in patients with neurofibromatosis type 1 (NF-1). To identify genes that are differentially expressed in sporadic (S-PA) versus NF-1-associated PAs (NF1-PAs) and those that might reflect differences in clinical behavior, we performed gene expression profiling using Affymetrix U133 Plus2.0 GeneChip arrays in 36 S-PAs and 11 NF1-PAs. Thirteen genes were over-expressed and another 13 genes were under-expressed in NF1-associated PAs relative to S-PAs. Immunohistochemical studies performed on 103 tumors, representing 2 independently generated tissue microarrays, confirmed the differential expression of CUGBP2 (p = 0.0014), RANBP9 (p = 0.0075), ITGAV1 (p = 0.0001), and INFGR1 (p = 0.024) proteins. One of the underexpressed genes, aldehyde dehydrogenase 1 family, member L1 (ALDH1L1), was also reduced in clinically aggressive compared to typical PAs (p = 0.01) and in PAs with increased cellularity and necrosis. Furthermore, in an additional independent set of tumors, weak to absent ALDH1L1 expression was found in 13/18 (72%) clinically aggressive PAs, in 8/9 (89%) PAs with pilomyxoid features, in 7/10 (70%) PAs with anaplastic transformation and in 16/21 (76%) diffusely infiltrating astrocytomas of various grades. In summary, we have identified a molecular signature that distinguishes NF1-PA from S-PA, and found that ALDH1L1 underexpression is associated with aggressive histology and/or biological behavior.
Keywords: Brain tumor, Glioma, Microarray, Molecular signature, Neurofibromatosis, Pilocytic astrocytoma
INTRODUCTION
Pilocytic astrocytomas (PAs) are WHO grade I tumors that typically affect children and young adults. These glial neoplasms represent the most common primary brain tumor in children, with an incidence of 0.87 per 100,000 individuals under 19 years of age (1). Most PAs arise in the cerebellum (2), but they also develop in the optic pathway, hypothalamic region, cerebral hemispheres, basal ganglia, brainstem, and spinal cord. Microscopically, PAs contain elongate bipolar astrocytes within a biphasic architecture consisting of compact Rosenthal fiber-rich areas, alternating with loose microcystic tissue associated with granular bodies and hyaline droplets (3). PAs often additionally have macrocysts and hyalinized vessels. In contrast to more aggressive glial neoplasms, PAs usually have rare to absent mitotic activity and low proliferative indices (4).
Patients with PAs generally have favorable outcomes, with 5-year overall survival rates of 96% following surgical intervention alone (5); however, a subset may progress and cause significant morbidity or mortality, despite lack of atypical histologic features (6). Conversely, increased proliferation, invasive growth pattern, and/or necrosis do not always predict aggressive behavior (7–9). In this regard, a recently described rare variant of PA, the pilomyxoid astrocytoma, is prone to more aggressive behavior, including cerebrospinal fluid dissemination and increased mortality(10). Therefore, under the current WHO classification pilomyxoid astrocytoma is assigned a grade II (11).
While most PAs arise in individuals without a known family history of astrocytoma, 15% of all PAs develop in individuals with the inherited tumor predisposition syndrome neurofibromatosis type 1 (NF1). In contrast to their sporadic counterparts, NF1-associated PAs typically occur in the optic pathway, and less frequently in the brainstem and other regions. Moreover, the majority of PAs arising in the setting of NF1 exhibit clinical behavior that is generally more favorable than that observed in individuals with sporadic PAs (9, 11, 12). This is particularly true of PAs that involve the optic pathway and which have occasionally been reported to regress spontaneously (12). To gain insight into the molecular differences between NF1-associated (NF1-PA) and sporadic (S-PA) PA, gene expression profiling studies have identified molecular signatures that distinguished these 2 subsets of PA (13, 14). Molecular signatures that separate aggressive from typical PA, however, were not identified in these studies.
Since there are no pathologic features that accurately predict the clinical behavior of PAs, the discovery of molecular signatures that could stratify PAs by their clinical behavior would be of both prognostic and therapeutic importance. Specifically, there is a great need to identify molecular biomarkers that mark clinically aggressive PAs. One previous study suggested an association between PA MIB1 (Ki67) labeling index and decreased progression-free survival (6); however, this was not confirmed in other studies (15, 16). Similarly, investigators have identified myelin basic protein as a potential marker underexpressed in subtotally resected PA that subsequently progress (17, 18). Unfortunately, this finding was also not replicated in other studies(14).
In the present study, we sought to identify genes that might be associated with aggressive PA clinical behavior. We first performed high throughput gene expression profiling to identify molecular signatures that distinguish NF1-PA compared to S-PA. We next used this information to identify and validate aldehyde dehydrogenase 1 family, member L1 (ALDH1L1) as a differentially expressed gene that is underexpressed in more clinically aggressive astrocytoma subtypes.
MATERIALS AND METHODS
Patients and Tumor Samples
Tumors were classified as either “NF1-associated” using previously established clinical criteria (19) or “sporadic” when they occurred in patients without NF1 or other known glioma predisposition syndrome. PAs were termed “clinically-aggressive” if they recurred after gross total resection or displayed significant growth during therapy, irrespective of NF1 status. All studies were approved by the Institutional Review Boards at Mayo Clinic and Washington University.
Four sets of clinical tumor samples were used. First, 41 tumors previously subjected to microarray gene expression analyses, including 5 NF1-PAs, 36 S-PAs and 6 clinically aggressive PAs, were employed (14). Second, frozen samples from 6 NF1-PAs (1 considered clinically aggressive) were used for gene expression microarray analyses and 10 S-PAs (5 clinically aggressive, 5 typical) were used for quantitative real time RT-PCR (qRT-PCR). Third, 2 independently generated tissue microarrays (TMAs) containing samples from 103 patients (F = 56, M = 47, NF1-associated = 15, sporadic = 88) were employed for independent validation by immunohistochemistry. The median age at PA diagnosis in this group was 11 years (range 1–58 years). Tumor locations included optic pathways (13%), supratentorial CNS (26%), infratentorial CNS (59%), and site indeterminate (2%). Finally, a set of mostly sporadic tumors, including clinically aggressive PAs (n = 18), pilomyxoid astrocytomas (n = 9), PAs with anaplastic change (n = 10), diffusely infiltrating astrocytomas grades II–IV (n = 21), and non-neoplastic gliosis controls (n = 3) were used for secondary validation. In addition, 13 heterotopic glioblastoma xenografts grown in mouse flanks were used for conventional and qRT-PCR.
Microarray Analysis of Gene Expression
Tumor tissue was homogenized and total RNA extracted using TRIzol (Invitrogen, Carlsbad, CA) followed by QIAGEN RNeasy kit (QIAGEN, Inc., Valencia CA) purification, according to the manufacturer’s recommendations. RNA quality was assessed using the Agilent 2100 bioanalyzer (Agilent Technologies, Palo Alto, CA). Double-stranded cDNA followed by cRNA synthesis and biotinylation were performed according to the GeneChip Expression Analysis Technical Manual (Affymetrix, Santa Clara, CA), followed by hybridization to Affymetrix HG-U133 Plus2.0 GeneChip arrays and data processing.
Raw CEL files were pre-processed using the GC-RMA algorithm (background subtraction, normalization, and expression summarization) and GeneSpring (Agilent Technologies). Comparisons were performed using the Student t-test, followed by pathway analyses with Ingenuity software (Ingenuity Systems, Redwood City, CA). False discovery rate was calculated as an additional threshold using the Benjamini and Hochberg method. To adjust for differential expression based on NF1-deficiency and tumor location, the genes in the final list were compared to a database of gene expression ratios (murine Nf1−/− astrocytes/wild-type astrocytes and human cortex/cerebellum glia, respectively) as previously described (14). The latter was obtained from Human U133A GeneChip microarray datasets from the GeneAtlas Project at the Genomics Institute of the Novartis Research Foundation.
Real Time RT-PCR
Quantitative analyses of gene expression were performed using TaqMan gene expression assays (Applied Biosystems, Foster City, CA). All probes contain a FAM reporter dye at the 5’ end of the MGB probe and a non-fluorescent quencher at the 3’ end. Predesigned gene expression assays for ALDH1L1, SOX8, and CDGAP (catalog numbers Hs01003850, Hs00232723, and Hs00393361 respectively) were used. Glyceraldehyde-3-phosphate dehydrogenase (GAPDH) served as an internal control. A total of 1 µg of RNA was converted into cDNA, and 50 nanograms were loaded per well. All tumor samples were run in triplicate in an ABI 7900HT Fast Real-Time PCR system (Applied Biosystems) on 96-well plates. PCR reactions without cDNA were used as negative controls.
Data were analyzed using SDS software after converting the fluorescent data into cycle threshold (Ct) measurements. The ΔΔCt calculations were employed to calculate fold changes. Further details about these analytic methods can be found at the Applied Biosystems website (www.appliedbiosystems.com).
Immunohistochemistry
The top differentially expressed genes, based on fold expression, statistical analysis, and availability of suitable antibodies, were confirmed by immunohistochemistry in additional PA sets obtained from the 2 tissue microarrays described above. Immunohistochemical stains were performed using a DAKO Autostainer (Dako North America, Inc., Carpinteria, CA) with the Dual Link Envision+ (Dako) detection system; EDTA or citrate (FOXO3A) were used for antigen retrieval. Diaminobenzidine (DAB) was the chromogen. All commercially available antibodies that worked in formalin-fixed paraffin-embedded tissue, as well as 2 previously tested antibodies (to CUGBP2 and PIM3) in different studies, were obtained. Information about the antibodies used is summarized in Table 1. ALDH1L1 immunohistochemistry was also performed on 5-µm full tissue sections on an additional independent dataset enriched for aggressive histologic subtypes.
Table 1.
Antibodies Used for Immunohistochemical Studies
| Antibody | Source | Clone | Dilution |
|---|---|---|---|
| ALDH1L1 | Novus Biologicals, Littleton, CO | 3E9 | 1:100 |
| CUGBP2 | Dr. Shrikant Anant; Oklahoma City, OK | rabbit polyclonal | 1:200 |
| IFNGR1 | ProteinTech Group, Inc, Chicago, IL | rabbit polyclonal | 1:100 |
| RANBP9 | ProteinTech Group, Inc. | rabbit polyclonal | 1:25 |
| FOXO3A | Lifespan Biosciences, Seattle, WA | rabbit polyclonal | 1:250 |
| PIM-3 | Professor Naofumi Mukaida, Kanazawa University, Japan | rabbit polyclonal | 1:100 |
| ITGAV1 | Abcam, Cambridge, MA | clone 272–17E6 | 1:100 |
| ABI-1 | MBL international corporation, Woburn, MA | clone 1B9 | 1:250 |
| SERPINA5 | ProteinTech Group, Inc. | rabbit polyclonal | 1:100 |
| COX-2 | Dako | clone CX-294 | 1:50 |
| Neurofilament protein | Dako | clone 2F11 | 1:800 |
| Ki67 | Dako | clone MIB-1 | 1:300 |
Immunohistochemistry Scoring
Immunohistochemistry scoring was performed by a single neuropathologist (CG) on TMA sections or two neuropathologists (CG, FJR) on tissue sections in a blinded fashion, using a two-tiered scale (i.e. 0 = negative/minimal, 1 = positive). The median of several measurements from scoreable tissue microarray cores or whole tissue sections was used to obtain a final summary score for statistical analyses. Since the cellular localization of CUGBP2, FOXO3A and RANBP9 is nuclear, in addition to cytoplasmic, this intracellular localization was also noted. Quantitative evaluation of MIB-1 labeling indices was performed using the Hamamatsu NanoZoomer Digital Pathology for scanning images and IHCScore software for computer-assisted analyses (Bacus Laboratories, Inc., Bellingham, WA).
Statistical Methods
Patient and tumor characteristics were described using frequencies, medians, ranges and interquartile ranges as appropriate. Recurrence-free survival was illustrated using Kaplan-Meier survival curves and analyzed with Cox proportional hazard regression. The association between immunohistochemical scores from the TMA sets and several clinicopathologic features, including clinical aggressiveness, histologic atypia, necrosis, cellularity, mitotic activity, and MIB-1 labeling index, was evaluated with logistic or linear regression analyses adjusting by NF1 status and location, (i.e. optic pathway, supratentorial, infratentorial). The associations between immunohistochemical scores and NF1 status were adjusted by location. The Chi square or Fisher exact tests were used to compare proportions, and the Student t or Wilcoxon rank sum tests were used to compare continuous variables between the groups of interest. The Kappa statistic was used to calculate interobserver agreement for the second part of the immunohistochemical analysis. Statistical analyses were performed using SAS version 9 software (SAS Institute, Inc., Cary, NC).
RESULTS
Gene Expression Profiling of NF1-Associated and Sporadic PA
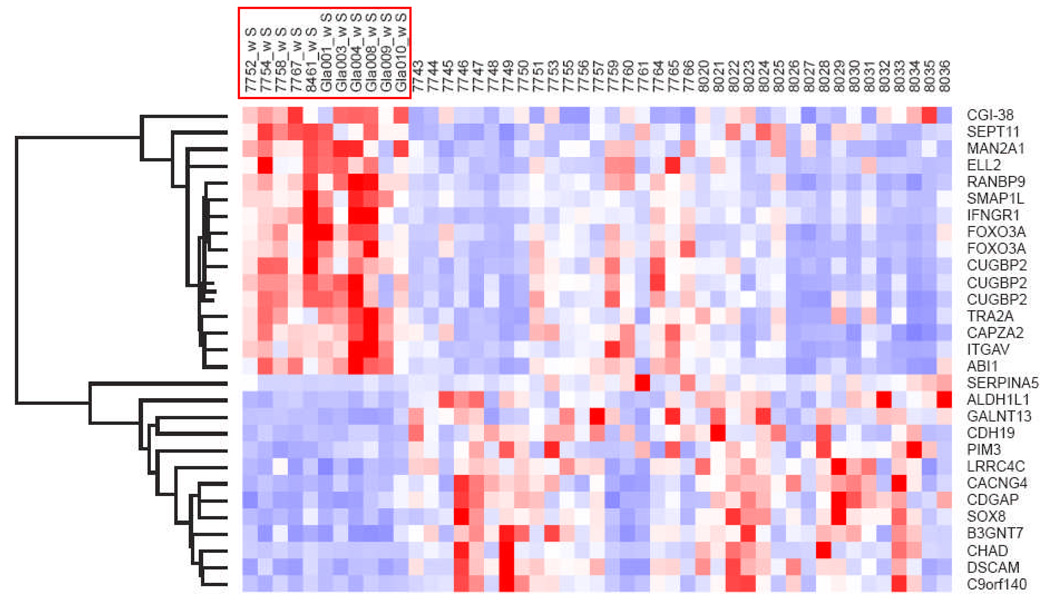
Student t-test identified 7,516 differentially expressed genes between sporadic tumors compared to those from patients with NF1 (p < 0.05). There were 191 transcripts with false discovery rate < 0.05 (Supplementary Table 1). Several genes in this list (e.g. CUGBP and OBFC1) were evaluated and/or validated by qRT-PCR in our previous study of PA (14). Genes with low or absent expression (means in both groups < 200) were excluded and the list was narrowed to a total of 61 genes. After excluding genes differentially expressed in Nf1-deficient primary murine astrocytes and tumor location, 13 genes were found to be overexpressed in NF1-PA and an additional 13 genes were underexpressed in NF1-PA relative to S-PA tumors (Fig. 1). To determine whether these genes were differentially expressed in other NF1-associated neoplasms, the list was compared to our prior dataset of gene expression profiles obtained with a U95Av2 chip of malignant peripheral nerve sheath tumors (MPNSTs)(20). The dataset included 13 (of 26) genes in the PA list that were not differentially expressed between NF1-associated and sporadic MPNSTs (Supplementary Fig. 1). These findings suggest that the NF1-PA gene expression signature is specific to PA and does not reflect NF1-associated tumorigenesis in general.
Figure 1.
NF1-associated pilocytic astrocytoma gene signature. The heat map represents the top candidate genes that were relatively over- or underexpressed in NF1-associated vs. sporadic pilocytic astrocytomas after unsupervised hierarchical clustering (NF1-associated samples are highlighted in the red box).
Validation of NF1-Associated PA Gene Expression Signature
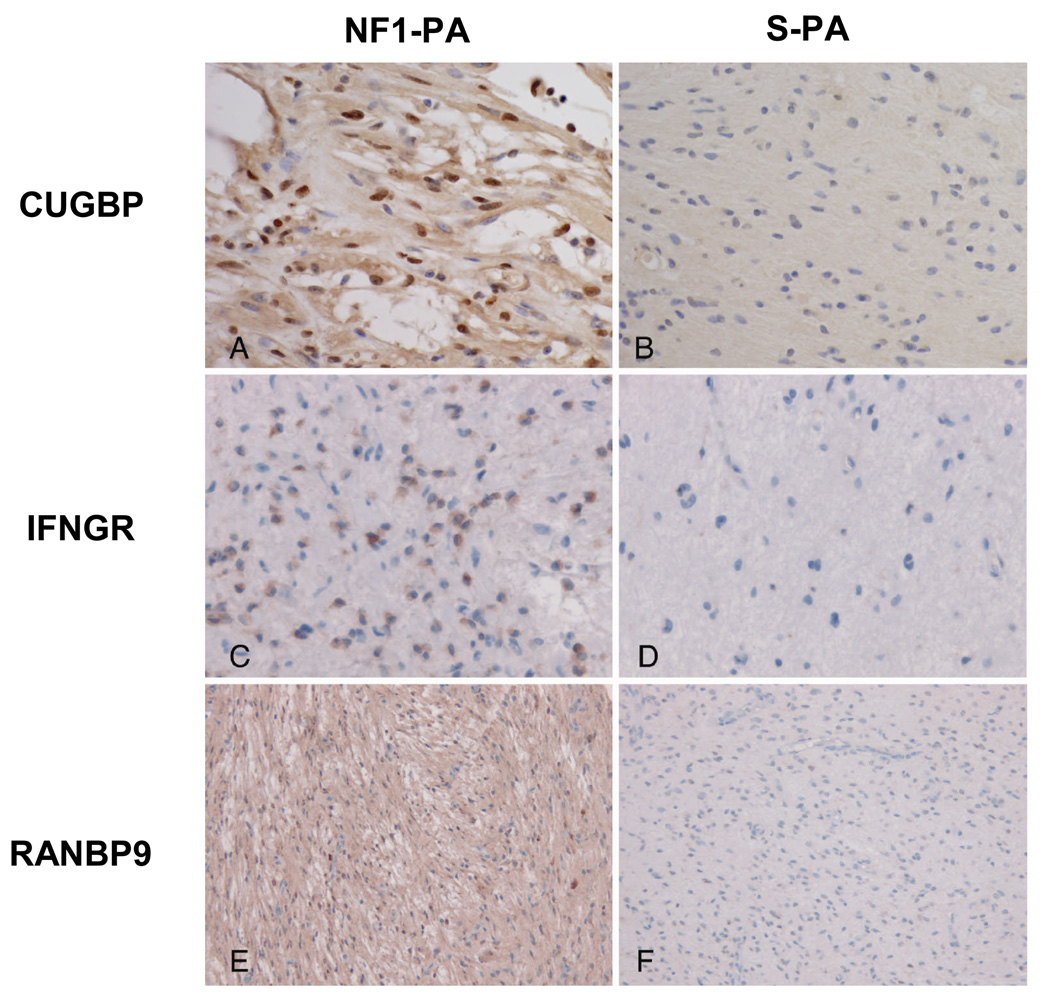
Differentially expressed genes in the final list of 26 genes were validated by immunohistochemistry using two independently generated TMAs (Table 2). Logistic regression analyses adjusting for tumor location confirmed differences in expression between NF1-PA and S-PA for CUGBP2 (p = 0.0014), RANBP9 (p = 0.0075), ITGAV (p = 0.0001), INFGR1 (p = 0.024), and ABI1 (p = 0.0584). Representative images are shown in Figure 2. Because prior studies have shown that CUGBP2 regulates COX2 levels in breast carcinoma (21) we also performed COX2 immunohistochemistry and found no significant associations with NF1 status, clinical behavior, or CUGBP2 expression (p > 0.05)(data not shown). Analyses of the remaining immunohistochemistry results with relevant clinicopathologic parameters revealed an association between infiltration of the underlying parenchyma (as demonstrated by neurofilament protein positive axons) and immunostaining for CUGBP2 (strong nuclear, p = 0.033), IFNGR1 (cytoplasmic, p = 0.032), and FOXO3A (nuclear vs. negative/cytoplasmic, p = 0.016) after adjusting for location and NF1 status with logistic regression methods. SERPINA5 immunoreactivity was also associated with non-optic pathway tumor locations (p = 0.0076).
Table 2.
Immunohistochemical Analysis of NF1-Associated Pilocytic Astrocytoma (PA)-Specific Gene Expression
| Pilocytic astrocytoma | |||
|---|---|---|---|
|
Protein staining pattern |
NF1- Associated1 |
Sporadic1 | p value2 |
|
CUGBP2 strong nuclear |
3/13 (23) | 0/34 (0) | 0.001 |
|
RANBP9 nuclear and cytoplasmic |
8/14 (57) | 19/77(25) | 0.008 |
|
ITGAV cytoplasmic |
10/14 (71) | 13/65 (20) | 0.0001 |
|
INFGR1 cytoplasmic |
10/12 (83) | 28/73 (38) | 0.024 |
|
ABI1 cytoplasmic |
6/15 (40) | 14/71 (20) | 0.058 |
|
FOXO3A nuclear only cytoplasmic only |
3/13 (23) 6/13 (46) |
9/73 (12) 16/73 (22) |
0.180 0.474 |
|
ALDH1L1 cytoplasmic |
5/9 (56) | 34/48 (71) | 0.839 |
|
SERPINA5 cytoplasmic |
4/13 (31) | 32/72 (44) | 0.494 |
|
PIM3 cytoplasmic |
10/12 (83) | 43/57 (75) | 0.581 |
Number of positive cases/number of cases tested (% positive).
Regression analyses was performed after adjusting for tumor location.
Figure 2.
Validation of NF1-associated pilocytic astrocytoma gene expression signature. Representative immunohistochemistry results for CUGBP (A, B), IFNGR (C, D), and RANBP9 (E, F) in TMA PA sections. Positive CUGBP staining is nuclear in A; IFNGR staining is cytoplasmic in C; RANBP9 staining is both nuclear and cytoplasmic in E. Immunostaining is greater for each in NF1-associated PAs (NF1-PA) (A, C, E) compared to sporadic PAs (S-PA)(B, D, F). Magnifications: A–D, 400x; E, F, 200x.
Differential Gene Expression in Aggressive PA
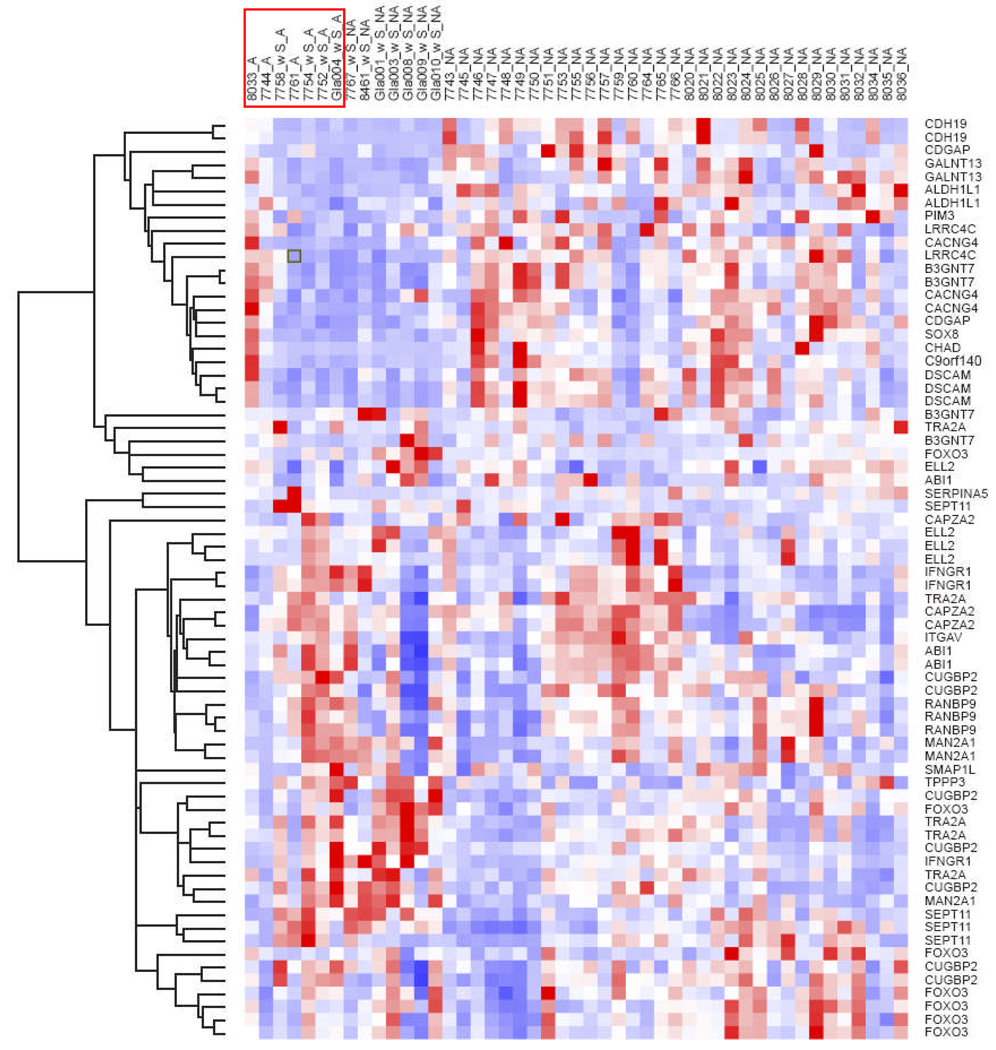
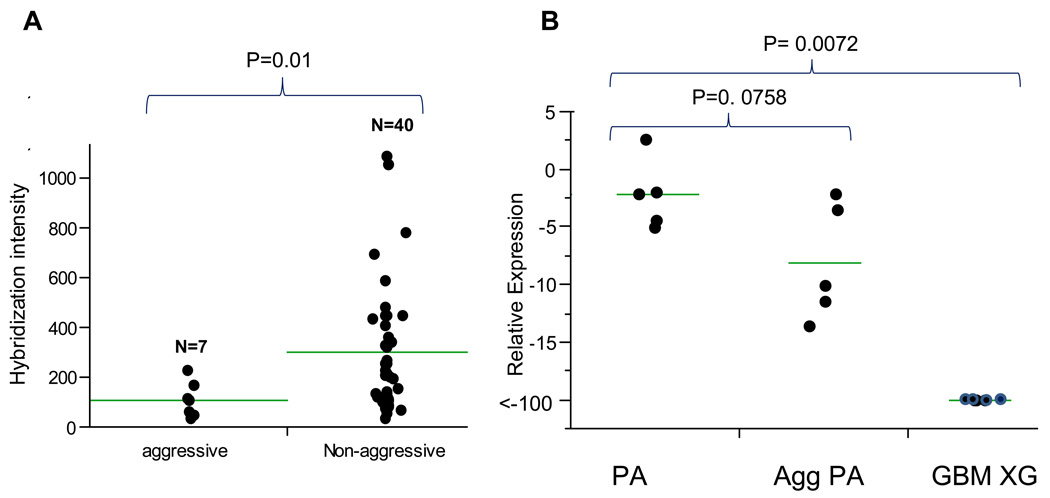
Although hierarchical clustering did not reveal any overall differences in gene expression between clinically aggressive and typical PA for the entire dataset or for the set of genes that were differentially expressed in NF1-PAs versus S-PAs (Fig. 3), ALDH1L1, CDGAP, and SOX8, were significantly determined to be underexpressed in the aggressive subgroup (n = 7) compared to typical PAs (n = 40) (p = 0.019, p = 0.04 and p = 0.038 respectively, Wilcoxon Rank-Sum Test) (Fig. 4a; Table 3).
Figure 3.
Clustering of aggressive vs. typical PA using the list of genes identified in NF1-associated versus sporadic PA demonstrates no overall differences in gene expression between the two groups for most genes with the exception of 3 candidate genes that are relatively underexpressed in aggressive PA, i.e. ALDH1L1 (p = 0.019), SOX 8 (p = 0.038), CDGAP (p = 0.04) (Wilcoxon rank sum test). Aggressive PAs are highlighted in the red box.
Figure 4.
ALDH1L1 RNA expression is decreased in aggressive (Agg PA) compared to typical PAs. Gene expression was measured using data from Affymetrix U133 Plus2.0 GeneChip arrays. (A) There is less hybridization intensity in aggressive PA (probe set 205208_at; p = 0.019). (B) Quantitative real time PCR demonstrated a stepwise decrease of ALDH1L1 expression as measured by fold change in aggressive PAs and heterotopic glioblastoma xenografts (GBM XG). (Wilcoxon rank-sum test) (horizontal bars = mean of each group).
Table 3.
Genes Underexpressed in Aggressive (n = 7) Compared to Non-aggressive (n = 40) PAs
| Probe_set | UniGene ID | Gene Title | Gene Symbol | Fold Change (non-aggressive/aggressive) | p value1 |
|---|---|---|---|---|---|
| 205208_at | Hs.434435 | aldehyde dehydrogenase 1 family, member L1 | ALDH1L1 | 3.35 | 0.019 |
| 226913_s_at | Hs.243678 | SRY (sex determining region Y)-box 8 | SOX8 | 3.18 | 0.038 |
| 226056_at | Hs.477278 | Cdc42 GTPase-activating protein | CDGAP | 1.91 | 0.040 |
Wilcoxon Rank-Sum Test
To confirm these findings, we performed qRT-PCR on an independent set of sporadic PAs (5 aggressive, 5 typical) and 4 heterotopic glioblastoma xenografts. This analysis demonstrated a stepwise decrease in ALDH1L1 relative expression in the three groups (p = 0.0072) (Fig. 4b). In these experiments, ALDH1L1 was underexpressed by 3.7-fold in aggressive PAs samples compared to typical PAs, although this difference did not reach statistical significance (p = 0.0758, Wilcoxon Rank-Sum). In contrast, no differences in gene expression were noted between aggressive and typical PAs for CDGAP (p = 0.46) or SOX8 (p = 0.60) (data not shown).
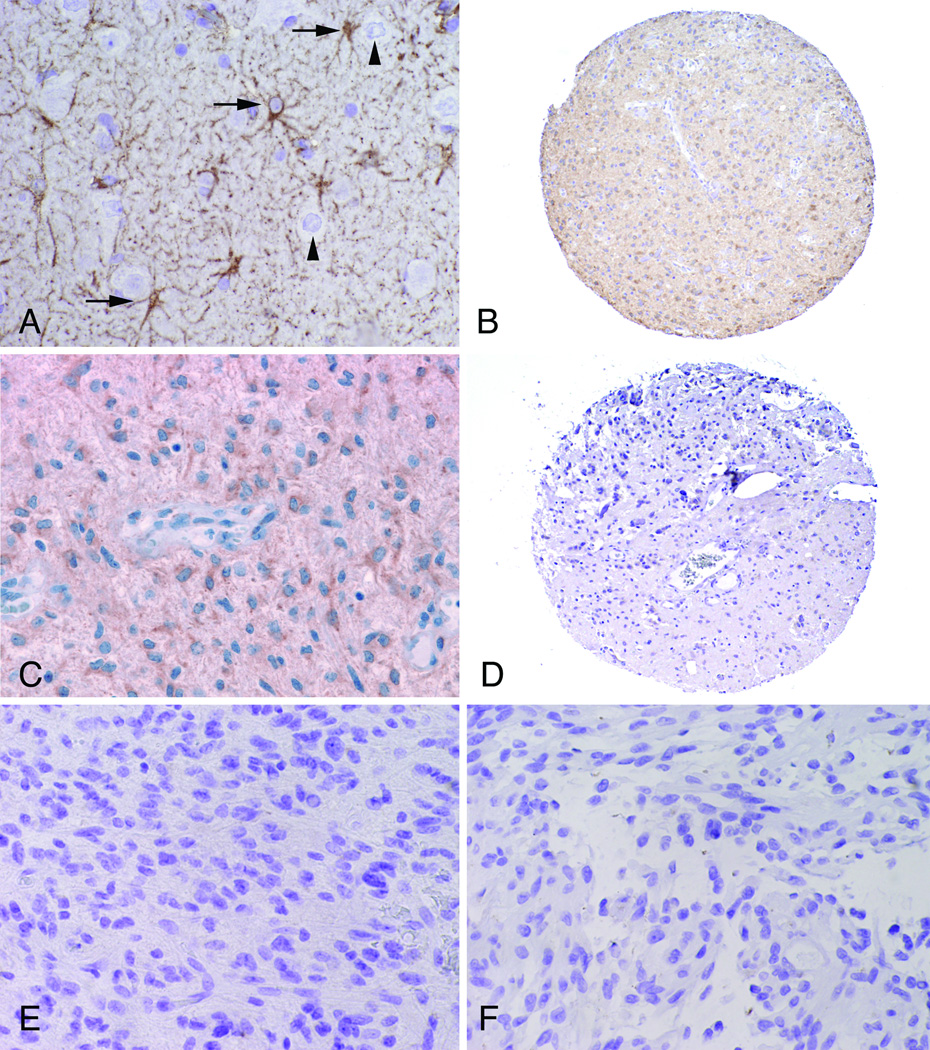
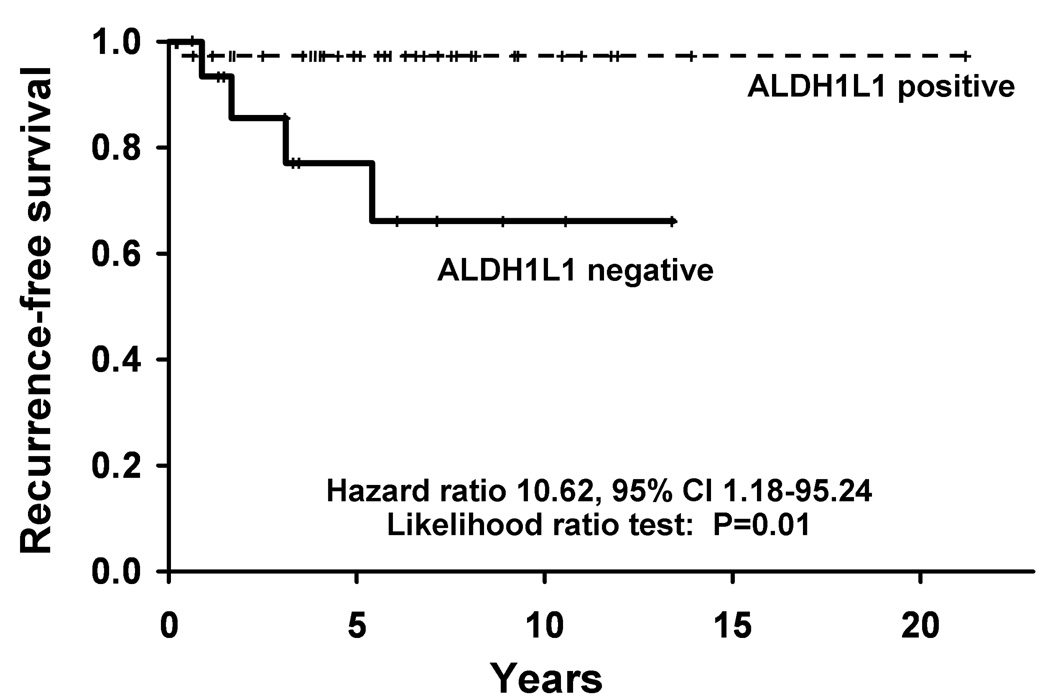
ALDH1L1 expression was next evaluated by immunohistochemistry. Reactive astrocytes in gliosis controls were strongly labeled for ALDH1L1, whereas neurons and vessels were negative (Fig. 5A). ALDH1L1 expression was decreased in aggressive versus typical PAs (5/7 vs. 11/46) (p = 0.0097)(Fig. 5B–F), and in those with increased cellularity (10/21 vs 3/18) (p = 0.049), necrosis (3/4 vs. 15/52) (p = 0.048) and elevated mitotic activity (12/24 vs. 6/30) (p = 0.051), after adjusting for tumor location and NF1 status with regression analyses. There was also a modest correlation between decreased ALDH1L1 staining and high MIB-1 labeling indices, which did not reach statistical significance (p = 0.0816). ALDH1L1 expression was not associated with NF1 status or location (p > 0.05). Kaplan Meier plot and Cox proportional hazards modeling demonstrated decreased recurrence-free survival in ALDH1L1 negative/minimally reactive tumors compared to immunopositive tumors (p = 0.01)(Fig. 6). These findings suggest that decreased ALDH1L1 protein expression is associated with aggressive histologic features and biologic behavior in PAs independent of NF1 status.
Figure 5.
ALDH1L1 protein is relatively underexpressed in aggressive PA. (A) A non-neoplastic seizure control illustrates ALDH1L1 strong expression in the body and cell processes of reactive astrocytes (arrows) but not in neurons (arrowheads). (B, C) Typical PAs with diffuse immunostaining for ALDH1L1. Intratumoral vessels are negative (C, center). (D, E) Clinically aggressive PA are negative for ALDH1L1, especially in cellular areas. (F) An example of the aggressive histologic variant pilomyxoid astrocytoma is also negative. Magnifications: A, C, E, F, 400x; B, D, 40x.
Figure 6.
Patients with ALDH1L1-immunonegative tumors exhibit decreased recurrence-free survival (p = 0.01).
ALDH1L1 Expression in Aggressive Astrocytoma Subtypes
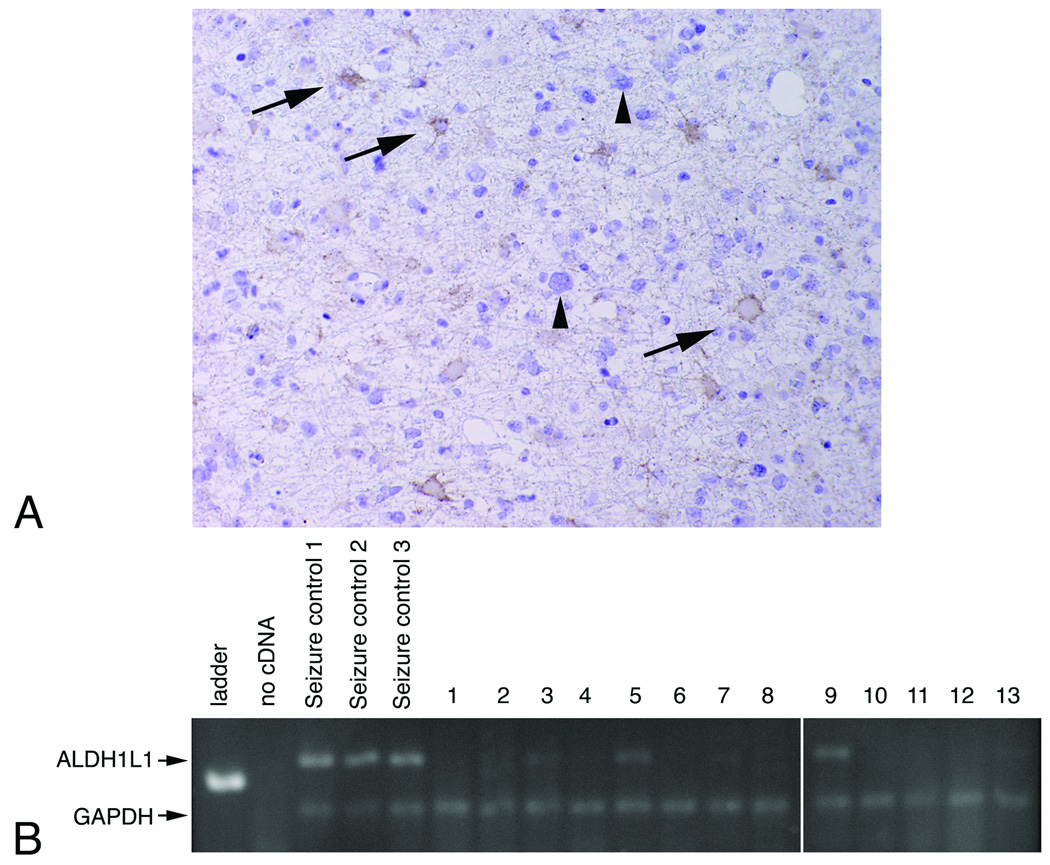
ALDH1L1 immunoexpression was also decreased in an additional independent tumor set enriched for clinically and histologically aggressive glial cell tumors, including rare PA variants (pilomyxoid astrocytoma and PA with anaplastic transformation) and diffusely infiltrating astrocytomas of grades II–IV (Fig. 5, Fig. 7a; Table 4). These tumors were scored by 2 independent observers. The concordance rate between the 2 observers was 0.73 and the kappa statistic 0. 47, which is consistent with moderate agreement. Most disagreements were secondary to difficulties in separating focal partial positivity from negative staining. The pattern of staining was heterogeneous. In particular, ALDH1L1 was under-expressed in cellular, more poorly differentiated areas of anaplastic and recurrent astrocytomas (Fig. 5). To extend these observations, conventional RT-PCR was performed on a set of heterotopic glioblastoma xenografts using primers that recognize human ALDH1L1 mRNA. Because ALDH1L1 is strongly expressed in reactive astrocytes (Fig. 5a), we assessed mRNA expression in heterotopic glioblastoma xenografts as a pure human tumor cell population, and gliotic human brain samples that were rich in reactive astrocytes, as controls. ALDH1L1 was under-expressed in 11 of 13 (87%) glioblastoma xenograft samples compared to 1/9 (13%) gliosis control specimens (p = 0.0005, Fisher exact test) (Fig. 7b). Human ALDH1L1 was confirmed by sequencing of the PCR product in 3 of the positive cases (2 controls, 1 xenograft; data not shown). Collectively, these results implicate reduced ALDH1L1 expression in clinically- and histologically aggressive glial cell tumors.
Figure 7.
ALDH1L1 expression is decreased in infiltrating astrocytomas. (A) ALDH1L1 immunoreactivity was not detected in cytologically atypical neoplastic astrocytes (arrowheads) but was found in entrapped reactive astrocytes (arrows) (Magnification: 400x). (B) Representative RT-PCR gel demonstrates decreased to absent ALDH1L1 expression in glioblastoma heterotopic xenografts (lanes 1–13) compared to non-neoplastic gliosis (seizure control lanes 1–3) brain samples. ALDH1L1 and GAPDH 117 and 73 base pair products are demonstrated. All samples are from the same gel run and exposure.
Table 4.
ALDH1L1 Expression Correlates with Glial Tumor Clinical Behavior
| Tumor | Total number of tumors1 | Positive2 |
|---|---|---|
| Pilocytic astrocytoma | ||
| Typical3 | 46 | 36 (78) |
| Aggressive/recurrent4 | 24 | 6 (25) |
| With pilomyxoid features | 9 | 1 (11) |
| With anaplastic transformation | 10 | 3 (30) |
| Infiltrating astrocytoma | 21 | 5 (24) |
| Seizure brain controls | 3 | 3 (100) |
Number of cases tested.
Number of positive cases (% positive).
Staining performed on TMA sections.
Staining performed on both TMA (n = 6) and full sections (n = 18).
DISCUSSION
Although our knowledge of the biology of diffusely infiltrating gliomas has increased significantly over the past decade, this is not the case for PAs. Molecular studies of PAs have traditionally proven difficult, in part because gross genetic abnormalities are usually absent. Conventional cytogenetic studies have usually demonstrated a normal diploid karyotype with chromosomal gains (typically involving chromosomes 7 and 8) occurring in approximately one third of the cases (22). For this reason, recent studies have highlighted the need to use higher resolution platforms to identify genomic aberrations in these tumors (23, 24). Using these microarray analyses, two genes have been identified on chromosome 7 (23, 25, 26): homeodomain interacting protein kinase 2 (HIPK2) and v-raf murine sarcoma viral oncogene homolog B1 (BRAF), and another on chromosome 8 ( 27), Matrilin 2 (MATN2), which may play important roles in low-grade glioma pathogenesis and clinical behavior. In this regard, HIPK2 and BRAF overexpression can promote cell growth (23, 28), while MATN2 overexpression was observed in sporadic PAs with clinically aggressive behavior (27).
PA tumors can develop sporadically or in the context of the NF1 inherited tumor predisposition syndrome. Previous studies by our group and others have identified molecular genetic differences between NF1-PAs and S-PAs that may be relevant to the clinical behavior of these tumors. For example, loss of heterozygosity at the NF1 locus is almost universal in NF1-PA but is not observed in S-PA(29). In this regard, NF1-PAs are characterized by loss of NF1 gene expression, whereas other genetic events that increase cell growth must underlie the genesis of S-PAs. We previously showed that Nf1 inactivation in murine astrocytes results in the selective hyperactivation of KRAS (30). Based on this observation, we sequenced sporadic PAs for activating mutations in KRAS and identified one such mutation in an S-PA (31). A subsequent study also identified a KRAS mutation in a S-PA(32) but KRAS mutation is a rare event in S-PAs, suggesting that other genetic events are important for the pathogenesis and continued growth of these common brain tumors.
Previous studies using high throughput gene expression profiling have identified gene expression patterns unique to NF1-PAs that distinguish these tumors from their sporadic counterparts (13, 14). Here, we have extended gene expression profiling using a larger set of NF1-PAs than previous studies (n = 11) to identify clinically relevant markers in PAs, and made several observations. First, while prior studies have only identified overexpressed genes in NF1-PAs compared to S-PAs, we identified several differentially expressed genes that were either overexpressed or underexpressed in NF1-PA compared to S-PA. Second, we validated the NF1-PA molecular signature at the protein level using a large number of clinically annotated samples. Third, we identified ALDH1L1 as an underexpressed transcript in aggressive PAs, independent of NF1 status.
We validated the differential expression of CUGBP2, RANBP9, INFGR1 and ITGAV in NF1-PA compared to S-PA. These transcripts may be biologically relevant since CUGBP2 binds to the 3’ untranslated region of certain mRNAs, including COX2, and may affect their stability. This interaction has been previously explored in breast (21) and colon cancer (33). In the present study, we did not identify a relationship between CUGBP2 and COX2 expression, raising the possibility that CUGBP2 may have an alternative mechanism of action in PAs. ITGAV encodes the integrin alphav chain, which can mediate interactions with the extracellular matrix and facilitate signal transduction. ITGAV expression has prognostic importance in ovarian carcinoma (34), melanoma (35) and head and neck cancer (36). For example, the identification of polymorphisms in microRNA-binding sites for integrin genes have suggested that certain integrin alleles predict worse survival in patients with breast cancer (37) and susceptibility to hepatocellular carcinoma (38). RANBP9 belongs to the RAS superfamily, and is a GTP binding protein that interacts with the proto-oncogene MET (39) as well as HIPK2 (40). This association is intriguing, based on our recent finding that HIPK2 expression is increased in PA (23). It is also worth noting that RANBP9, through its interaction with MET, modulates Ras/Erk signaling, a pathway regulated by the NF1 protein, neurofibromin (39). Further studies of these proteins, including pathway analyses and functional characterization, will be necessary to define their specific roles in the pathogenesis of NF1-PA.
The identification of biomarkers that identify clinically aggressive PA has proven to be challenging. Although we did not find a gene expression signature that separates aggressive and typical PA subtypes, we identified ALDH1L1, FTHFD as an underexpressed gene in aggressive subtypes. ALDH1L1 is an enzyme involved in folate metabolism that catalyzes the conversion of 10-formyltetrahydrofolate (10-FTHF) to tetrahydrofolate, and may play a regulatory role in cell proliferation (41). A recent study has demonstrated this enzyme to be developmentally-regulated in the neural tube (42), where its expression correlates with decreased cellular proliferation. In a recent gene expression profile study of carefully isolated CNS cell types, Cahoy and colleagues identified ALDH1L1 as a specific astrocyte marker, more widely expressed in the brain than GFAP (43). Collectively, these findings suggest that ALDH1L1 is important in both brain development and astrocyte biology.
While the precise role of ALDH1L1 in the CNS is not known, ALDH1L1 has been reported to be underexpressed in cancer and to stimulate apoptosis when it is overexpressed in vitro (44). We confirmed ALDH1L1 under-expression at the mRNA and protein levels and suggest that this under-expression may be associated with more aggressive astrocytoma clinical behavior. It is worth noting that one property of ALDH1L1 involves depletion of 10-FTHF, which is required for de novo purine biosynthesis (44). Since antifolate compounds that inhibit enzymes involved in these reactions show antitumor effects (45, 46), it is possible that these compounds may have particular utility in targeting ALDH1L1-deficient astrocytomas. Detailed functional studies of ALDH1L1 in experimental glioma model systems will be required to define the role of this gene in astrocytoma clinical behavior.
In summary, we performed a detailed analysis of gene expression of NF1-PAs and S-PAs and validated the differential expression of several of the genes that form a specific molecular NF1-associated PA molecular signature. In addition, we identified ALDH1L1 as an underexpressed biomarker of tumor aggressiveness in astrocytic tumors. Additional retrospective and prospective studies examining this potential biomarker are necessary to demonstrate its ultimate clinical utility.
Supplementary Material
ACKNOWLEDGMENTS
This work was supported in part by NIH training grant T32 NS07494-04 (FJR), grant 31170 from the Department of Laboratory Medicine and Pathology, Mayo Clinic (FJR, CG), Schnuck Markets, Inc. (DHG), and Mayo SPORE in Brain Cancer, P50 CA108961 (CG, RBJ, JNS).
The authors thank the Microarray, Tissue and Cell Molecular Analysis Shared Resources of the Mayo Clinic for excellent technical assistance as well as Professor Naofumi Mukaida at Kanazawa University, Japan, for kindly sharing PIM-3 antibody for immunohistochemical studies. We also appreciate the technical assistance of Mr. Ryan Emnett and data analysis by Ms. Jane Kahl.
REFERENCES
- CBTRUS. Primary Brain Tumors in the United States, 2000–2004. Hinsdale, IL: Central Brain Tumor Registry of the United States; 2008. [Google Scholar]
- 2.Burkhard C, Di Patre PL, Schuler D, et al. A population-based study of the incidence and survival rates in patients with pilocytic astrocytoma. J Neurosurg. 2003;98:1170–1174. doi: 10.3171/jns.2003.98.6.1170. [DOI] [PubMed] [Google Scholar]
- 3.Scheithauer B, Hawkins C, Tihan T, et al. Pilocytic Astrocytoma. In: Louis DN, Ohgaki H, Wiestler O, Cavenee W, editors. WHO Classification of Tumours of the Central Nervous System. 4th ed. Lyon: International Agency for Research on Cancer; 2007. pp. 14–21. [Google Scholar]
- 4.Giannini C, Scheithauer BW, Burger PC, et al. Cellular proliferation in pilocytic and diffuse astrocytomas. J Neuropathol Exp Neurol. 1999;58:46–53. doi: 10.1097/00005072-199901000-00006. [DOI] [PubMed] [Google Scholar]
- 5.Ohgaki H, Kleihues P. Population-based studies on incidence, survival rates, and genetic alterations in astrocytic and oligodendroglial gliomas. J Neuropathol Exp Neurol. 2005;64:479–489. doi: 10.1093/jnen/64.6.479. [DOI] [PubMed] [Google Scholar]
- 6.Bowers DC, Gargan L, Kapur P, et al. Study of the MIB-1 labeling index as a predictor of tumor progression in pilocytic astrocytomas in children and adolescents. J Clin Oncol. 2003;21:2968–2973. doi: 10.1200/JCO.2003.01.017. [DOI] [PubMed] [Google Scholar]
- 7.Forsyth PA, Shaw EG, Scheithauer BW, et al. Supratentorial pilocytic astrocytomas. A clinicopathologic, prognostic, and flow cytometric study of 51 patients. Cancer. 1993;72:1335–1342. doi: 10.1002/1097-0142(19930815)72:4<1335::aid-cncr2820720431>3.0.co;2-e. [DOI] [PubMed] [Google Scholar]
- 8.Machen SK, Prayson RA. Cyclin D1 and MIB-1 immunohistochemistry in pilocytic astrocytomas: a study of 48 cases. Hum Pathol. 1998;29:1511–1516. doi: 10.1016/s0046-8177(98)90023-5. [DOI] [PubMed] [Google Scholar]
- 9.Rodriguez FJ, Perry A, Gutmann DH, et al. Gliomas in neurofibromatosis type 1: A clinicopathologic study of 100 patients. J Neuropathol Exp Neurol. 2008;67:240–249. doi: 10.1097/NEN.0b013e318165eb75. [DOI] [PMC free article] [PubMed] [Google Scholar]
- 10.Tihan T, Fisher PG, Kepner JL, et al. Pediatric astrocytomas with monomorphous pilomyxoid features and a less favorable outcome. J Neuropathol Exp Neurol. 1999;58:1061–1068. doi: 10.1097/00005072-199910000-00004. [DOI] [PubMed] [Google Scholar]
- 11.Louis D, Ohgaki H, Wiestler O, et al. WHO Classification of Tumours of the Central Nervous System. 4th ed. Lyon, France: IARC press; 2007. [DOI] [PMC free article] [PubMed] [Google Scholar]
- 12.Parsa CF, Hoyt CS, Lesser RL, et al. Spontaneous regression of optic gliomas: thirteen cases documented by serial neuroimaging. Arch Ophthalmol. 2001;119:516–529. doi: 10.1001/archopht.119.4.516. [DOI] [PubMed] [Google Scholar]
- 13.Gutmann DH, Hedrick NM, Li J, et al. Comparative gene expression profile analysis of neurofibromatosis 1-associated and sporadic pilocytic astrocytomas. Cancer Res. 2002;62:2085–2091. [PubMed] [Google Scholar]
- 14.Sharma MK, Mansur DB, Reifenberger G, et al. Distinct genetic signatures among pilocytic astrocytomas relate to their brain region origin. Cancer Res. 2007;67:890–900. doi: 10.1158/0008-5472.CAN-06-0973. [DOI] [PubMed] [Google Scholar]
- 15.Fisher BJ, Naumova E, Leighton CC, et al. Ki-67: A prognostic factor for low-grade glioma? Int J Radiat Oncol Biol Phys. 2002;52(4):996–1001. doi: 10.1016/s0360-3016(01)02720-1. [DOI] [PubMed] [Google Scholar]
- 16.Dirven CM, Koudstaal J, Mooij JJ, et al. The proliferative potential of the pilocytic astrocytoma: the relation between MIB-1 labeling and clinical and neuro-radiological follow-up. J Neurooncol. 1998;37:9–16. doi: 10.1023/a:1005905009449. [DOI] [PubMed] [Google Scholar]
- 17.Wong KK, Chang YM, Tsang YT, et al. Expression analysis of juvenile pilocytic astrocytomas by oligonucleotide microarray reveals two potential subgroups. Cancer Res. 2005;65:76–84. [PubMed] [Google Scholar]
- 18.Takei H, Yogeswaren ST, Wong KK, et al. Expression of oligodendroglial differentiation markers in pilocytic astrocytomas identifies two clinical subsets and shows a significant correlation with proliferation index and progression free survival. J Neurooncol. 2008;86:183–190. doi: 10.1007/s11060-007-9455-7. [DOI] [PubMed] [Google Scholar]
- 19.Gutmann DH, Aylsworth A, Carey JC, et al. The diagnostic evaluation and multidisciplinary management of neurofibromatosis 1 and neurofibromatosis 2. JAMA. 1997;278:51–57. [PubMed] [Google Scholar]
- 20.Watson MA, Perry A, Tihan T, et al. Gene expression profiling reveals unique molecular subtypes of Neurofibromatosis Type I-associated and sporadic malignant peripheral nerve sheath tumors. Brain Pathol. 2004;14:297–303. doi: 10.1111/j.1750-3639.2004.tb00067.x. [DOI] [PMC free article] [PubMed] [Google Scholar]
- 21.Mukhopadhyay D, Jung J, Murmu N, et al. CUGBP2 plays a critical role in apoptosis of breast cancer cells in response to genotoxic injury. Ann N Y Acad Sci. 2003;1010:504–509. doi: 10.1196/annals.1299.093. [DOI] [PubMed] [Google Scholar]
- 22.White FV, Anthony DC, Yunis EJ, et al. Nonrandom chromosomal gains in pilocytic astrocytomas of childhood. Hum Pathol. 1995;26:979–986. doi: 10.1016/0046-8177(95)90087-x. [DOI] [PubMed] [Google Scholar]
- 23.Deshmukh H, Yeh TH, Yu J, et al. High-resolution, dual-platform aCGH analysis reveals frequent HIPK2 amplification and increased expression in pilocytic astrocytomas. Oncogene. 2008;27:4745–4751. doi: 10.1038/onc.2008.110. [DOI] [PubMed] [Google Scholar]
- 24.Jones DT, Ichimura K, Liu L, et al. Genomic analysis of pilocytic astrocytomas at 0.97 Mb resolution shows an increasing tendency toward chromosomal copy number change with age. J Neuropathol Exp Neurol. 2006;65:1049–1058. doi: 10.1097/01.jnen.0000240465.33628.87. [DOI] [PMC free article] [PubMed] [Google Scholar]
- 25.Pfister S, Janzarik WG, Remke M, et al. BRAF gene duplication constitutes a mechanism of MAPK pathway activation in low-grade astrocytomas. J Clin Invest. 2008;118:1739–1749. doi: 10.1172/JCI33656. [DOI] [PMC free article] [PubMed] [Google Scholar]
- 26.Bar EE, Lin A, Tihan T, et al. Frequent Gains at Chromosome 7q34 Involving BRAF in Pilocytic Astrocytoma. J Neuropathol Exp Neurol. 2008;67:878–887. doi: 10.1097/NEN.0b013e3181845622. [DOI] [PubMed] [Google Scholar]
- 27.Sharma MK, Watson MA, Lyman M, et al. Matrilin-2 expression distinguishes clinically relevant subsets of pilocytic astrocytoma. Neurology. 2006;66:127–130. doi: 10.1212/01.wnl.0000188667.66646.1c. [DOI] [PubMed] [Google Scholar]
- 28.Tanami H, Imoto I, Hirasawa A, et al. Involvement of overexpressed wild-type BRAF in the growth of malignant melanoma cell lines. Oncogene. 2004;23:8796–8804. doi: 10.1038/sj.onc.1208152. [DOI] [PubMed] [Google Scholar]
- 29.Kluwe L, Hagel C, Tatagiba M, et al. Loss of NF1 alleles distinguish sporadic from NF1-associated pilocytic astrocytomas. J Neuropathol Exp Neurol. 2001;60:917–920. doi: 10.1093/jnen/60.9.917. [DOI] [PubMed] [Google Scholar]
- 30.Dasgupta B, Li W, Perry A, et al. Glioma formation in neurofibromatosis 1 reflects preferential activation of K-RAS in astrocytes. Cancer Res. 2005;65:236–245. [PubMed] [Google Scholar]
- 31.Sharma MK, Zehnbauer BA, Watson MA, et al. RAS pathway activation and an oncogenic RAS mutation in sporadic pilocytic astrocytoma. Neurology. 2005;65:1335–1336. doi: 10.1212/01.wnl.0000180409.78098.d7. [DOI] [PubMed] [Google Scholar]
- 32.Janzarik WG, Kratz CP, Loges NT, et al. Further evidence for a somatic KRAS mutation in a pilocytic astrocytoma. Neuropediatrics. 2007;38:61–63. doi: 10.1055/s-2007-984451. [DOI] [PubMed] [Google Scholar]
- 33.Natarajan G, Ramalingam S, Ramachandran I, et al. CUGBP2 downregulation by prostaglandin E2 protects colon cancer cells from radiation-induced mitotic catastrophe. Am J Physiol Gastrointest Liver Physiol. 2008;294:G1235–G1244. doi: 10.1152/ajpgi.00037.2008. [DOI] [PubMed] [Google Scholar]
- 34.Goldberg I, Davidson B, Reich R, et al. Alphav integrin expression is a novel marker of poor prognosis in advanced-stage ovarian carcinoma. Clin Cancer Res. 2001;7:4073–4079. [PubMed] [Google Scholar]
- 35.Nikkola J, Vihinen P, Vlaykova T, et al. Integrin chains beta1 and alphav as prognostic factors in human metastatic melanoma. Melanoma Res. 2004;14:29–37. doi: 10.1097/00008390-200402000-00005. [DOI] [PubMed] [Google Scholar]
- 36.Lu JG, Sun YN, Wang C, et al. Role of the alphav-integrin subunit in cell proliferation, apoptosis and tumor metastasis of laryngeal and hypopharyngeal squamous cell carcinomas: a clinical and in vitro investigation. Eur Arch Otorhinolaryngol. 2008 doi: 10.1007/s00405-008-0675-z. [DOI] [PubMed] [Google Scholar]
- 37.Brendle A, Lei H, Brandt A, et al. Polymorphisms in predicted microRNA-binding sites in integrin genes and breast cancer: ITGB4 as prognostic marker. Carcinogenesis. 2008;29:1394–1399. doi: 10.1093/carcin/bgn126. [DOI] [PubMed] [Google Scholar]
- 38.Lee SK, Kim MH, Cheong JY, et al. Integrin alpha V polymorphisms and haplotypes in a Korean population are associated with susceptibility to chronic hepatitis and hepatocellular carcinoma. Liver Int. 2008 doi: 10.1111/j.1478-3231.2008.01843.x. [DOI] [PubMed] [Google Scholar]
- 39.Wang D, Li Z, Messing EM, et al. Activation of Ras/Erk pathway by a novel MET-interacting protein RanBPM. J Biol Chem. 2002;277:36216–36222. doi: 10.1074/jbc.M205111200. [DOI] [PubMed] [Google Scholar]
- 40.Wang Y, Marion Schneider E, Li X, et al. HIPK2 associates with RanBPM. Biochem Biophys Res Commun. 2002;297:148–153. doi: 10.1016/s0006-291x(02)02020-x. [DOI] [PubMed] [Google Scholar]
- 41.Oleinik NV, Krupenko NI, Priest DG, et al. Cancer cells activate p53 in response to 10-formyltetrahydrofolate dehydrogenase expression. Biochem J. 2005;391(Pt 3):503–511. doi: 10.1042/BJ20050533. [DOI] [PMC free article] [PubMed] [Google Scholar]
- 42.Anthony TE, Heintz N. The folate metabolic enzyme ALDH1L1 is restricted to the midline of the early CNS, suggesting a role in human neural tube defects. J Comp Neurol. 2007;500:368–383. doi: 10.1002/cne.21179. [DOI] [PubMed] [Google Scholar]
- 43.Cahoy JD, Emery B, Kaushal A, et al. A transcriptome database for astrocytes, neurons, and oligodendrocytes: A new resource for understanding brain development and function. J Neurosci. 2008;28:264–278. doi: 10.1523/JNEUROSCI.4178-07.2008. [DOI] [PMC free article] [PubMed] [Google Scholar]
- 44.Krupenko SA, Oleinik NV. 10-formyltetrahydrofolate dehydrogenase, one of the major folate enzymes, is down-regulated in tumor tissues and possesses suppressor effects on cancer cells. Cell Growth Differ. 2002;13:227–236. [PubMed] [Google Scholar]
- 45.Pizzorno G, Moroson BA, Cashmore AR, et al. (6R)-5,10-Dideaza-5,6,7,8-tetrahydrofolic acid effects on nucleotide metabolism in CCRF-CEM human T-lymphoblast leukemia cells. Cancer Res. 1991;51:2291–2295. [PubMed] [Google Scholar]
- 46.Beardsley GP, Moroson BA, Taylor EC, et al. A new folate antimetabolite, 5,10-dideaza-5,6,7,8-tetrahydrofolate is a potent inhibitor of de novo purine synthesis. J Biol Chem. 1989;264:328–333. [PubMed] [Google Scholar]
Associated Data
This section collects any data citations, data availability statements, or supplementary materials included in this article.


