Abstract
Background
Although oxidative phosphorylation defects can affect the liver, these conditions are poorly understood, partially because of the lack of animal models.
Aims
To create and characterise the pathophysiology of mitochondrial hepatopathies in a mouse model.
Methods
A mouse model of mitochondrial hepatopathies was created by the conditional liver knockout (KO) of the COX10 gene, which is required for cytochrome c oxidase (COX) function. The onset and progression of biochemical, molecular and clinical phenotypes were analysed in several groups of animals, mostly at postnatal days 23, 56, 78 and 155.
Results
Biochemical and histochemical analysis of liver samples from 23–56-day-old KO mice showed liver dysfunction, a severe COX deficiency, marked mitochondrial proliferation and lipid accumulation. Despite these defects, the COX-deficient hepatocytes were not immediately eliminated, and apoptosis followed by liver regeneration could be observed only at age 78 days. Hepatocytes from 56–78-day-old KO mice survived despite very low COX activity but showed a progressive depletion of glycogen stores. In most animals, hepatocytes that escaped COX10 ablation were able to proliferate and completely regenerate the liver between days 78 and 155.
Conclusions
The results showed that when faced with a severe oxidative phosphorylation defect, hepatocytes in vivo can rely on glycolysis/glycogenolysis for their bioenergetic needs for relatively long periods. Ultimately, defective hepatocytes undergo apoptosis and are replaced by COX-positive cells first observed in the perivascular regions.
Defects in mitochondrial oxidative phosphorylation (OXPHOS) can lead to clinical liver involvement (mitochondrial hepatopathies) in children, particularly during the neonatal period. Features that indicate liver involvement are hypoglycaemia, elevated liver transaminases and hepatomegaly. Pathologically, mitochondrial hepatopathies are characterised by steatosis (fatty liver) that in some instances could develop into fibrosis, cholestasis and necrosis.1–3
Because livers of patients with mitochondrial hepatopathies are studied only at end stage, the metabolic adaptations and pathophysiological changes associated with the process cannot be analysed. To understand better the pathobiology of hepatocytes with defective OXPHOS, we produced a cytochrome c oxidase-deficient conditional knockout (KO) using the Cre–loxP system. Cytochrome c oxidase (COX or complex IV) is the terminal enzyme of the respiratory chain and contains two haem groups (a and a3). 4,5 COX10, a haem o-farnesyltransferase, participates in haem a biosynthesis.6,7
MATERIALS AND METHOD
Animal husbandry
Mice carrying the floxed COX10 gene were created in our laboratory as described.8 The albumin Cre transgenic mouse was obtained from Jackson Laboratories.9 The procedures were approved by the Animal Care and Use Committee of the University of Miami.
PCR and Southern blot
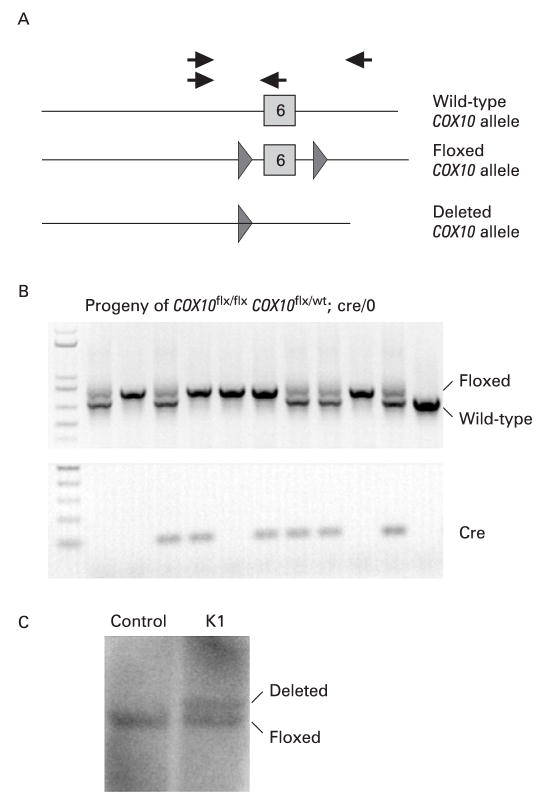
Deletion of exon 6 from the COX10 floxed allele was detected by PCR using primers described in fig 1A (grey arrows) and confirmed by Southern blot as described.8
Figure 1.
Creation of a liver-specific COX10 knockout (KO) mouse. We introduced loxP sites flanking exon 6 of the COX10 gene to produce conditional KO mice.8(A) Diagram of the COX10 gene showing the exon 6 wild-type allele, the floxed COX10 allele (triangles represent the loxP sites flanking the exon) and the deleted COX10 allele resulting from Cre recombination. To obtain the liver-specific COX10 KO mouse, we crossed a mouse homozygous for the floxed allele with a heterozygous mouse for the floxed allele carrying the Cre recombinase transgene under the albumin promoter. (B) The progeny were genotyped by PCR using the set of primers indicated with black arrows in (A) and with specific primers to detect the presence of Cre. The COX10 KO mice are homozygous for the floxed gene and contain the Cre transgene (lanes 4 and 6). (C) Southern blot of control and K1 liver DNA digested with BamHI showing the presence of the deletion and floxed alleles using a genomic probe for the COX10 gene.
Histochemistry, immunohistochemistry and electron microscopy
Frozen sections were stained for COX, succinate dehydrogenase (SDH) and combined activities.10 To determine glycogen content, liver sections were stained with periodic acid–Schiff (PAS) with a commercial reagent (Sigma).
For immunohistochemistry, liver sections fixed in 4% paraformaldehyde were incubated with the primary antibody (anti-active caspase-3 antibody from Cell Signaling) overnight at 4°C, washed with phosphate-buffered saline (PBS) and incubated with Alexa fluor-488-conjugated secondary antibody for 1 h. For double staining, after incubation with the secondary antibody, sections were washed and incubated with anti-Cox1 Alexa fluor-594-conjugated monoclonal antibody (Molecular Probes). The fluorescent signal was observed in a Carl Zeiss LMS510 confocal microscope.
Transmission electron microscopy was performed using standard procedures.11
Isolation of mitochondria and determination of enzyme activities of respiratory complexes
Mitochondrial preparations were obtained as described8 and stored at −80°C until needed. Enzyme activities were determined spectrophotometrically as described.12 Protein concentrations were estimated by the method of Bradford using bovine serum albumin (BSA) as a standard.13
Blue native gel electrophoresis and western blots
Isolated liver mitochondria were processed for separation by blue native gel electrophoresis in 4–13% gradient gels and treated for in-gel activity assays as described previously.8
Antibodies against the following proteins were used for western blot analyses: Cox1, Cox5b, Cox6b, iron–sulphur protein, core 2, ATPase-β and SDH flavoprotein from Molecular Probes, cytochrome c from Pharmigen, superoxide dismutase 2, from Upstate and Cre recombinase from Novagen.
Determination of liver enzymes in blood
Blood was withdrawn from deeply anesthetised animals by cardiac puncture, serum was obtained and the levels of liver enzymes determined by the Comparative Pathology Laboratory at the University of Miami, Miller School of Medicine.
Determination of COX10 deletion in liver
To quantify the amount of deletion of COX10 in liver, we performed a multiplex PCR with the mixture of primers shown in fig 1A. Both deletion and floxed amplicons were cloned individually into plasmids and mixed at different known ratios to construct a calibration curve for PCR quantification. To quantify the products, a last cycle hot PCR was performed in the presence of [32P]dCTP.
Determination of glycogen and free glucose content in liver
Glycogen in liver homogenates was determined using a standard curve with glucose treated in the same way as the samples.14 Cleared liver homogenates were analysed for glucose and lactate content in a 2300 STAT plus glucose and lactate analyser (YSI Life Sciences, Yellow Springs, OH).
Proliferation of hepatocytes
To assess hepatocyte proliferation, we determined the incorporation of bromodeoxyuridine (BrdU) into DNA by intraperitoneal injection of control and KO mice with 50 μg/g of body weight of BrdU (4 mg/ml in PBS).15 Mice were sacrificed 24 h after injection and liver tissue extracted, frozen, sectioned and processed for double immunostaining after performing antigen retrieval. Double immunolabelling was performed with anti-BrdU-specific antibody (Roche) and anti-Cox1p-Alexa-labelled antibody (Molecular Probes). Hepatocyte proliferation was also followed by immunostaining of liver sections with nuclear antigen Ki67 antibody (Novocastra Laboratories).
Determination of ATP concentration in liver
Animals were anesthetised and liver tissue extracted and immediately frozen in liquid nitrogen. ATP was extracted from tissues using perchloric acid as described previously.16 ATP concentrations were determined using the luciferase-based “ATP Determination Kit” from Molecular Probes, and values were normalised to mg of tissue.
Induction of apoptosis in hepatocytes
Apoptosis in liver was induced by intraperitoneal injection of mice with 0.5 μg of Jo2 antibody (diluted in PBS)/g of body weight (BD Pharmigen) as described previously17 and 3 h after injection liver was obtained and processed for immunostaining. Sham injections were performed with PBS alone. Apoptotic hepatocytes were examined with the “In Situ Cell Death Detection Kit” from Roche based on terminal deoxynucleotidyl transferase-mediated dUTP nick end labelling (TUNEL) following the manufacturer’s instructions.
Triglyceride content in liver
Liver homogenates were prepared in 25 mM sodium phosphate, 1 M NaCl, 1 mM EDTA pH 7.4,18 and triglyceride levels were determined using the Vitros DT60/DT60 II Chemistry System Bioanalyzer with Vitros TRG DT slides and DT calibrator Kit (Ortho-Clinical Diagnostics).
Data analysis
Data obtained are represented as mean (SD) from 3–7 mice per group, and statistical significance was determined using the Student t test. A p value <0.05 was considered significant.
RESULTS
Creation of a liver-specific COX10 knockout mouse
To create a COX10 KO mouse, we introduced loxP sites flanking exon 6 of COX10, which codes for part of the active site of the enzyme, and, using the Cre–loxP system, we performed ablation of the gene in a tissue-specific manner. The production of floxed COX10 mice was described in Diaz et al.8 To produce the liver-specific COX10 KO, we crossed a mouse homozygous for the floxed COX10 gene with a transgenic mouse expressing Cre recombinase under the rat albumin promoter.9 Figure 1A shows a diagram of the wild-type, floxed and deletion alleles of the COX10 gene that were detected by PCR using the specific primers outlined in the figure by arrows. The primers, indicated by black arrows, amplified both the wild-type (708 bp) and the floxed alleles (838 bp) in the same reaction. Figure 1B shows the genotype of animals obtained by crossing a COX10flox,flox mouse with a COX10flox/wt, Alb-Cre+/0 mouse. KO animals were homozygous for the floxed COX10 and Cre positive (fig 1B, lanes 4 and 6). The presence of the deletion allele was also detected by Southern blot using a COX10-specific probe (fig 1C).
Liver dysfunction in the liver-specific COX10 knockout
The liver-specific COX10 KO mice looked healthy, were able to reproduce and had the same life span as control littermates. We refer to these mice as “K1”. When we crossed two K1 mice, some of the animals in the progeny (25%) were smaller (weight was approximately 2–3 g less than that of control littermates), had less spontaneous activity, lost weight and died prematurely between 45 and 65 days of age. We will refer to these latter animals as “K2” mice. As described in more detail below, molecular analysis confirmed that the K1 mice were hemizygous whereas the K2 mice were homozygous for the Cre transgene.
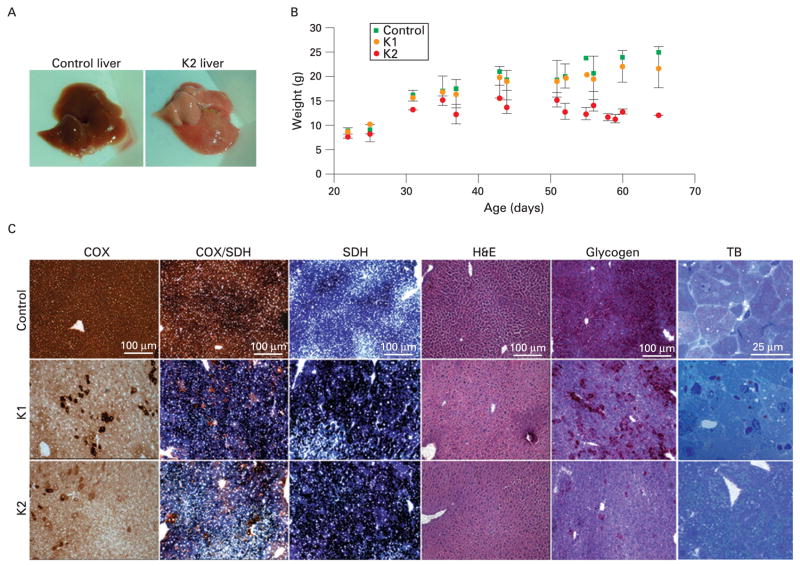
Gross pathology of the liver of K2 animals showed a very pale coloration, indicating steatosis or “fatty liver” (fig 2A). K2 animals presented with enlarged liver (hepatomegaly) and a few of them with necrotic spots (n = 3, not shown). We determined the liver to body weight ratio and found that this ratio in control mice was 4.92% (0.7%) (n = 16). This value is in agreement with the ratio of 4.5% (0.1%) reported previously by Rudnick et al.19 K1 and K2 COX10 KO mice had values of 5.68% (1.6%) (n = 18) and 11.88% (1.1%) (n = 9), respectively. The K2 mice displayed hepatomegaly, with a twofold higher liver/body weight ratio than control and K1 mice, whereas K1 and control ratios were not significantly different (p = 0.09). Figure 2B shows a weight curve of control and KO mice at different ages. Although not observed in K1 animals (fig 2B, orange circles), K2 mice were lighter from an early age and lost weight as disease progressed (fig 2B, red circles).
Figure 2.
Liver COX10 knockout (KO) phenotype. We obtained COX10 KO mice heterozygous (K1) or homozygous (K2) for the Cre transgene. K1 mice looked healthy and had a normal life span while K2 mice died at about 45–65 days of age (A) Gross phenotype of liver steatosis or “fatty liver” (pale coloration) of a 56-day-old K2 mouse compared with control. (B) Weight curves of K1 (orange circles) and K2 (red circles) mice compared with control (green squares) at different ages. Values are represented by the mean and standard deviation. (C) Histochemical analysis of control and COX10 KO mice at 56 days of age. Frozen liver sections were stained for cytochrome c oxidase (COX), COX/succinate dehydrogenase (SDH), SDH, H&E, glycogen (periodic acid–Schiff staining) and toluidine blue (TB). Scale bar for all staining is 100 μm, except for toluidine blue (25 μm).
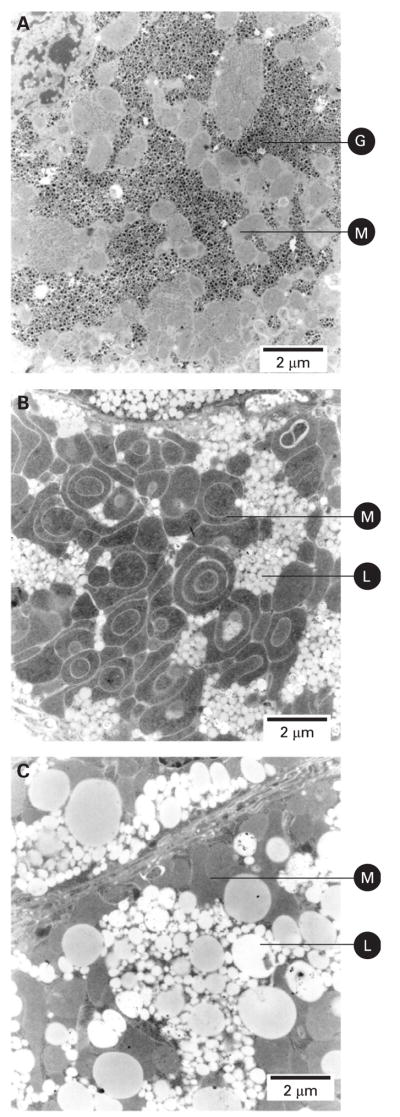
Histological examination of liver sections of 56-day-old mice showed a severe decrease in COX activity in both K1 and K2 animals when compared with controls. At this age, there were hepatocytes with COX activity that seemed to escape COX10 ablation (fig 2C). The COX-positive hepatocytes were located mostly in perivascular zones, and there were a larger number in K1 than in K2 animals. The SDH activity was increased in both K1 and K2 mice, suggesting mitochondrial proliferation. There were no apparent signs of fibrosis or lymphocyte infiltration by H&E staining in KO mice (fig 2C). Examination of H&E stain at higher magnification showed that the hepatocytes of both K1 and K2 mice were hyperplasic and K2 had diffused cell boundaries (not shown). The PAS staining showed that K1 mice had decreased glycogen stain compared with control, whereas the K2 animals had a negative stain (fig 2C). Toluidine blue stain showed the presence of microvesiclular steatosis (lipid droplets smaller than the nucleus) with lipids staining a grey-greenish colour20 in K2 animals. The lipid droplets in K1 animals were not as evident as in K2 with the toluidine blue stain (fig 2C). Electron microscopy (EM) showed prominent mitochondrial proliferation and confirmed the presence of small lipid droplets in K1 mice (fig 3B) whereas in the K2 mice, in addition to the mitochondrial proliferation, accumulation of larger lipid droplets was observed (fig 3C). In K2 hepatocytes, occasionally, macrovesicular steatosis was observed. Perivascular hepatocytes were less prone to lipid accumulation than the hepatocytes located in the liver parenchyma. The cytoplasmic glycogen granules observed by EM of control mice (fig 3A) were decreased or absent in both K1 and K2 mice (fig 3B and C), in agreement with PAS staining (fig 2C).
Figure 3.
Mitochondrial proliferation and accumulation of lipid droplets in liver of COX10 knockout mice. Electron micrographs of liver sections of 60-day-old animals. (A) Liver of a control mouse showing cytoplasmic glycogen granules and normal mitochondria. (B) Liver of a COX10 K1 mouse showing an increased number of mitochondria and accumulation of small lipid droplets. (C) Liver of a COX10 K2 mouse showing larger lipid droplets and absence of cytoplasmic glycogen granules. Images were obtained at 8900×magnification. G, glycogen granules; M, mitochondria; L, lipid droplets. Scale bar: 2 μm.
Changes in energy storage, triglyceride content and liver injury observed in COX10 KO were reversed with age
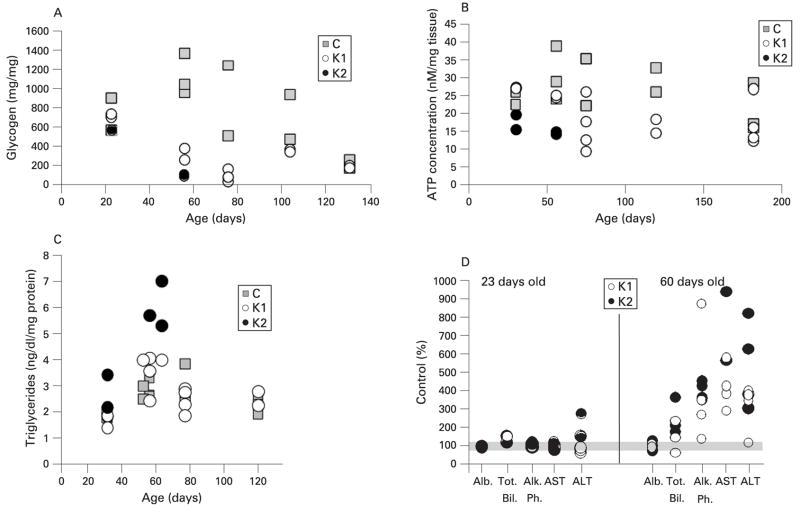
The decrease of energy storage (glycogen) observed in KO hepatocytes by PAS staining was quantified. Figure 4A shows the amount of glycogen in liver extracts of control, K1 and K2 mice at different ages. In young animals (23 days of age), glycogen levels were comparable with those of controls, but at 56–78 days there was a significant decrease in glycogen levels of both K1 and K2 mice. Unexpectedly, older K1 animals had similar levels of stored glycogen to control mice (fig 4A). The levels of free glucose were also analysed in liver homogenates at different ages and showed exactly the same trend as glycogen. At 56 and 75 days of age, the levels of free glucose in K1 mice decreased to 25 and 10% of control, respectively, and by 104 days of age the glucose was back to control levels (data not shown).
Figure 4.
Glycogen depletion, ATP decrease, elevation of triglycerides and liver injury in COX10 knockout (KO) mice returned to normal levels with age. (A) Glycogen content was determined in liver samples (50–100 mg tissue) of COX10 KO mice (K1 and K2) at different ages. Values are expressed as a percentage of those of control littermates. (B) ATP concentration in liver extracts of control, K1 and K2 mice at different ages was determined using a luciferase assay. Values were normalised to mg of tissue used for the extraction. (C) Triglyceride levels were measured in liver homogenates and normalised to mg of protein. (D) Levels of different liver markers: albumin (Alb), total bilirubin (Tot. Bil.), alkaline phosphatase (Alk Ph.), aspartate aminotransferase (AST) and alanine aminotransferase (ALT) in blood serum were expressed as a percentage of control values. The grey bar indicates 100%. The symbols in all the graphs represent one mouse. Control mice are represented by grey squares, K1 by open circles, and K2 by filled circles.
We also determined ATP content in liver tissue at different ages. Figure 4B shows that ATP concentrations were slightly decreased (p = 0.07) in K2 mice at 23 days of age and, as disease progressed, the decrease became statistically significant at 56 days (p = 0.03) when compared with control mice. In K1 mice, a greater difference in ATP levels when compared with controls was observed at 75 days of age, and then as animals aged they recovered ATP concentrations to control levels.
The lipid accumulation observed by EM and toluidine blue stain in both K1 and K2 livers was quantified by measuring triglycerides in liver homogenates. Figure 4C shows an increase in triglycerides in both K1 and K2 mice compared with controls at 56 days of age. Although the difference in triglycerides in K1 mice was modest, it was statistically significant (p = 0.046), whereas the increase of these lipids in K2 mice was almost double the control values. As animals aged (K1), the triglyceride content returned to control levels (fig 4C).
Analysis of liver enzymes in sera showed that total bilirubin, alkaline phosphatase (AP), alanine (ALT) and aspartate (AST) aminotransferases were not altered in 23-day-old K1 and K2 mice compared with control, whereas at 60 days of age, K1 and K2 mice showed a remarkable increase in these factors (fig 4D). Albumin levels in blood remained unaltered in KO mice compared with controls. These increased levels of liver markers in blood returned to normal levels as K1 mice aged (not shown). Taken together, these results suggested that the deletion of COX10 influences liver function and integrity, but as the K1 animals aged they recovered from the liver injury.
The severe cytochrome c oxidase deficiency in the liver COX10 KO returned to normal levels with age
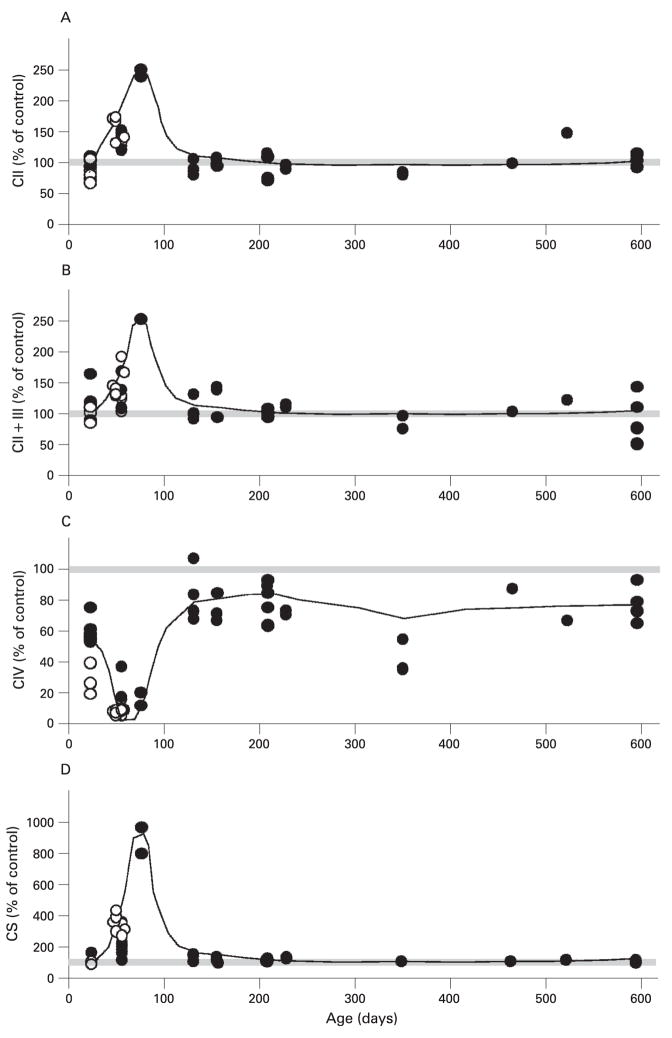
Figure 5 shows the activity of different complexes in liver from K1 and K2 mice at different ages normalised to age-matched controls. Figure 5C shows a moderate complex IV deficiency in young K1 mice (about 23 days of age) with a mean (SD) of 59.31% (8.13%) of control values, whereas in K2 mice the COX deficiency was twice as low (28.09% (10.06%) of control). This COX deficiency became more severe at 56–78 days of age in both K1 and K2 mice (13.57% (3.08%) and 7.05% (1.62%) of control values, respectively). As exemplified by the short life span of K2 mice, the lack of COX10 in liver is ultimately lethal. Surprisingly, as ageing progressed, the severity of the COX deficiency was mitigated in K1 mice and, in animals older than 100 days of age, the enzyme activity reached levels of approximately 80% of controls (fig 5C). The decrease in COX activity at 56–78 days of age was accompanied by an increase in other respiratory complex enzyme activities in both K1 and K2 (fig 5A, B and D). The increase in OXPHOS activities was higher in K2 compared with K1 at 56 days of age. In the case of K1 mice, the increase in activities reached a peak at 78 days of age and then returned to normal levels as the animals aged further.
Figure 5.
Enzyme activities of respiratory complexes of control and COX10 knockout (KO) mice. Enzyme activities were determined spectrophotometrically in isolated liver mitochondria of KO mice as described in the Materials and methods section. (A) Succinate decylubiquinone DCPIP reductase or complex II activity. (B) Succinate cytochrome c reductase or complex II + III activity. (C) Cytochrome c oxidase or complex IV activity. (D) Citrate synthase activity. The enzymatic activities are expressed as a percentage of mean values obtained from control animals on the same day (control n = 35 and K1+K2 n = 52). Each symbol represents one mouse; filled circles are K1 mice and open circles are K2 mice. The trend in enzyme activity changes at different ages is represented with a line in the graphs and 100% is depicted with a grey bar.
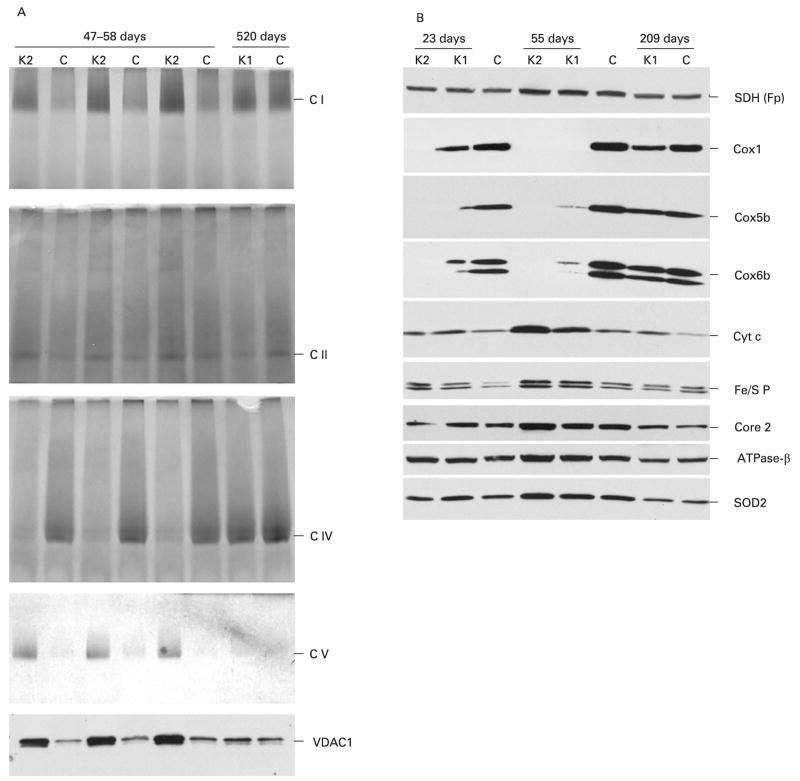
Analysis of respiratory complexes by blue native electrophoresis and in-gel activity assays confirmed a deficiency in COX activity levels as well as an increase in the activities of complexes I, II and V in 47–58-day-old K2 mice (fig 6A). In older K1 animals, again, all respiratory complex activities and even complex IV activity were comparable with control levels (fig 6A). Analysis of the steady-state levels of different subunits of the respiratory chain showed that COX subunits were decreased in 23-day-old K1 mice and undetectable at 56 days, whereas in K2 mice they were not detected at either age. In old K1 mice, they were only slightly decreased when compared with control animals (fig. 6B). The steady-state levels of cytochrome c, subunits of complexes II (SDH Fp), III (Fe/S P, core 2) and V (ATPase-β) and mitochondrial Mn-superoxide dismutase (SOD2) were also increased in 56-day-old KO mice compared with control mice, but not in older animals (fig 6B).
Figure 6.
Steady-state levels of respiratory complexes in control and COX10 knockout mice changed with age. Oxidative phosphorylation complexes were separated from isolated mitochondria (20 μg) by 4–13% gradient blue native electrophoresis. (A) In-gel activity stain of the blue native gels for complexes I, II, IV and V, respectively. The voltage-dependent anion channel (VDAC1) western blot was used as a loading control for the blue native gels. (B) Steady-state levels of different subunits of the respiratory complexes of control, K1 and K2 mice at different ages. Mitochondrial proteins (25 μ) were separated by SDS–polyacrylamide gel electrophoresis, transferred to a polyvinylidene difluoride membrane and blotted with antibodies against several subunits of complex IV (Cox1, Cox5b, Cox6b), cytochrome c, complex III (iron–sulphur protein (Fe/S P) and core 2), complex V (ATPase-β) and Mn-superoxide dismutase 2 (SOD2).
COX-positive hepatocytes reconstituted the liver in COX10 knockout mice
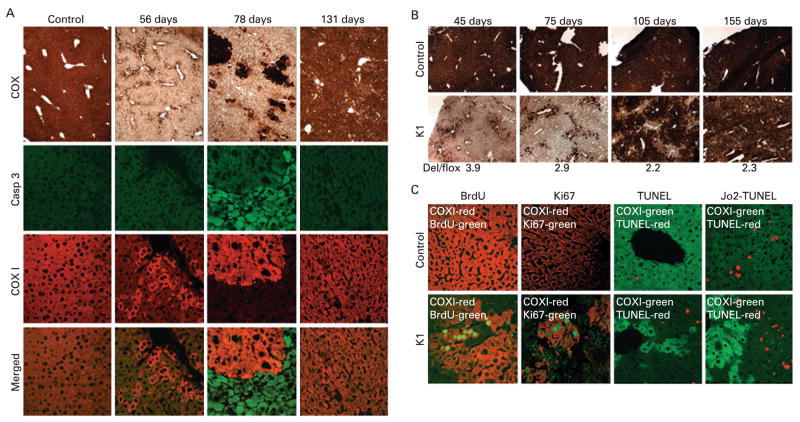
Figure 7A shows a severe deficiency of COX activity in the 56-day-old mice with the presence of very few COX-positive hepatocytes. In 78-day-old mice it appeared that the COX-positive hepatocytes had multiplied and formed clusters of COX-positive cells, and by the time the animals were 131 days of age the majority of the liver tissue was composed of COX-positive hepatocytes with only a few COX-deficient cells remaining. To determine whether this was caused by proliferating hepatocytes, we followed the incorporation of BrdU into DNA and also determined the expression of the nuclear antigen Ki67 in liver sections. Figure 7C shows that only COX-positive hepatocytes (red label) incorporated BrdU (green label) in 78-day-old COX10 K1 mice. In control livers, the occasional incorporation of BrdU was observed. The proliferation of COX-positive hepatocytes (red label) was confirmed with immunostaining of the cell proliferation marker Ki67 (green label).
Figure 7.
Caspase-3 (Casp 3) activation and regeneration in hepatocytes from COX10 knockout mice. Frozen liver sections (6–8 μm) were obtained from control and K1 mice at different ages and (A) stained for cytochrome c oxidase (COX) activity or immunostained with antibodies against the active form of caspase-3 (green label) or Cox1p (red label). Cox1p is used as a marker for COX10 deletion and COX activity. (B) Small liver biopsies (about 5 mm2) obtained from the same control and K1 mice at different times and stained for COX activity (figure shows a representative example n = 6 for each group). The figure shows the severe COX deficiency obtained at an early age, and as age progressed the liver regenerated with COX-positive hepatocytes. The amount of COX10 deletion (Del/flox) in the K1 mouse at the different time points was determined as described in the Materials and methods section and indicated at the bottom of the figure. (C) The two left-hand panels show proliferation of COX-positive hepatocytes by bromodeoxyuridine (BrdU) incorporation and expression of nuclear antigen Ki67 by immunostaining (green label) and Cox1p (red label) in 78-day-old control and K1 mice. The two right-hand panels show basal and induced (Jo2 injection) levels of apoptotis assessed by terminal deoxynucleotidyl transferase end labelling (TUNEL) assay in 60-day-old control and K1 mice. TUNEL stain is labelled in red and Cox1p in green.
COX-deficient hepatocytes remained viable for approximately 40 days in the absence of a functional OXPHOS (between 23 and 70 days of age). We were unable to observe any caspase-3 activation in control and K1 mice at 56 days of age by immunostaining (fig 7A). Apoptotic cells were also analysed by TUNEL staining. Figure 7C shows that the number of TUNEL-positive cells (red label) was higher in K1 mice compared with controls and that they were present in COX-deficient cells in 60-day-old mice. In contrast, at 78 days of age, there was extensive caspase-3 activation in the hepatocytes lacking Cox1 immunos-taining and, as age progressed, and the liver regenerated, there were fewer apoptotic hepatocytes remaining (fig 7A).
Figure 7B shows a representative sample of small liver biopsies obtained from the same individuals (control and K1, respectively) at 1 month intervals. Liver of K1 mice, at 45 days of age, had a severe COX deficiency with few COX-positive hepatocytes. One month later, at 75 days of age, there were slightly more COX-positive cells, and after another month (105 days) we observed large patches of COX-positive hepatocytes. The last biopsy was obtained at 155 days of age, and the liver was almost completely repopulated with COX-positive hepatocytes. The amount of COX10 deletion was calculated in the small liver biopsies with multiplex PCR as described in the Materials and methods section and in fig 8A. The values obtained are indicated at the bottom of fig 7B. Initially, the levels of the COX10 deleted allele were high and decreased with time, as the COX-positive hepatocytes were able to multiply. The temporal pathology obtained in the same animals was essentially identical to that obtained in different animals (fig 7A and B).
Figure 8.
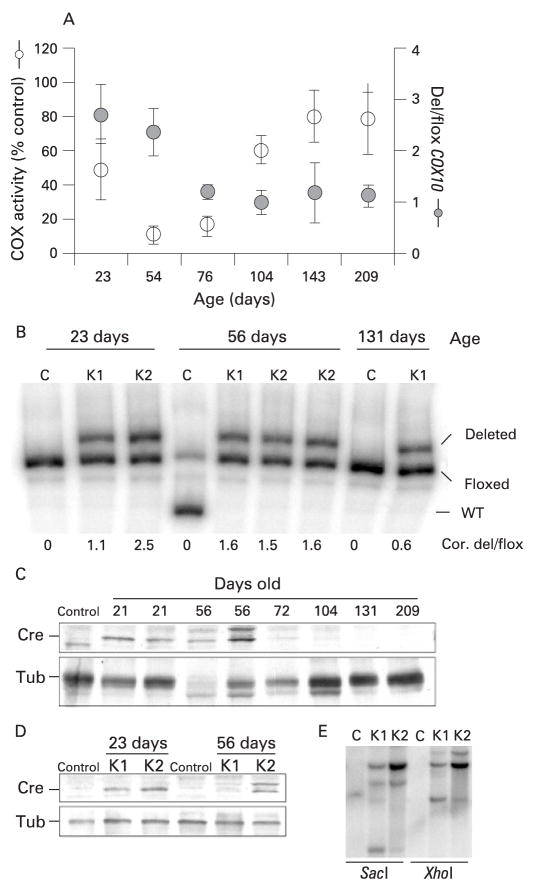
Changes of COX10 deletion and Cre expression with age in COX10 knockout (KO) mice. The amount of COX10 deletion was calculated by the last cycle hot multiplex PCR using the set of primers depicted in fig 1A. We constructed a standard curve to correct the values for preferential amplification (described in the Materials and methods section). (A) Correlation of the amount of COX10 deletion (expressed as a ratio of deleted to floxed allele; Del/flox) and cytochrome c oxidase (COX) activity of K1 mice at different ages. Values in the graph are the corrected values using the standard curve represented as mean and standard deviation. (B) Last cycle hot multiplex PCR showing amplification of the deletion, floxed and wild-type COX10 alleles separated in a 5% acrylamide gel. Numbers below the figure correspond to the corrected values of COX10 deletion expressed as the ratio of the deleted/floxed amplicon (Cor. del/flox). The 56 day control mouse is heterozygous, containing the floxed and wild-type COX10 alleles. (C) Steady-state levels of Cre recombinase in control and KO mice at different ages. Liver nuclear extracts of control, K1 and K2 mice were western blotted with anti-Cre polyclonal antibody and with an anti-tubulin monoclonal antibody for loading control. (D) Steady-state levels of Cre in K1 and K2 mice at 23 and 56 days of age using tubulin (Tub) as a protein loading control. (E) Southern blot of Cre recombinase in K1 and K2 mice. Liver DNA was digested with SacI or XhoI, separated in an agarose gel, transferred to a Z-probe membrane and hybridised with a Cre-specific probe. K1 mice are hemizygous and K2 mice are homozygous Cre as shown by western and Southern blot.
COX-deficient hepatocytes are more susceptible to Jo2-induced apoptosis
We examined the survival of COX-deficient hepatocytes under a stress challenge, using the stimulation of the Fas receptor signalling pathway in liver by injecting Jo2 antibodies in both control and K1 mice at 60 days of age. Figure 7C shows TUNEL assays of hepatocytes 3 h after Jo2 injection. The number of TUNEL-positive cells per field examined at 20× magnification was significantly higher in the K1 mice compared with control animals (39.5 (3.5) and 24.4 (7.7), respectively, p = 0.002). About 90% of the TUNEL-positive cells in K1 mice challenged with Jo2 antibody were COX-negative hepatocytes, indicating a higher sensitivity to the apoptotic signalling, whereas only 10% of the TUNEL-positive cells were COX positive. Sham injections with PBS showed occasional apoptotic cells in both control and K1, but were more frequent in the knockout mice (fig 7C).
COX10 deletion and Cre expression in liver decreased with age in the COX10 KO
To try to understand the unexpected change in phenotype from a severe COX deficiency to an essentially complete recovery as K1 aged, we investigated the amount of COX10 deletion in KO mice at different ages. Figure 8A shows the relationship between the amount of COX10 deletion (deleted/floxed) and the COX activity obtained in the K1 mice at different ages. In young animals, the amount of deletion was high, but decreased with age. Figure 8B shows an example of the “last cycle hot” multiplex PCR used to obtain the data in fig 8A. At the bottom of fig 8B, the values of COX10 deletion are shown.
To investigate the causes of the decreased COX10 deletion with age, we examined the levels of Cre recombinase in nuclear extracts by western blot. Figure 8C shows that the steady-state levels of Cre were high in young animals (23–56 days old) and, as age progressed, Cre became barely detectable. As expected, K1 animals had lower levels of Cre compared with K2 mice, indicating that K2 mice were homozygous for the Cre transgene whereas K1 mice were hemizygous (fig 8D). Southern blot analysis confirmed the higher levels of Cre transgene in liver DNA from K2 compared with K1 mice (fig 8E).
DISCUSSION
An animal model of mitochondrial hepatopathies
Infants with mitochondrial diseases can present liver involvement.21 They often have lactic acidosis, hypoglycaemia, hyperbilirubinaemia with elevated liver transaminases, and mild to moderate hepatomegaly. Analysis of liver biopsies of these patients showed microvesicular steatosis (accumulation of fat) in the absence of hepatic inflammation, in some cases also macrovesicular steatosis, increased mitochondrial density with swelling and abnormal cristae and low enzyme activities of respiratory complexes (reviewed in Chinnery and DiMauro,1 Bandyopadhyay and Dutta2 and Sokol and Treem3). There is a spontaneous reversal of liver malfunction in some infants, but in others the liver pathology rapidly deteriorates into cholestasis, coagulopathy and ascites.1
In this study we described the creation of a liver-specific COX10 KO mouse that resulted in a severe COX deficiency in hepatocytes and presented phenotypes (hepatomegaly, microsteatosis and elevated transaminases) similar to that observed in mitochondrial hepatopathies in children. Depending on the Cre recombinase expression levels (homozygocity or hemizygocity), we observed two types of KO mice: K2 mice (homozygous Cre), which presented a more severe liver phenotype with a fatal outcome, and K1 mice (heterozygous Cre), which presented a moderate phenotype where hepatocytes regenerated resulting in the recovery of normal liver function. To our knowledge, this is the first mouse model of an OXPHOS deficiency in liver. Kokoszka et al have reported an ANT2 conditional liver KO, but no information on the liver function or potential regeneration was provided, as the study focused on the role of ANT in the mitochondrial permeability transition pore.22
Pathophysiology and cell death signals in COX10 liver KO mice
In our COX10 KO mice, the COX-negative hepatocytes were able to survive in the absence of OXPHOS for relatively long periods of time (from approximately 23 to 75 days of age). These observations suggest that there is a remarkable capacity of hepatocytes to survive in the absence of OXPHOS function. Because of the marked glycogen depletion, we can infer that the COX-deficient hepatocytes rely on glycolysis/glycogenolysis for survival and, when energetic demands are no longer met, death signals are initiated. Although we did not observe large numbers of apoptotic cells in young mice (assessed by TUNEL and caspase-3 immunostaining), necrotic cell death was inferred by the elevated level of transaminases and liver markers observed in blood. Moreover, focal necrotic lesions were observed in K2 livers. However, apoptotic death is observed at later ages (70 days). Finally, our results indicated that COX-deficient hepatocytes are more susceptible to apoptosis than control hepatocytes under stress (Jo2 antibody), indicating that the delayed cell death observed (in relation to the onset of COX deficiency) was not due to impairment in their apoptotic capacity.
Several studies performed in primary cultures of hepatocytes showed that carbohydrate utilisation can delay the onset of cell death.23–25 In hypoxia studies, a process that shares many features with the impairment of OXPHOS, carbohydrate utilisation also contributed to the preservation of the levels of ATP.26,27
A metabolic switch has been observed in a heart-specific mitochondrial transcription factor A (TFAM) KO mouse early in the progression of a mitochondrial cardiomyopathy. A large number of genes coding for glycolytic enzymes showed increased expression, whereas there was a decrease in the expression level of genes encoding enzymes in fatty acid oxidation.28 In contrast to their findings, we did not observe an increase in the levels of the glycolytic enzyme glyceraldehyde 3-phosphate dehydrogenase in the COX10 KO mice (data not shown) but we cannot discard the possibility that other glycolytic enzymes could be altered. The heart-specific TFAM KO mice also had reduced expression of the transcription co-activator peroxisome proliferator-activated receptor α (PPARα), a major regulator of fatty oxidation metabolism.28 We determined the levels of PPARα by real-time PCR in our COX10 KO mice at 23 days of age and found that the levels were lower in both K1 and K2 mice compared with the control. By 56 days of age, PPARα transcript levels decreased even further, being lower for the K2 mouse (data not shown). The reduction in the levels of PPARα transcripts in the COX10 KO mice are in agreement with the accumulation of lipids observed in the KO mice at 56 days of age, probably due to a reduction in the fatty acid oxidation metabolism.
Differences in severity of the K1 and K2 phenotype are due to the efficiency of COX10 deletion
The difference in the phenotype between the K1 and K2 mice can be explained by higher expression of Cre and therefore higher efficiency of recombination. Incomplete recombination using the Alb–Cre transgene has been observed in other cases, but a decrease in Cre expression with age was not reported.22–29,30 The Cre transgenic mouse we used was created by Postic et al9 and was estimated to produce an efficiency of recombination of 40% at birth. This efficiency increased with time and at 1 week of age was 60%, at 3 weeks was 75% and by 6–12 weeks was 90%.31 In our COX10 KO mice we observed a decrease of recombination with age. An interesting feature of this phenomenon is that the ratio of deletion/floxed alleles plateaus at “1” (fig 7A), suggesting that the regenerating hepatocytes have only half of their alleles recombined (KO). DNA sequencing of the loxP sites did not reveal any mutation that could explain a decrease in Cre recombination (data not shown).
Patterns of liver regeneration after a bioenergetic crisis
The source of regenerated hepatocytes in the COX10 KO mouse is unclear. The source could be: (1) mature hepatocytes that for some reason escaped complete COX10 ablation; or (2) stem cells from different sources (oval cells or haematopoietic cells). Recently, Conzelmann et al32 showed that both intrahepatic and extrahepatic stem cells participate in liver regeneration during liver transplantation experiments. In addition, cell fusion of progenitor cells with hepatocytes forming heterokaryons has been reported.33,34 From our observations, the overwhelming majority of the COX-positive hepatocytes were initially located in perivascular regions, suggesting that COX-positive cells came from systemic sources. On the other hand, zonal patterns of expression of several proteins in the liver have been reported, and it has been proposed that there is a compartmentalisation of metabolic functions in the liver parenchyma and that gluconeogenesis and glyconeogenesis, β oxidation of lipids and amino acid metabolism occurred in periportal hepatocytes, while glycolysis and lipid synthesis occurred in pericentral hepatocytes.35–38 In the case of albumin, the expression levels are higher in periportal hepatocytes and decreased towards pericentral hepatocytes.39 This differential expression pattern of albumin could explain the absence of complete COX10 recombination in hepatocytes as Cre recombinase expression was driven by an albumin promoter. However, it is difficult to explain why this subpopulation of cells did not have both floxed alleles deleted.
In conclusion, our results showed that mammalian hepatocytes are able to survive for extended periods of time in the absence of OXPHOS, using glycolysis/glycogenolysis to sustain ATP production and, when energetic demands were not met, cell death ensued, eventually triggering liver regeneration. Our studies also imply that liver with OXPHOS defects can escape pathology by the genetic correction/suppression of a few hepatocytes.
Acknowledgments
We are grateful to Ana Gomez for the electron microscopy images and to Dr Sandra Bacman for help with liver biopsies. We also thank Drs Teresa Zimmers and Leonidas Koniaris for insightful discussions, and Dr Antoni Barrientos and Mr Hirokazu Fukui for critical comments on the manuscript. This work was supported by Public Health Service grants NS041777, CA085700 and EY10804.
References
- 1.Chinnery PF, DiMauro S. Mitochondrial hepatopathies. J Hepatol. 2005;43:207–9. doi: 10.1016/j.jhep.2005.05.012. [DOI] [PubMed] [Google Scholar]
- 2.Bandyopadhyay SK, Dutta A. Mitochondrial hepatopathies. J Assoc Physicians India. 2005;53:973–8. [PubMed] [Google Scholar]
- 3.Sokol RJ, Treem WR. Mitochondria and childhood liver diseases. J Pediatr Gastroenterol Nutr. 1999;28:4–16. doi: 10.1097/00005176-199901000-00005. [DOI] [PubMed] [Google Scholar]
- 4.Anderson S, Bankier AT, Barrell BG, et al. Sequence and organization of the human mitochondrial genome. Nature. 1981;290:457–65. doi: 10.1038/290457a0. [DOI] [PubMed] [Google Scholar]
- 5.Tsukihara T, Aoyama H, Yamashita E, et al. The whole structure of the 13-subunit oxidized cytochrome c oxidase at 2.8 Å. Science. 1996;272:1136–44. doi: 10.1126/science.272.5265.1136. [DOI] [PubMed] [Google Scholar]
- 6.Tzagoloff A, Nobrega M, Gorman N, et al. On the functions of the yeast COX10 and COX11 gene products. Biochem Mol Biol Int. 1993;31:593–8. [PubMed] [Google Scholar]
- 7.Barros MH, Tzagoloff A. Regulation of the heme A biosynthetic pathway in Saccharomyces cerevisiae. FEBS Lett. 2002;516:119–23. doi: 10.1016/s0014-5793(02)02514-0. [DOI] [PubMed] [Google Scholar]
- 8.Diaz F, Thomas CK, Garcia S, et al. Mice lacking COX10 in skeletal muscle recapitulate the phenotype of progressive mitochondrial myopathies associated with cytochrome c oxidase deficiency. Hum Mol Genet. 2005;14:2737–48. doi: 10.1093/hmg/ddi307. [DOI] [PMC free article] [PubMed] [Google Scholar]
- 9.Postic C, Shiota M, Niswender KD, et al. Dual roles for glucokinase in glucose homeostasis as determined by liver and pancreatic beta cell-specific gene knock-outs using Cre recombinase. J Biol Chem. 1999;274:305–15. doi: 10.1074/jbc.274.1.305. [DOI] [PubMed] [Google Scholar]
- 10.Sciacco M, Bonilla E. Cytochemistry and immunocytochemistry of mitochondria in tissue sections. Methods Enzymol. 1996;264:509–21. doi: 10.1016/s0076-6879(96)64045-2. [DOI] [PubMed] [Google Scholar]
- 11.Miller DL, Dougherty MM, Decker SJ, et al. Ultrastructure of the spermatozoa from a Florida manatee (Trichechus manatus latirostris) Anat Histol Embryol. 2001;30:253–6. doi: 10.1046/j.1439-0264.2001.00330.x. [DOI] [PubMed] [Google Scholar]
- 12.Barrientos A. In vivo and in organello assessment of OXPHOS activities. Methods. 2002;26:307–16. doi: 10.1016/S1046-2023(02)00036-1. [DOI] [PubMed] [Google Scholar]
- 13.Bradford MM. A rapid and sensitive method for the quantitation of microgram quantities of protein utilizing the principle of protein–dye binding. Anal Biochem. 1976;72:248–54. doi: 10.1016/0003-2697(76)90527-3. [DOI] [PubMed] [Google Scholar]
- 14.Kemp A, Van Heijningen AJ. A colorimetric micro-method for the determination of glycogen in tissues. Biochem J. 1954;56:646–8. doi: 10.1042/bj0560646. [DOI] [PMC free article] [PubMed] [Google Scholar]
- 15.Bailly-Maitre B, Bard-Chapeau E, Luciano F, et al. Mice lacking bi-1 gene show accelerated liver regeneration. Cancer Res. 2007;67:1442–50. doi: 10.1158/0008-5472.CAN-06-0850. [DOI] [PubMed] [Google Scholar]
- 16.Vives-Bauza C, Yang L, Manfredi G. Assay of Mitochondrial ATP synthesis in animal cells and tissues methods in cell biology. In: Pon LA, Schon EA, editors. Mitochondria. 2. Vol. 80. Academic Press; 2007. pp. 155–71. [DOI] [PubMed] [Google Scholar]
- 17.Leifeld L, Fink K, Debska G, et al. Anti-apoptotic function of gelsolin in fas antibody-induced liver failure in vivo. Am J Pathol. 2006;168:778–85. doi: 10.2353/ajpath.2006.050323. [DOI] [PMC free article] [PubMed] [Google Scholar]
- 18.Hogan JC, Stephens JM. Effects of leukemia inhibitory factor on 3T3-L1 adipocytes. J Endocrinol. 2005;185:485–96. doi: 10.1677/joe.1.05980. [DOI] [PubMed] [Google Scholar]
- 19.Rudnick DA, Liao Y, An JK, et al. Analyses of hepatocellular proliferation in a mouse model of alpha-1-antitrypsin deficiency. Hepatology. 2004;39:1048–55. doi: 10.1002/hep.20118. [DOI] [PubMed] [Google Scholar]
- 20.Garcia Urena MA, Colina Ruiz-Delgado F, Moreno Gonzalez E, et al. Hepatic steatosis in liver transplant donors: common feature of donor population? World J Surg. 1998;22:837–44. doi: 10.1007/s002689900479. [DOI] [PubMed] [Google Scholar]
- 21.Cormier-Daire V, Chretien D, Rustin P, et al. Neonatal and delayed-onset liver involvement in disorders of oxidative phosphorylation. J Pediatr. 1997;130:817–22. doi: 10.1016/s0022-3476(97)80027-3. [DOI] [PubMed] [Google Scholar]
- 22.Kokoszka JE, Waymire KG, Levy SE, et al. The ADP/ATP translocator is not essential for the mitochondrial permeability transition pore. Nature. 2004;427:461–5. doi: 10.1038/nature02229. [DOI] [PMC free article] [PubMed] [Google Scholar]
- 23.Gores GJ, Nieminen AL, Fleishman KE, et al. Extracellular acidosis delays onset of cell death in ATP-depleted hepatocytes. Am J Physiol. 1988;255:C315–22. doi: 10.1152/ajpcell.1988.255.3.C315. [DOI] [PubMed] [Google Scholar]
- 24.Redegeld FA, Moison RM, Koster AS, et al. Depletion of ATP but not of GSH affects viability of rat hepatocytes. Eur J Pharmacol. 1992;228:229–36. doi: 10.1016/0926-6917(92)90034-a. [DOI] [PubMed] [Google Scholar]
- 25.Nieminen AL, Saylor AK, Herman B, et al. ATP depletion rather than mitochondrial depolarization mediates hepatocyte killing after metabolic inhibition. Am J Physiol. 1994;267:C67–74. doi: 10.1152/ajpcell.1994.267.1.C67. [DOI] [PubMed] [Google Scholar]
- 26.Anundi I, de Groot H. Hypoxic liver cell death: critical Po2 and dependence of viability on glycolysis. Am J Physiol. 1989;257:G58–64. doi: 10.1152/ajpgi.1989.257.1.G58. [DOI] [PubMed] [Google Scholar]
- 27.Shiroyama K, Moriwaki K, Kusunoki S, et al. Glucose loading during primary culture has opposite effects on the viability of hepatocytes exposed to potassium cyanide and to iodoacetic acid. Metabolism. 2001;50:342–8. doi: 10.1053/meta.2001.20204. [DOI] [PubMed] [Google Scholar]
- 28.Hansson A, Hance N, Dufour E, et al. A switch in metabolism precedes increased mitochondrial biogenesis in respiratory chain-deficient mouse hearts. Proc Natl Acad Sci USA. 2004;101:3136–41. doi: 10.1073/pnas.0308710100. [DOI] [PMC free article] [PubMed] [Google Scholar]
- 29.Jia Y, Qi C, Kashireddi P, et al. Transcription coactivator PBP, the peroxisome proliferator-activated receptor (PPAR)-binding protein, is required for PPARalpha-regulated gene expression in liver. J Biol Chem. 2004;279:24427–34. doi: 10.1074/jbc.M402391200. [DOI] [PubMed] [Google Scholar]
- 30.Dirkx R, Vanhorebeek I, Martens K, et al. Absence of peroxisomes in mouse hepatocytes causes mitochondrial and ER abnormalities. Hepatology. 2005;41:868–78. doi: 10.1002/hep.20628. [DOI] [PubMed] [Google Scholar]
- 31.Postic C, Magnuson MA. DNA excision in liver by an albumin–Cre transgene occurs progressively with age. Genesis. 2000;26:149–50. doi: 10.1002/(sici)1526-968x(200002)26:2<149::aid-gene16>3.0.co;2-v. [DOI] [PubMed] [Google Scholar]
- 32.Conzelmann LO, Hines IN, Kremer M, et al. Extrahepatic cells contribute to the progenitor/stem cell response following reduced-size liver transplantation in mice. Exp Biol Med (Maywood) 2007;232:571–80. [PubMed] [Google Scholar]
- 33.Terada N, Hamazaki T, Oka M, et al. Bone marrow cells adopt the phenotype of other cells by spontaneous cell fusion. Nature. 2002;416:542–5. doi: 10.1038/nature730. [DOI] [PubMed] [Google Scholar]
- 34.Wang X, Willenbring H, Akkari Y, et al. Cell fusion is the principal source of bone-marrow-derived hepatocytes. Nature. 2003;422:897–901. doi: 10.1038/nature01531. [DOI] [PubMed] [Google Scholar]
- 35.Haussinger D, Lamers WH, Moorman AF. Hepatocyte heterogeneity in the metabolism of amino acids and ammonia. Enzyme. 1992;46:72–93. doi: 10.1159/000468779. [DOI] [PubMed] [Google Scholar]
- 36.Hayhurst GP, Lee YH, Lambert G, et al. Hepatocyte nuclear factor 4alpha (nuclear receptor 2A1) is essential for maintenance of hepatic gene expression and lipid homeostasis. Mol Cell Biol. 2001;21:1393–403. doi: 10.1128/MCB.21.4.1393-1403.2001. [DOI] [PMC free article] [PubMed] [Google Scholar]
- 37.Inoue Y, Hayhurst GP, Inoue J, et al. Defective ureagenesis in mice carrying a liver-specific disruption of hepatocyte nuclear factor 4alpha (HNF4alpha). HNF4alpha regulates ornithine transcarbamylase in vivo. J Biol Chem. 2002;277:25257–65. doi: 10.1074/jbc.M203126200. [DOI] [PubMed] [Google Scholar]
- 38.Stanulovic VS, Kyrmizi I, Kruithof-de Julio M, et al. Hepatic HNF4alpha deficiency induces periportal expression of glutamine synthetase and other pericentral enzymes. Hepatology. 2007;45:433–44. doi: 10.1002/hep.21456. [DOI] [PubMed] [Google Scholar]
- 39.Pilling AM, Endersby-Wood HJ, Jones SA, Williams TC. In situ hybridization demonstration of albumin mRNA in B6C3F1 murine liver and hepatocellular neoplasms. Vet Pathol. 1997;34:585–91. doi: 10.1177/030098589703400606. [DOI] [PubMed] [Google Scholar]


