Abstract
In the present study, we investigate the effect of wall flexibility on the plug propagation and the resulting wall stresses in small airway models with experimental measurements and numerical simulations. Experimentally, a flexible microchannel was fabricated to mimic the flexible small airways using soft lithography. Liquid plugs were generated and propagated through the microchannels. The local wall deformation is observed instantaneously during plug propagation with the maximum increasing with plug speed. The pressure drop across the plug is measured and observed to increase with plug speed, and is slightly smaller in a flexible channel compared to that in a rigid channel. A computational model is then presented to model the steady plug propagation through a flexible channel corresponding to the middle plane in the experimental device. The results show qualitative agreements with experiments on wall shapes and pressure drops and the discrepancies bring up interesting questions on current field of modeling. The flexible wall deforms inward near the plug core region, the deformation and pressure drop across the plug increase with the plug speed. The wall deformation and resulting stresses vary with different longitudinal tensions, i.e., for large wall longitudinal tension, the wall deforms slightly, which causes decreased fluid stress and stress gradients on the flexible wall comparing to that on rigid walls; however, the wall stress gradients are found to be much larger on highly deformable walls with small longitudinal tensions. Therefore, in diseases such as emphysema, with more deformable airways, there is a high possibility of induced injuries on lining cells along the airways because of larger wall stresses and stress gradients.
INTRODUCTION
The lung consists of a branching network of flexible airways that conduct the air and exchange gas between the alveoli and the pulmonary capillaries. The airway walls are lined by a thin liquid layer, which may cause the closing off of small airways either in healthy lungs near the end of expiration at low lung volumes1, 2 or in diseased lungs such as emphysema,3 infant and adult respiratory distress syndrome (RDS),4, 5 and cystic fibrosis.6, 7 Closure can occur due to plug formation as a result of surface tension,8, 9, 10 or by airway wall collapse.11, 12 After the liquid plug forms, it propagates and may finally rupture to reopen the airways during the next breathing cycle. The propagation and rupture of the liquid plug can cause damage to the lining epithelial cells by the mechanical stresses associated with the two-phase interfacial flow.13, 14 The process of these airway closure and reopening systems is therefore of fundamental importance and physiological significance.
In addition, external liquid plugs can be instilled into the lungs15, 16, 17 to treat diseases such as RDS and cystic fibrosis. For example, premature infants lack significant amount of surfactant and require external surfactant delivery. They tend to have very stiff lungs with low compliance and develop RDS, which is the fourth leading cause of death for the premature infants in the United States.18 Surfactant replacement therapy has been clinically successful in treating infant RDS. Drug delivery into the lung has been studied for treating diseases such as cystic fibrosis or other genetic diseases.15 These are situations where externally instilled liquid plugs form and are transported through the flexible airway networks. Plug propagation in airway branches, distribution in the lung, and resulting wall stresses may affect therapeutic efficiency and may even cause additional lung injury. It is thus of great importance to understand the mechanisms of liquid plug propagation.
Efforts have been made to understand the mechanical process of airway closure and reopening systems. When long sections of airways are closed, the reopening process can be simulated as the penetration of a semi-infinite bubble finger, which inflate the closed airway branches and peel apart the opposed walls.12, 19, 20 The propagation of an air finger through an initially flooded and collapsed tube∕channel has been investigated experimentally21, 22, 23, 24 and theoretically.25, 26, 27, 28 The opening pressure and bubble speed have been studied during this process with respect to different tube elasticity and collapsing levels. When short plugs form and block the lung airways, the propagation and final rupture of the liquid plugs reopens the lung airways. Howell et al.29 investigated the dependence of the pressure drop across the plug and film thickness on the plug speed and tube wall elasticity. They found a critical pressure above which a plug ruptures and reopens an airway.
The interactions between the airway fluid and deformed airway walls can be physiologically significant.30, 31 Airway closure may reduce gas exchange and induce hypoxia in local regions. At the cellular level, the reopening process may result in injury due to high fluid stresses on the lining lung epithelial cells13, 14, 32 from the two-phase interfacial flow as well as damage to the surrounding alveolar tissue due to collapsed wall stretching.33, 34 The large stress gradients from the fluid flow were hypothesized to be responsible for cellular injury during the airway reopening process. Normal lung stretching has been found to be helpful on the lung epithelial cell growth and differentiation;35 however, stress stimulation at above normal levels may destabilize the pulmonary airways and affect surfactant sorption, the blood-gas barrier,36, 37 the transport of fluid and ion,38, 39 as well as protein synthesis.40, 41
Previous theoretical studies have suggested that liquid plug or air bubble propagation during the airway reopening process can generate fluid mechanical stresses, i.e., the normal and shear stresses on the wall, beyond physiological normal values,25, 28, 42, 43, 44, 45 which might cause cell damage and possible tissue damage as well. In this paper, we study liquid plug propagation in flexible microchannels, with microengineered experiments and corresponding numerical simulations. We show the collapsing of a flexible channel during plug propagation and investigate the induced changes in the fluid flow and wall stresses. Our study reveals the possible causes of lung epithelial cell injury along the flexible pulmonary airways, especially during the airway reopening process in diseases such as emphysema.
The experimental methods for the plug propagating through a microengineered flexible channel are described in Sec. 2 and the experimental results are shown in Sec. 3. Section 4 formulates the theoretical model and Sec. 5 states the numerical methods for the steady plug propagation through the flexible channels. Section 6 shows the theoretical results and Sec. 7 discusses the comparisons of the numerical solutions with the experimental data. Finally Sec. 8 concludes the paper.
EXPERIMENTAL METHODS
Microchannel fabrication
The microfluidic channels were fabricated using soft lithography.46 Polydimethylsiloxane (PDMS) (Slygard 184; Dow Corning, MI) prepolymer was mixed with curing agent at a weight ratio of 10:1. The mixture was then cast onto a 4 in. silicon wafer with 100 μm thick positive relief patterns of SU-8, and cured at 60 °C in an oven overnight. The cured PDMS layer was peeled from the silicon wafer. Holes of 2 mm diameter were punched through the cured PDMS substrates as reservoirs. To fabricate a very thin membrane of PDMS [thickness ∼O(5 μm)], PDMS and toluene were mixed at 1:1 mass ratio and spin coated on a silanized clean glass cover slide at 1800 rpm for 90 s to generate a thin layer. This PDMS thin layer covered glass slide was then cured at 120 °C for 1 h and converted to a plain PDMS thin membrane with thickness t*=7 μm, which is approximately the wall thickness of the distal airways in human lungs.47 The cured thin membrane and channel layer were sealed against each other using a plasma oxidizer (11005-plasma Prep II, SPI).46 This assured the entire channel to have the same surface properties and be hydrophilic. PDMS with 10:1 curing ratios has Young’s modulus around 0.7 MPa and a Poisson ratio of about 0.5,48, 49, 50 which is similar to the elastic properties of the connective tissue network in normal lungs. The elastin in the lungs has Young’s modulus in the order of 0.5–5 MPa.51 The average Young’s modulus of a single alveolar wall has been estimated to be around 300 kPa.52
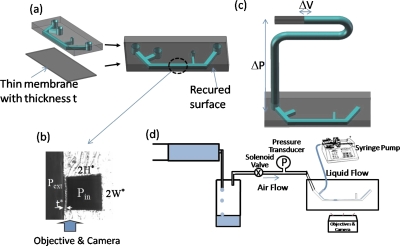
The fabricated channel has to be vertically flipped 90° so that the thin membrane is shown as a sidewall and its deformation from the pressure difference across the membrane can be well observed under an inverted microscope. The sealed PDMS channel structure is cut with a razor blade along the axial direction close to one channel wall; then the rough cutting side is cured with PDMS again by a vertical level to obtain the optical clarity. The schematic of the microchannel is shown in Fig. 1a and the cross section is shown in Fig. 1b. The channel has height 2H* and width 2W*, with H* being the channel half height, and the thin membrane has thickness t*. When Pext>(<)Pin, the membrane deforms inward (outward).
Figure 1.
(a) Schematic of microchannels sealed with thin membrane with liquid plugs moving in the main channel. (b) Cross sectional image of the microchannel. Pext and Pin are the pressure outside and inside the channel, t* is the flexible wall thickness, and 2H* and 2W* are the height and width of the channel. (c) Schematic of compliance measurement (i.e., pressure-volume relationship). ΔP is the pressure drop imposed in the target channel and ΔV is the corresponding volume change. (d) Schematic of the experimental setup on the plug generation and propagation.
Compliance measurement
To justify the use of the microchannel as an in vitro model of the lung airways, the channel compliance is measured. Two types of channels were fabricated: One was the replica of PDMS microchannel sealed with a glass slide as a control and the other was the PDMS microchannel replica sealed with the thin PDMS membrane. De-ionized water with dye was used for the measurement of the compliance. The channel outlet was sealed with permanent glue. The inlet was connected to a U-shaped microchannel with a length marker via an 0.8 mm id silicone tubing (Fisher Scientific) filled with dye water, as shown in Fig. 1c. The pressure of the target microchannel was adjusted by changing the height difference with the U-shaped marker channel. When the transmural pressure increases or decreases, the thin membrane deforms and the water volume increases or decreases in the target microchannel. The volume change is measured by readout of the interface marker in the U channel and the pressure-volume relationship is generated, which reveals the compliance of the target microchannels.
Liquid materials and plug visualization
The liquid material used was a mixture of de-ionized water and fluorescent particles (Duke Scientific) at a concentration around 0.1%–0.3%, which could be excited by green light at 542 nm and emit red light at 612 nm. The liquid plug was generated and propagated through the channel with the setup shown in Fig. 1d. A constant air flow was generated from the gravity pump and a constant flow of liquid was driven by the syringe pump. A solenoid valve was used to control the air flow for generating plugs. When the air flow was blocked, a liquid plug was generated and a second plug was produced after the previous one is propagated out of the channel. The duration of zero air flow determined the plug length and the air pressure determined the plug speed. The flexible wall deformation and differential pressure between the rear gas phase of the plug and the outlet atmosphere pressure were measured for different plug speeds, characterized by the capillary number Ca=μ*U∕σ*. A charge coupled device camera (CoolSnap EZ, Photometrics) connected to an inverted fluorescent microscope (TE-2000, Nikon, Tokyo, Japan) and METAMORPH software were used to record the plug motion and wall deformation.
EXPERIMENTAL RESULTS
Channel compliance
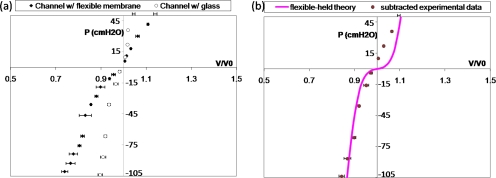
Figure 2a shows the pressure-volume measurements for the PDMS microchannels sealed with the PDMS thin membrane, called the flexible channel, and with a glass slide, called the rigid channel as the control sample. For the rigid channel, there is a slight volume increase (or decrease) with increasing (or decreasing) transmural pressure, which is due to the elasticity of the PDMS polymer. Under the same pressure, the flexible channel yields a larger volume change than the rigid one, which is due to the deformation of the thin PDMS membrane. By subtracting these two curves, we can get the pressure-volume relationship solely from the deformation of the thin flexible PDMS membrane, as shown in Fig. 2b. When the transmural pressure is positive, meaning that the outer pressure is smaller than the inner pressure in the channel, the membrane expands outward and the channel volume increases. When the transmural pressure is negative, meaning that the outer pressure is larger than the inner pressure, the membrane deforms inward and the channel volume decreases. We are particularly interested in the negative transmural pressure region because of the induced large negative wall pressure near the plug core during the steady plug propagation.42, 53
Figure 2.
(a) Pressure P(cm H2O) vs dimensionless volume V∕V0 for microchannels with flexible membrane and with glass slide. The empty (filled) symbols with error bars in volume are for the rigid (flexible) channel. (b) P vs V∕V0 from the deformation of the thin membrane by subtracting the two data sets in (a), as shown in symbols and comparison with the large deflection theory in the line curve.
A large deflection theory on a clamped thin wall plate was used to calculate the compliance of our PDMS microchannel from the flexible membrane deformation using Von-Karman’s equations.54, 55, 56, 57, 58 The channel has a height and a width of 100 μm, and a length of 4 cm. The membrane has a thickness of 7 μm with Young’s modulus 0.7 MPa and a Poisson ratio of 0.5.48, 49, 50 Hence, the membrane deformation can be calculated and the resulting volume changes are plotted against different pressure loads, as the line curve in Fig. 2b. The analyses show good agreement with our measurements when the pressure is negative. When pressure is positive, poor agreement may be caused by the different elastic behaviors of PDMS during expansion. Since the negative pressure ranges are of interest, the variation of PDMS properties during expansion and compression is not expected to affect our analysis.
The average compliance is defined as C=Δ(V∕V0)∕ΔP. From Fig. 2, we can calculate the average compliance of the flexible channel C to be around 0.005 cm H2O−1 when the pressure is in the range of −100–0 cm H2O. For the human bronchioles, it has been shown that the average in vivo compliance is slightly larger than our results, ∼O(0.01) cm H2O−1 for pressure ranging from −40 to 0 cm H2O.47 Since our microchannel only has one flexible wall, the compliance of the channel is expected to be reasonable and able to show the deforming properties of the actual human airways.
Wall deformation from plug propagation
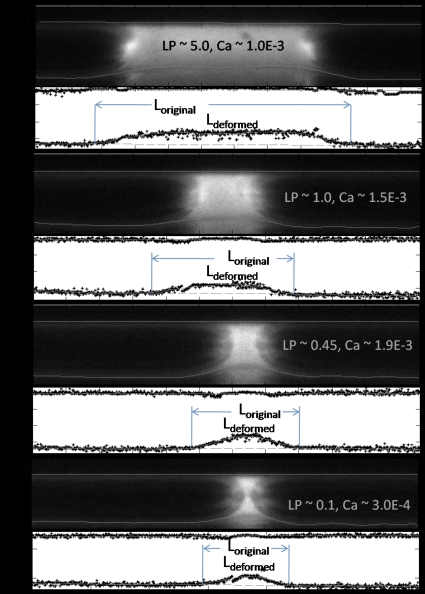
Figure 3 shows selected fluorescence images of the liquid plug propagation at different plug lengths and speeds in the flexible microchannel with the upper wall being rigid and the lower wall being the flexible membrane. The images are taken near the middle plane where the wall deforms the most. The wall deformation is clearly observed with the fluorescence intensity changes, with the intensity being smaller in the deformed regions. Due to the light scattering, there are some mirror images visible below the deformed wall, which do not affect the analysis. When the plug propagates from left to the right, the flexible membrane deforms inward and is sucked near the plug core region. The deformed wall regions are found to propagate along with the plug propagation and the plug interface appears to be asymmetric due to the flexible wall deformation.
Figure 3.
Selected images of plug propagation in a microchannel with a rigid upper wall and a flexible lower wall with extracted wall positions for different plug lengths and plug speeds. The lines on top of the image are the extracted wall shapes with the top one being the rigid wall, and the bottom one being the flexible wall. The lower figure in each image is the quantitative extraction and polynomial fitting of the wall position. The wall deformation is larger for longer plug with larger speed and is measured to be (a) 12.7 μm, (b) 9.4 μm, (c) 9.8 μm, (d) 11.1 μm, and (e) 7.8 μm.
We then extracted wall positions quantitatively with imaging analysis during plug propagation, as shown in bottom images in Figs. 3a, 3b, 3c, 3d with plug speed characterized by the capillary number Ca=μ*U*∕σ*. The symbols are the discrete extraction of wall position and the lines are the fitted wall position. For the upper rigid wall, the wall position is found where the pixel intensity is above a threshold of 16, with white being 255 and black being 1, but below the maximum intensity along each vertical column in the upper half domain. For the flexible wall, along the precursor and trailing films, the wall positions are found similarly as for the rigid wall. While near the plug core region, the local minimum intensity position near the deformed region is found, from where, toward the upper rigid wall, an intensity threshold is applied to get the deformed wall position with the largest difference in intensity. The top lines are the linear fit of the rigid wall positions, and the bottom lines are the tenth order polynomial fit of the deformed wall positions. The original wall positions are determined by connecting the two end films near the flexible wall, and the wall deformation is obtained from the height difference of the deformed and original wall positions.
The maximum wall deformation varies with plug speed and length. For a plug length around five times the half channel height, i.e., LP=5.0, and Ca around 1.0×10⁻³, the maximum wall deformation ζ*max is measured to be 12.7 μm, as shown in Fig. 4a. For the other cases shown in Fig. 3, the maximum deformation is calculated to be (b) 9.4 μm, (c) 11.1 μm, and (d) 7.8 μm. The average strains on the flexible wall, defined as the ratio of the wall elongation to the original wall length, are calculated to be around 1% for all the cases. Here the wall elongation is the difference in the deformed wall arc length and the original flat length indicated as Ldeformed and Loriginal indicated in Fig. 3. More quantitative studies and comparisons with simulations are presented in Sec. 7.
Figure 4.
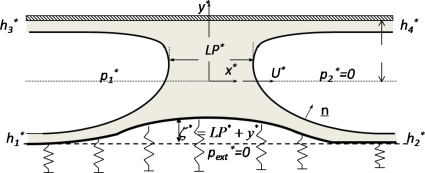
Schematic of the model system of a liquid plug of length LP* driven by a pressure drop through a planar fluid-filled channel with a upper rigid wall located at y*=LP* and a lower flexible wall located at y*=ζ*−LP*. The wall deformation ζ*>(<)0 when the wall deforms inward (outward). Here is the unit normal vector to the interface, , , , and are the far end film thickness, and U* is the plug tip speed during its steady propagation. The front gas pressure is set to be 0 as the reference pressure as well as the external pressure .
To understand the mechanisms of the wall deformation and pressure drop during the steady plug propagation, we built a computational model and numerically simulated the steady plug propagation in an asymmetric flexible channel corresponding to the experimental setup in Secs. 5, 6, 7 and compared the results with the experiments in Sec. 7.
THEORETICAL FORMULATION
Figure 4 illustrates a liquid plug propagating with steady speed U*, driven by the pressure drop through a two-dimensional (2D) channel. The fluid has a Newtonian viscosity μ* and constant density ρ*. The surface tension σ* is assumed to be uniform. The top channel wall is rigid and the bottom one is simulated as a membranelike wall with constant longitudinal tension TL* and supported by nonlinear springs. Far ahead of the plug, the channel has a width of 2H* and the springs are unstressed. Far behind the plug, the springs are slightly compressed due to the positive pressure p1* and uniform liquid films on each of the channel walls with thickness h1* on the lower flexible wall and thickness h3* on the top rigid wall. The precursor films along the lower flexible and tip rigid walls have thicknesses of h2* and , respectively.
The parameters are nondimensionalized as follows: (x,y) are scaled on half channel width H*, the pressure on the viscous force scale μ*U*∕H*, and the velocity is scaled on U*. The frame of reference is fixed with the plug tip. In the experiments where the steady liquid plug flows through a microchannel, the fluid inertia is negligible. Therefore, the governing equations for the fluid motion in scaled form are the Stokes and continuity equations,
| (1) |
Along the interfaces, the dimensionless interfacial stress conditions are given by
| (2) |
where is the interface inward-facing normal direction, the capillary number Ca=μU*∕σ is the dimensionless plug tip velocity in the laboratory frame, and represents the ratio of the viscous force to the surface tension force; is the interfacial surface curvature, where is the surface divergence vector. At both air-liquid interfaces, the kinematic boundary conditions for the steady state are in the frame of reference with the plug tip.
As noted in the experiments, the flexible membrane is very thin compared to the channel height, and so the wall damping and inertia are negligible. Therefore, the lower flexible wall is assumed to be massless. The wall deflections in the x direction are much smaller than that in the y direction in the long wavelength limit.59 Therefore, we only consider normal forces acting on the liquid wall interfaces. The equation of normal forces balancing fluid normal stress at the flexible wall with the spring forces and wall tension, as discussed in Refs. 25, 45, is given by
| (3) |
where TL=TL*∕σ is the dimensionless longitudinal tension of the lower flexible wall, is the curvature of the lower flexible wall, ζ(x)=1+y represents the lower wall deformation with the undeformed condition defined as ζ(x)=0, and f(ζ) represents the nonlinear spring force, which is obtained by curve fitting the pressure-deformation relationship of the flexible channel from the P-V measurements shown in Fig. 2. A cubic spring function is obtained with the formula f(ζ)=Aζ3+Bζ where A=76.8 and B=0.13. The right hand side of Eq. 3 can be calculated from the fluid stresses,
| (4) |
The normal stress Πw and shear stress τw on the wall from the fluid, which is scaled with the surface tension, are defined as follows:
| (5) |
In the plug tip frame of reference, the no-slip condition on the walls is
| (6) |
where is the tangential vector along the wall, on the top rigid wall, and on the bottom flexible wall.
For all the end films, the fully developed conditions are applied for the fluid velocity. At steady state, the mass leaving the front is the same as that coming into the rear at each wall, which is simplified as h2=h1 and h4=h3. The pressure in the precursor films is equal to the front gas pressure (p2=0) and in the trailing films it is equal to the rear gas pressure p1, as a part of solution.
In the lungs, the airway geometry varies with generation number and the properties of the liquid layer can also be affected by diseases and the rheological properties of the liquids. The numerical simulations are performed based on the parameters in the experiments stated in Secs. 2, 3 with H*≈O(100 μm), ρ*≈1 g∕cm3, μ*≈O(0.1 P), σ*≈O(50 dyn∕cm), and the liquid speed is estimated to be O(1 cm∕s), Thus Ca∼O(10−3) and Re∼O(0.1).
NUMERICAL METHODS
The curvilinear computational grid was generated by solving 2D Poisson’s equation.60 The SIMPLER algorithm61 is used to solve momentum and pressure equations. Details of the algorithm are given in Refs. 42, 53. In this study, the wall equation is solved using Newton’s method. The wall position is updated at each iteration and a cubic spline62 is used to approximate the wall shape as a function of the arc length.
The wall Eq. 3 is discretized using the finite difference method, and the discretized equations can be rewritten as follows:
| (7) |
where L=[1+(d1eζe+d1pζp+d1wζw)2]1∕2 and is at the grid point, and e and w are two neighboring grid points to p. The coefficients di(i=1e,1p,1w;2e,2p,2w) are evaluated by the upwind and central differencing schemes.
At each iteration, after the momentum and pressure equations have been solved, the flexible wall shape is updated by an amount , which is solved numerically by solving
| (8) |
where JNewton=∂Ψ∕∂ζ is the Jacobian.
The bottom flexible wall is then corrected by , and this correction is performed with each iteration after the velocity and pressure fields have been obtained and the plug interfaces have been updated. The solution is obtained when the following criteria are satisfied: , , and (here N is the iteration step).
THEORETICAL RESULTS
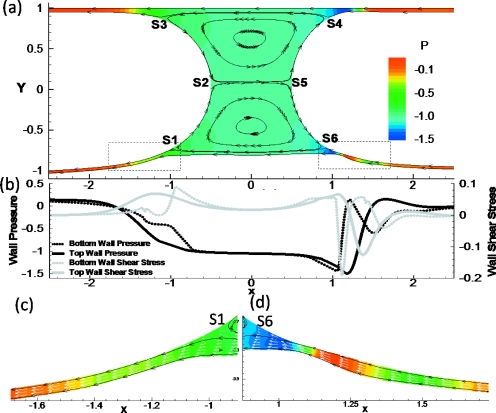
In this section, the pressure P, normal (Πw), and shear (τw) stresses are all rescaled with surface tension force for convenience and comparisons. Figure 5a shows the stream lines and pressure fields of steady plug propagation in a 2D channel with a rigid top wall and a flexible bottom wall. In this simulation, Ca=0.01, TL=0.5, and LP=1. Two major flow regions can be observed similar to the rigid case:53 film flows near the walls from the precursor films to the trailing films; and plug core recirculation flows. Two stagnation points S2 and S5 at the interface tips separate the upper and lower recirculation regions. The wall is deformed inward near the plug core, which suggests that the negative pressure near the plug core region deflects the wall inward. The recirculation center in the lower half domain moves toward the center, located at y=−0.455, while the upper one is located at y=0.623. The stagnation points S1 and S6 separate the wall layer flow and the core recirculation in the lower half domain and they move up toward the center as well, with S1 at x=−0.94, y=−0.705 and S6 at x=0.89, y=−0.69. S3 and S4 separate the film flow from the core flow in the upper half domain with S3 at x=−1.07, y=0.85 and S4 at x=0.92, y=0.853.
Figure 5.
(a) The streamlines (black solid lines) and pressure fields (color contour) in a 2D channel with rigid top wall and flexible bottom wall for Ca=0.01, TL=0.5, and LP=1. (b) Pressure and shear stresses along top rigid and bottom flexible walls. Magnification of films in the (c) rear and (d) front transition regions near the flexible wall. The white arrows are velocity vectors. S1–S6 are stagnation points along the interfaces for the liquid plug flow.
With this parameter set, a capillary wave exists on the front interface near the upper rigid wall where the plug core is connected to the upper precursor film. However, the wave disappears along the front interface but exists on the film near the bottom transition region. The zoomed film near the bottom front transition region is shown in Fig. 5d. The front interface extends monotonically to the far-ahead film near the bottom flexible wall. In the lower front transition region, however, minimum film thickness still occurs due to the deflection of the flexible wall. The largest bottom wall deformation occurs in the front transition region. The fluid pressure there shows a strong variation due to the change in the film thickness. The pressure is highly negative where film is thinnest and increases toward the front end. In the rear transition region as shown in Fig. 5c, the film thickness decreases monotonically to the far-rear region, as well as the wall deformation and the rear interface position. As noted, the reference frame in on the plug tip, therefore, the velocity is negative. In Fig. 5d, the velocity vectors show that flow speed on the interface is larger than that on the flexible wall at the thinnest film region, causing a high negative shear stress. The opposite trend occurs toward the plug core, i.e., a high positive shear stress region, as shown in Fig. 5b. The rapid change in the shear stress results in a high shear stress gradient, which increases the risk of cell damage along the airways.
Effect of longitudinal tension TL
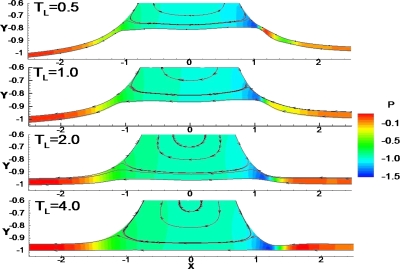
Figure 6 shows the effect of longitudinal tension TL on wall deformation and fluid flow near the flexible wall for Ca=0.01 and LP=1. The wall is more easily deformed and the film thickness is smaller in smaller value of TL. The maximum wall deformations are ζmax=0.203, 0.148, 0.042, and 0.001 for TL=0.5, 1, 2, and 4, respectively. The capillary wave disappears in the front transition region near the flexible wall when TL<2, and the location of the minimum film thickness moves toward the center. This is consistent with the analysis by Howell et al.,29 who found that the capillary wave diminished in amplitude in the front interface when the longitudinal tension was small or the wall was sufficiently compliant. When TL is large, e.g., TL≥4, the minimum film thickness, hmin, occurs because of the capillary wave along the interface, hmin=0.04 at x=1.347 at TL=4. However, when TL is small, hmin is due to the large wall deformation in the front transition region. For TL=0.5, hmin=0.028 at x=1.088, for TL=1.0, hmin=0.0365 at x=1.125, and for TL=2.0 and hmin=0.048 at x=1.241. The trailing film thickness is smaller near the flexible (h1) and the rigid walls (h3) for smaller TL: for TL=0.5, h1=0.0392, and h3=0.050 with the ratio h1∕h3=0.784; for TL=1, h1=0.0508, h3=0.0514, and h1∕h3=0.988; for TL=2, h1=0.055, h3=0.053, and h1∕h3=1.037; and for TL=4, h1=0.0536, h3=0.0535, and h1∕h3=1.0. Further downstream, there is no wall deflection since the air phase pressure is equal to the outside pressure.
Figure 6.
Streamline pattern (black solid lines) and pressure fields (color contour) in the plug near the flexible wall for different longitudinal tensions TL=0.5, 1.0, 2.0, and 4.0 with Ca=0.01 and LP=1.
Effect of plug speed and length
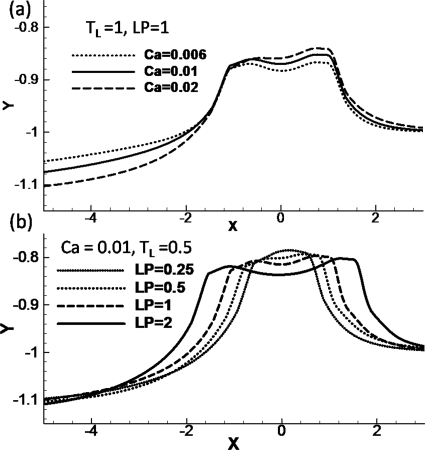
The numerically computed wall positions for different Ca are shown in Fig. 7a with LP=1 and TL=1.0. For the larger Ca, the wall deformation is larger both in the rear film and in the plug core region. At larger Ca, a larger pressure drop is needed to propagate the plug, which causes the wall to deform more from its original position. In Fig. 7b, we show the wall position for different plug lengths for Ca=0.01 and TL=0.5. The maximum wall deformation is similar for all four different plug lengths we investigated, being slightly higher for smaller LP: (ζmax,LP)=(0.216,0.25), (0.208, 0.5), (0.203, 1.0), and (0.198, 2.0). The wall at the trailing film near the flexible wall deforms more outwardly for larger LP with ζtrailing film=−0.111, −0.112, −0.115, and −0.125 for LP=0.25, 0.5, 1.0, and 2.0 respectively.
Figure 7.
(a) The flexible wall position for Ca=0.006, 0.01, and 0.02 with LP=1 and TL=1.0. (c) The flexible wall position for LP=0.25, 0.5, 1, and 2 with Ca=0.01 and TL=0.5. (d) The effect of plug length on the maximum wall deformation difference vs Ca.
Wall stress and stress gradients
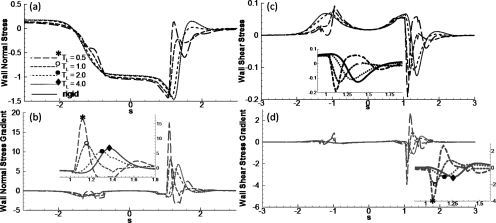
The dimensionless wall normal (Πw) and shear (τw) stresses induced by the plug flow, and their gradients [d(Πw)∕ds and d(τw)∕ds] are shown in Figs. 8a, 8b along the wall arc length s for Ca=0.01 and LP=1. Comparisons are made between the flexible wall and rigid wall cases, and the effect of varying TL is also investigated. Note that the curves for TL=4 almost overlap with those for the rigid wall cases. Here s=0 corresponds to x=0 and s=x for the rigid wall case.
Figure 8.
The effect of longitudinal tension TL on (a) normal stress, (b) normal stress gradient, (c) shear stress, and (d) shear stress gradient along the wall, where s is the arc length (s=0 corresponds to x=0) with Ca=0.01, LP=1, and Re=0.
In the trailing film region, the viscous lining has a uniform velocity. Therefore, the wall normal stress Πw is positive and equal to the rear air pressure, and the wall shear stress τw is zero. In the precursor film, the wall is stress free, and therefore, Πw∼τw∼0. Near the plug core region, Πw decreases due to the interfacial pressure drop and peaks in the front transition region. The stress and stress gradient curves almost overlap for TL=4 and on the rigid channel. When TL decreases to 2, the magnitudes of the stresses decrease slightly but both normal and shear stress gradients decrease by about 20% with d(Πw)∕ds=5.6 and d(τw)∕ds=0.43 for TL=2 while d(Πw)∕ds=6.8 and d(τw)∕ds=0.55 on the rigid channel wall. These results indicate that the wall stress and stress gradients are smaller when a liquid plug propagates through a slightly compliant airway as opposed to a rigid tube.
The lung airways have been studied to have different collapsibility by varying longitudinal tensions. Qualitative studies63, 64 have shown that extending the lungs caused the increase in longitudinal tension of lung airways, and then caused the decrease in collapsibility. Our results show that slightly increased collapsibility by decreasing longitudinal tension may result in an “optimal” airway condition so that the fluid stress from air-liquid interface on the wall is minimal.
However, in diseases such as emphysema, lung tissue is destroyed, correspondingly the tension TL is smaller than normal and the airway walls are easier to deform. Πw shows a stronger oscillation in the front transition region for smaller TL, i.e., TL=1.0 and 0.5, shown in Fig. 8a. This oscillation causes a much higher gradient of the normal stress near the transition regions along the flexible wall. The normal stress gradient d(Πw)∕ds has a peak magnitude of 17.4 for TL=0.5, which is more than double the gradient for TL=1.0, which has a value of d(Πw)∕ds=8.1, and is much larger than that on the rigid wall with d(Πw)∕ds=6.8. The wall shear stress τw increases in both front and rear transition regions. The peak locations shift toward the center for flexible walls. In the front transition region near the flexible wall, ∣τw∣max=0.191 at x=1.1 for TL=0.5, and ∣τw∣max=0.128 at x=1.14 for TL=1.0, while ∣τw∣max=0.125 at x=1.36 on the rigid wall shown in Fig. 8b. In the rear transition region, the local peak is higher for the flexible wall as compared to the rigid wall case. The narrow and deep peak of the shear stress in the front transition region causes very high shear stress gradients on the flexible wall. For TL=0.5, ∣d(τw)∕ds∣max=3.904 at x=1.04, which is much larger than the value of 1.1 on the rigid wall. The high peak values of the shear stress and the gradients may result in a higher risk of cell damage on the airways for being too compliant as compared to the rigid wall case.
DISCUSSIONS AND LIMITATIONS
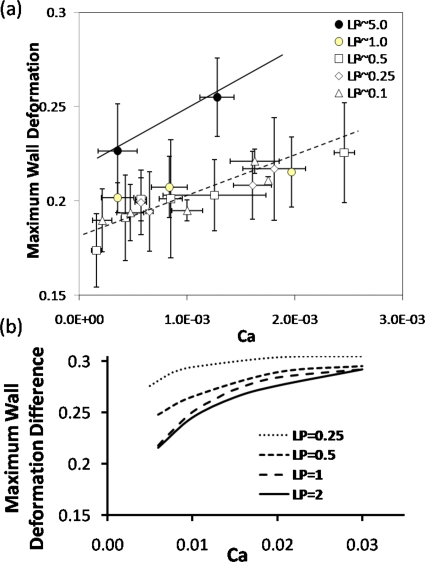
For better quantifying the wall deformation with respect to the plug length and speed, in Fig. 9a the maximum wall deformation ζmax measured from the experiments and scaled with the channel half height H is plotted versus Ca for different LP. Each data point is the average of three to five experimental sets and the error bars represent their standard deviations. Two linear lines were shown in Fig. 9a for LP=5.0 and LP≤1.0 to show the general trend: ζmax increases with increasing Ca in the range of 9.0×10⁻⁵<Ca<3.0×10⁻³ for 0.1≤LP≤5.0. When LP is very large, e.g., LP=5.0, the maximum wall deformation is slightly larger than that when LP≤1.0. No significant differences are found on the maximum wall deformation when LP decreases to the range of 0.1≤LP≤1.0.
Figure 9.
(a) The measured maximum wall deformation ζmax vs Ca for different plug lengths, LP=5.0, 1.0, 0.5, 0.25, and 0.1. The error bars in the x and y directions indicate the standard deviations of measurements of plug velocity and wall deformation of three to five experiment sets. (b) The simulated maximum wall deformation difference vs Ca for different plug length.
The maximum wall deformation is measured to be around 0.2, which is 20% of the channel half height for Ca∼O(10−3) and LP∼1. From the simulations, we calculated that the maximum wall deformation ζmax=0.203 for TL=0.5, Ca=0.01, and LP=1. Although it is hard to measure and quantify the longitudinal tension on the flexible membrane during the experiment, the degree of the wall deformation for TL=0.5 agrees with the experiments qualitatively.
The maximum wall deformation difference with respect to the wall deformation near the rear trailing films is then plotted against Ca for different LP in Fig. 9b. The deformation shows an increase with Ca in the range of Ca studied. The slope of the curve of wall deformation difference versus Ca shows larger for larger LP, which is consistent with the experiments. However, the simulations show a larger deformation difference for smaller LP<1, which is not observed in the experiments, but the wall deformation is very close for larger LP, i.e., LP=1 and 2. The discrepancy may come from several reasons: (1) plug length slightly changes during its propagation, therefore potential unsteady problems exist, which is not considered in our simulations, although the pressure real time data showed the plug enter a “steady state;” (2) in the experimental measurements, we try to look for the maximum deformation near the plug core instead of subtracting the wall deformation in the trailing film region as in simulated results; (3) the wall deformation measurement is very difficult for large plug propagation speed with current setup; (4) during the plug propagation in our experiments, it is very likely that the difference between both sides of gas pressure and the outside atmosphere are positive, therefore, positive deformation could occur on the walls not only in trailing film region as our mathematical model, but also in precursor region; (5) our mathematical model used a 2D study to mimic the middle plane deformation in the experimental model, which cause additional effects; (6) for very small Ca, we are unable to simulate the flow and resolve the wall deformation due to the thin film limit. A more sophisticated model might be useful to resolve the deviations between experiments and theory.
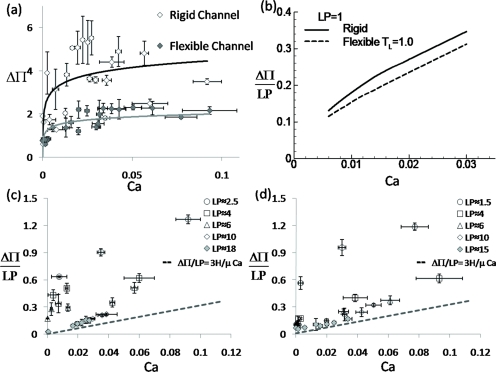
The pressure drop ΔΠ across the plug as a function of Ca for both experiments and theory is compared in Fig. 10. In the experiments, the differential pressure drop ΔΠ between the gas phase near the channel inlet and outlet is measured for different plug lengths and speeds, in which ΔΠ is scaled with the surface tension divided by the channel half height. Figure 10a shows ΔΠ increases with increasing Ca and is larger across a plug through a rigid channel than that through a flexible channel. To eliminate the viscous effects in the plug core, we dissected Fig. 10a to Figs. 10c, 10d, in which the macroscopic pressure drop ΔΠ∕LP versus Ca is shown for different LP during the plug propagation through the rigid channel [Fig. 10c] and the flexible channel [Fig. 10d].
Figure 10.
(a) The overall pressure drop ΔΠ vs Ca when the plug propagates through the rigid channel (◇) and the flexible channel (◆). Two lines are fitted curve to show the general trends for both cases. (b) The simulated pressure drop vs Ca for LP=1. The measured macroscopic pressure drop ΔΠ∕LP vs Ca for different plug length in (c) rigid and (d) flexible channels. (a) is the combination of (c) and (d). The error bars in the x and y directions are the standard deviations of the measured plug velocity and pressure drop across the plug with three to five experimental cases.
The macroscopic pressure drop ΔΠ∕LP increases with Ca for all L investigated. When LP>10, the curves of ΔΠ∕LP versus Ca collapse to one, which implies that the viscous dissipation in the plug core dominates the pressure drop. As the viscous dissipation increases with increasing LP−>∞, ΔΠ∕LP approaches fully developed flow limit, which is shown with the dashed line in Figs. 10c, 10d. When LP decreases, ΔΠ∕LP increases for a fixed plug speed and its slope increases with Ca, which implies that the pressure jump across both plug interfaces dominates. Comparing the rigid and flexible channels, when LP is long enough (>10), the collapsed curves of ΔΠ∕LP versus Ca show no significant difference. Again, the viscous dissipation dominates and the reduced plug volume due to the flexible wall deformation is a relatively small portion of the plug core volume and has little effect on the pressure drop. When LP is smaller, the pressure drop across the plug through the rigid channel is higher than that through the flexible channel for the same plug speed and length.
Note that the measured pressure drop is expected to be higher than the actual pressure drop across the plug due to the pressure loss in the connecting tubing from the location of the differential pressure transducer to the inlet and outlet. The simulated results [Fig. 10b] show qualitative agreement with the experiments [Figs. 10c, 10d] that ΔΠ increases with Ca and is larger for the plug propagation through a rigid channel than a flexible channel. Two effects may be involved that reduce the pressure drop when one compares the flexible and rigid cases: (1) the reduced plug volume in the plug core region due to the flexible membrane deformation and (2) the plug interface curvatures decrease near the bottom half domain of the flexible membrane. The experimental measurements for the pressure drop are much larger than that in numerical simulations. The discrepancy may come from several portions: (1) large variation of plug length at 1.5≤LP<20; (2) the additional pressure drop from the connecting tubing and channel portion from the location of pressure transducer to the inlet, inlet to the rear air phase, as well as that from the front air phase of the plug to the outlet tubing.
Our computations capture most of the trends of the experiments as far as the wall shape and pressure drop are concerned. As the plug propagates through the flexible channel, the magnitude of the negative pressure generated on the wall near the plug core is large enough to deform the flexible wall, which affects the plug flow and wall stresses. The dimensional values of the wall maximal deformation and stress can be estimated from our computations. For LP=1, Ca=0.01, and TL=0.5, the maximum wall deformation is 0.198, and the peak magnitudes of the normal stress and shear stress are −1.43 and −0.19. The dimensional normal and shear stress peak values are 1.43×10⁴ and 0.19×10⁴ dyn∕cm2, and the maximum wall deformation is around 10 μm for a channel height of 200 μm. In the experiments, the maximum wall deformation is of the order of 10 μm and the transmural pressure is estimated to be of the order of 104 dyn∕cm2. We believe this setup can be used to mimic the actual flexible airways and enable us to study the effect of wall flexibility on cell injury from plug propagation.
It should be noted that the computations did not take into account many factors. For example, in the computational wall model, inertia and damping are neglected as well as the longitudinal stretch of the wall. The 2D channel is modeled to mimic the middle plane of the three-dimensional rectangular duct in the experiments, while in reality the airways are tubelike and there is also a hoop tension.29 We also assumed constant surface tension and thus did not consider the effect of surfactant. Hence our analysis is appropriate for an airway system with surfactant dysfunction. The computation model assumed a spring support for the flexible wall, which is not included in the experimental setup. This could be part of reason of discrepancies between our model and experimental results.
There are additional measurement errors in the experiments and limitations in the modeling. Although the measurement was performed after the plug reach steady state from real time pressure data, there could be still unsteady issues which may affect the measurements and comparison with experiments. When the wall deformation is measured, the flexible wall edge is identified by the intensity change across the walls. Error may come from the intensity sharpness of the wall position. During imaging analysis, error may come from the intensity criteria of the threshold and the gradient as well as the smooth curve fitting of the wall position. These measurement errors could be part of reasons of being unable to show significant asymmetry of the wall deformation along axial direction in experiments.
However, this microfluidic flexible airway system enables us to demonstrate the importance of wall flexibility in promoting mechanical tissue injury during airway reopening. This has not been addressed in previous models. Our studies provide new insights into understanding the physiological nature of flexible airways on local cell injury during airway reopening in many diseases and clinical therapies. Although it is known that increasing compliance in the lungs or airway trees helps breathing and relieve lung injury, in diseases such as emphysema, where there is destruction of lung tissue, there could be additional local cell or tissue injury from higher mechanical stresses on the compliant walls when a plug forms and blocks the lung airways.
CONCLUSIONS
In this paper, a microfluidic airway system was used to study the effect of wall flexibility on plug propagation experimentally and computationally. Flexible microchannels were fabricated with compliance similar to that of the human small airways by incorporating a thin membrane for one of the channel walls. The local deformation of this thin flexible wall was observed experimentally as the plug propagated through the microchannel. The numerical results agree qualitatively with the experiments on wall deformation and predict a higher level of wall stress and stress gradients along the highly deformable wall as compared to a rigid channel wall. Therefore more deleterious effects are expected on the cells lining in the flexible airways during the reopening plug flow. Current approaches provide a stage to enhance the understanding of pulmonary mechanical forces during the airway reopening process. The results may potentially contribute to reducing (or diminishing) the lung injury encountered in lung diseases and induced by ventilators during treatments. Future studies will be performed on the responses of cells cultured on the flexible wall during the plug propagation and rupture.
ACKNOWLEDGMENTS
This work was supported by the NIH under Grant Nos. HL84370 and HL64373, and the NASA under Grant Nos. NAG3-2740 and NNC04AA21A. We acknowledge Dr. David Halpern for helpful discussions and paper proofreading and John C. Grotberg for proofreading.
References
- Hughes J. M. B., Rosenzweig D. Y., and Kivitz P. B., “Site of airway closure in excised dog lungs: Histologic demonstration,” J. Appl. Physiol. 29, 340 (1970). [DOI] [PubMed] [Google Scholar]
- Engel L. A., Grassino A., and Anthonisen N. R., “Demonstration of airway-closure in man,” J. Appl. Physiol. 38, 1117 (1975). [DOI] [PubMed] [Google Scholar]
- Hogg J. C., Chu F., Utokaparch S., Woods R., Elliott W. M., Buzatu L., Cherniack R. M., Rogers R. M., Sciurba F. C., Coxson H. O., and Pare P. D., “The nature of small-airway obstruction in chronic obstructive pulmonary disease,” N. Engl. J. Med. 350, 2645 (2004). 10.1056/NEJMoa032158 [DOI] [PubMed] [Google Scholar]
- Baker C. S., Evans T. W., and Randle B. J., “Damage to surfactant-specific protein in acute respiratory distress syndrome,” Lancet 353, 1232 (1999). 10.1016/S0140-6736(98)09449-5 [DOI] [PubMed] [Google Scholar]
- Holm B. A. and Matalon S., “Role of pulmonary surfactant in the development and treatment of adult respiratory distress syndrome,” Anesth. Analg. 69, 805 (1989). 10.1213/00000539-198912000-00021 [DOI] [PubMed] [Google Scholar]
- Griese M., Birrer P., and Demirsoy A., “Pulmonary surfactant in cystic fibrosis,” Eur. Respir. J. 10, 1983 (1997). 10.1183/09031936.97.10091983 [DOI] [PubMed] [Google Scholar]
- Griese M., Essl R., Schmidt R., Rietschel E., Ratjen F., Ballmann M., and Paul K., “Pulmonary surfactant, lung function, and endobronchial inflammation in cystic fibrosis,” Am. J. Respir. Crit. Care Med. 170, 1000 (2004). 10.1164/rccm.200405-575OC [DOI] [PubMed] [Google Scholar]
- Kamm R. D. and Schroter R. C., “Is airway closure caused by a thin liquid instability?” Respir. Physiol. 75, 141 (1989). 10.1016/0034-5687(89)90059-5 [DOI] [PubMed] [Google Scholar]
- Johnson M., Kamm R. D., Ho L. W., Shapiro A., and Pedley T. J., “The nonlinear growth of surface-tension-driven instabilities of a thin annular film,” J. Fluid Mech. 233, 141 (1991). 10.1017/S0022112091000423 [DOI] [Google Scholar]
- Halpern D. and Grotberg J. B., “Fluid-elastic instabilities of liquid-lined flexible tubes,” J. Fluid Mech. 244, 615 (1992). 10.1017/S0022112092003227 [DOI] [PubMed] [Google Scholar]
- Greaves I. A., Hildebrandt J., and Hoppin J. F. G., “Micromechanics of the lung,” Handbook of Physiology (American Physiological Society, Bethesda, 1986). [Google Scholar]
- Macklem P. T., Proctor D. F., and Hogg J. C., “The stability of peripheral airways,” Respir. Physiol. 8, 191 (1970). 10.1016/0034-5687(70)90015-0 [DOI] [PubMed] [Google Scholar]
- Huh D., Fujioka H., Tung Y. C., Futai N., Paine R., Grotberg J. B., and Takayama S., “Acoustically detectable cellular-level lung injury induced by fluid mechanical stresses in microfluidic airway systems,” Proc. Natl. Acad. Sci. U.S.A. 104, 18886 (2007). 10.1073/pnas.0610868104 [DOI] [PMC free article] [PubMed] [Google Scholar]
- Bilek A. M., Dee K. C., and Gaver D. P., “Mechanisms of surface-tension-induced epithelial cell damage in a model of pulmonary airway reopening,” J. Appl. Physiol. 94, 770 (2003). 10.1063/1.1582234 [DOI] [PubMed] [Google Scholar]
- Colledge W., “Cystic fibrosis gene therapy,” Curr. Opin. Genet. Dev. 4, 466 (1994). 10.1016/0959-437X(94)90037-X [DOI] [PubMed] [Google Scholar]
- Hirschl R. B., Croce M., Gore D., Wiedemann H., Davis K., Zwischenberger J., and Bartlett R. H., “Prospective, randomized, controlled pilot study of partial liquid ventilation in adult acute respiratory distress syndrome,” Am. J. Respir. Crit. Care Med. 165, 781 (2002). [DOI] [PubMed] [Google Scholar]
- Long W., Thompson T., Sundell H., Schumacher R., Volberg F., and Guthrie R., “Effects of two rescue doses of a synthetic surfactant on mortality rate and survival without bronchopulmonary dysplasia in 700- to 1350-gram infants with respiratory distress syndrome. The American Exosurf Neonatal Study Group I,” J. Pediatr. 118, 595 (1991). 10.1016/S0022-3476(05)83388-8 [DOI] [PubMed] [Google Scholar]
- Guyer B., Hoyert D. L., Martin J. A., Ventura S. J., MacDorman M. F., and Strobino D. M., “Annual summary of vital statistics—1998,” Pediatrics 104, 1229 (1999). 10.1542/peds.104.6.1229 [DOI] [PubMed] [Google Scholar]
- Naureckas E. T., Dawson C. A., Gerber B. S., Gaver D. P., Gerber H. L., Linehan J. H., Solway J., and Samsel R. W., “Airway reopening pressure in isolated rat lungs,” J. Appl. Physiol. 76, 1372 (1994). [DOI] [PubMed] [Google Scholar]
- Yap, D. Y., Liebkemann W. D., Solway J., and Gaver D. P. r., “Influences of parenchymal tethering on the reopening of closed pulmonary airways,” J. Appl. Physiol. 76, 2095 (1994). [DOI] [PubMed] [Google Scholar]
- Gaver D. P., Samsel R. W., and Solway J., “Effects of surface tension and viscosity on airway reopening,” J. Appl. Physiol. 69, 74 (1990). [DOI] [PubMed] [Google Scholar]
- Perun M. L. and Gaver D. P., “An experimental-model investigation of the opening of a collapsed untethered pulmonary airway,” ASME J. Biomech. Eng. 117, 245 (1995). 10.1115/1.2794177 [DOI] [PubMed] [Google Scholar]
- Perun M. L. and Gaver D. P., “Interaction between airway lining fluid forces and parenchymal tethering during pulmonary airway reopening,” J. Appl. Physiol. 79, 1717 (1995). [DOI] [PubMed] [Google Scholar]
- Juel A. and Heap A., “The reopening of a collapsed fluid-filled elastic tube,” J. Fluid Mech. 572, 287 (2007). 10.1017/S0022112006003612 [DOI] [Google Scholar]
- Gaver D. P., Halpern D., Jensen O. E., and Grotberg J. B., “The steady motion of a semi-infinite bubble through a flexible-walled channel,” J. Fluid Mech. 319, 25 (1996). 10.1017/S0022112096007240 [DOI] [Google Scholar]
- Hazel A. L. and Heil M., “Three-dimensional airway reopening: the steady propagation of a semi-infinite bubble into a buckled elastic tube,” J. Fluid Mech. 478, 47 (2003). 10.1017/S0022112002003452 [DOI] [Google Scholar]
- Hazel A. L. and Heil M., “Surface-tension-induced buckling of liquid-lined elastic tubes: A model for pulmonary airway closure,” Proc. R. Soc. London, Ser. A 461, 1847 (2005). 10.1098/rspa.2005.1453 [DOI] [Google Scholar]
- Halpern D., Naire S., Jensen O. E., and Gaver D. P., “Unsteady bubble propagation in a flexible channel: Predictions of a viscous stick-slip instability,” J. Fluid Mech. 528, 53 (2005). 10.1017/S002211200400309X [DOI] [Google Scholar]
- Howell P. D., Waters S. L., and Grotberg J. B., “The propagation of a liquid bolus along a liquid-lined flexible tube,” J. Fluid Mech. 406, 309 (2000). 10.1017/S0022112099007417 [DOI] [Google Scholar]
- Grotberg J. B., “Respiratory fluid mechanics and transport processes,” Annu. Rev. Biomed. Eng. 3, 421 (2001). 10.1146/annurev.bioeng.3.1.421 [DOI] [PubMed] [Google Scholar]
- Grotberg J. B. and Jensen O. E., “Biofluid mechanics in flexible tubes,” Annu. Rev. Fluid Mech. 36, 121 (2004). 10.1146/annurev.fluid.36.050802.121918 [DOI] [Google Scholar]
- Kay S. S., Bilek A. M., Dee K. C., and Gaver D. P., “Pressure gradient, not exposure duration, determines the extent of epithelial cell damage in a model of pulmonary airway reopening,” J. Appl. Physiol. 97, 269 (2004). 10.1152/japplphysiol.01288.2003 [DOI] [PubMed] [Google Scholar]
- Tschumperlin D. J., Oswari J., and Margulies S. S., “Deformation-induced injury of alveolar epithelial cells—effect of frequency, duration, and amplitude,” Am. J. Respir. Crit. Care Med. 162, 357 (2000). [DOI] [PubMed] [Google Scholar]
- Savla U., Sporn P. H. S., and Waters C. M., “Cyclic stretch of airway epithelium inhibits prostanoid synthesis,” Am. J. Physiol. Lung Cell. Mol. Physiol. 273, L1013 (1997). [DOI] [PubMed] [Google Scholar]
- Sanchez-Esteban J., Cicchiello L. A., Wang Y. L., Tsai S. W., Williams L. K., Torday J. S., and Rubin L. P., “Mechanical stretch promotes alveolar epithelial type II cell differentiation,” J. Appl. Physiol. 91, 589 (2001). [DOI] [PubMed] [Google Scholar]
- Dreyfuss D. and Saumon G., “Ventilator-induced lung injury—lessons from experimental studies,” Am. J. Respir. Crit. Care Med. 157, 294 (1998). [DOI] [PubMed] [Google Scholar]
- Parker J. C., Hernandez L. A., Longenecker G. L., Peevy K., and Johnson W., “Lung edema caused by high peak inspiratory pressures in dogs—role of increased microvascular filtration pressure and permeability,” Am. Rev. Respir. Dis. 142, 321 (1990). [DOI] [PubMed] [Google Scholar]
- Egan E. A., “Lung-inflation, lung solute permeability, and alveolar edema,” J. Appl. Physiol. 53, 121 (1982). [DOI] [PubMed] [Google Scholar]
- Hernandez L. A., Coker P. J., May S., Thompson A. L., and Parker J. C., “Mechanical ventilation increases microvascular permeability in oleic acid-injured lungs,” J. Appl. Physiol. 69, 2057 (1990). [DOI] [PubMed] [Google Scholar]
- Berg J. T., Fu Z. X., Breen E. C., Tran H. C., MathieuCostello O., and West J. B., “High lung inflation increases mRNA levels of ECM components and growth factors in lung parenchyma,” J. Appl. Physiol. 83, 120 (1997). [DOI] [PubMed] [Google Scholar]
- Tremblay L., Valenza F., Ribeiro S. P., Li J. F., and Slutsky A. S., “Injurious ventilatory strategies increase cytokines and c-fos m-RNA expression in an isolated rat lung model,” J. Clin. Invest. 99, 944 (1997). 10.1172/JCI119259 [DOI] [PMC free article] [PubMed] [Google Scholar]
- Fujioka H. and Grotberg J. B., “Steady propagation of a liquid plug in a 2-dimensional channel,” ASME J. Biomech. Eng. 126, 567 (2004). 10.1115/1.1798051 [DOI] [PubMed] [Google Scholar]
- Heil M., “Finite Reynolds number effects in the Bretherton problem,” Phys. Fluids 13, 2517 (2001). 10.1063/1.1389861 [DOI] [Google Scholar]
- Jacob A. M. and Gaver D. P., “An investigation of the influence of cell topography on epithelial mechanical stresses during pulmonary airway reopening,” Phys. Fluids 17, 031502 (2005). 10.1063/1.1862642 [DOI] [PMC free article] [PubMed] [Google Scholar]
- Jensen O. E., Horsburgh M. K., Halpern D., and Gaver D. P., “The steady propagation of a bubble in a flexible-walled channel: Asymptotic and computational models,” Phys. Fluids 14, 443 (2002). 10.1063/1.1432694 [DOI] [Google Scholar]
- Duffy D. C., McDonald J. C., Schueller O. J. A., and Whitesides G. M., “Rapid prototyping of microfluidic systems in poly(dimethylsiloxane),” Anal. Chem. 70, 4974 (1998). 10.1021/ac980656z [DOI] [PubMed] [Google Scholar]
- Kamm R. D., “Airway wall mechanics,” Annu. Rev. Biomed. Eng. 1, 47 (1999). 10.1146/annurev.bioeng.1.1.47 [DOI] [PubMed] [Google Scholar]
- Lotters J. C., Olthuis W., Veltink P. H., and Bergveld P., “Polydimethylsiloxane as an elastic material applied in a capacitive accelerometer,” J. Micromech. Microeng. 6, 52 (1996). 10.1088/0960-1317/6/1/010 [DOI] [Google Scholar]
- Lotters J. C., Olthuis W., Veltink P. H., and Bergveld P., “Polydimethylsiloxane, a photocurable rubberelastic polymer used as spring material in micromechanical sensors,” Microsyst. Technol. 3, 64 (1997). 10.1007/s005420050057 [DOI] [Google Scholar]
- Lotters J. C., Olthuis W., Veltink P. H., and Bergveld P., “The mechanical properties of the rubber elastic polymer polydimethylsiloxane for sensor applications,” J. Micromech. Microeng. 7, 145 (1997). 10.1088/0960-1317/7/3/017 [DOI] [Google Scholar]
- Silver F. H., Freeman J. W., and Seehra G. P., “Collagen self-assembly and the development of tendon mechanical properties,” J. Biomech. 36, 1529 (2003). 10.1016/S0021-9290(03)00135-0 [DOI] [PubMed] [Google Scholar]
- Cavalcante F. S. A., Ito S., Brewer K., Sakai H., Alencar A. M., Almeida M. P., Andrade J. S., Majumdar A., Ingenito E. P., and Suki B., “Mechanical interactions between collagen and proteoglycans: Implications for the stability of lung tissue,” J. Appl. Physiol. 98, 672 (2005). 10.1152/japplphysiol.00619.2004 [DOI] [PubMed] [Google Scholar]
- Zheng Y., Fujioka H., and Grotberg J. B., “Effects of gravity, inertia, and surfactant on steady plug propagation in a two-dimensional channel,” Phys. Fluids 19, 082107 (2007). 10.1063/1.2762256 [DOI] [Google Scholar]
- Imrak C. E. and Gerdemeli I., “The problem of isotropic rectangular plate with four clamped edges,” Sadhana-Academy Proceedings in Engineering Sciences 32, 181 (2007). [Google Scholar]
- Levy S., “Bending of rectangular plates with large deflections,” National Advisory Committee for Aeronautics Technical Note No. 737, 1942.
- Timoshenko S. and Woinowsky-krieger S., “Large deflections of plates,” Theory of Plates and Shells (McGraw-Hill, Tokyo, 1959). [Google Scholar]
- Wang C. T., “Nonlinear large-deflection boundary-value problems of rectangular plates,” National Advisory Committee for Aeronautics Technical Note No. 1425, 1948.
- Wang D. F. and El-Sheikh A. I., “Large-deflection mathematical analysis of rectangular plates,” J. Eng. Mech. 131, 809 (2005). 10.1061/(ASCE)0733-9399(2005)131:8(809) [DOI] [Google Scholar]
- Dragon C. A. and Grotberg J. B., “Oscillatory flow and dispersion in a flexible tube,” J. Fluid Mech. 231, 135 (1991). 10.1017/S0022112091003348 [DOI] [Google Scholar]
- Thompson J. F., Soni B. K., and Weatherill N. P., Handbook of Grid Generation (CRC, Boca Raton, 1999). [Google Scholar]
- Patankar S. V., Numerical Heat Transfer and Fluid Flow (Hemisphere, London, 1980). [Google Scholar]
- Press W. H., Flannery B. P., Teukolsky S. A., and Vetterling W. T., Numerical Recipes in C, 2nd ed. (Cambridge University Press, New York, 1992). [Google Scholar]
- Melissinos C. G. and Mead J., “Maximum expiratory flow changes induced by longitudinal tension on trachea in normal subjects,” J. Appl. Physiol. 43, 537 (1977). [DOI] [PubMed] [Google Scholar]
- Penn R. B., Wolfson M. R., and Shaffer T. H., “Influence of smooth-muscle tone and longitudinal tension on the collapsibility of immature airways,” Pediatr. Pulmonol. 5, 132 (1988). 10.1002/ppul.1950050303 [DOI] [PubMed] [Google Scholar]


