Abstract
Distortion-product otoacoustic emission (DPOAE) input∕output (I∕O) functions were measured in 322 ears of 176 subjects at as many as 8 f2 frequencies per ear for a total of 1779 I∕O functions. The f2 frequencies ranged from 0.7 to 8 kHz in half-octave steps. Behavioral thresholds (BTs) at the f2 frequencies ranged from −5 to 60 dB hearing loss (HL). Both linear-pressure and nonlinear, two-slope functions were fitted to the data. The two-slope function describes I∕O compression as output-controlled self-suppression. Most I∕O functions (96%) were better fitted by the two-slope method. DPOAE thresholds based on each method were used to predict BTs. Compared to estimates based on linear-pressure functions, individual BTs predicted from DPOAE thresholds based on the two-slope model had lower residual error and accounted for more variance. Another advantage of the two-slope method is that it provides an estimate of response growth rate (RGR) that is not tied to threshold. At all frequencies, the median low-level RGR (across I∕O functions of the same f2 and BT) usually increased as BT increased, while high-level compression decreased. The observed characteristics of DPOAE I∕O functions are consistent with the loss of cochlear compression that is typically associated with mild-to-moderate HL.
INTRODUCTION
Distortion-product otoacoustic emissions (DPOAEs) are produced by the nonlinear interaction of two tones within the cochlea. This nonlinearity is due to the normal function of outer hair cells (OHCs), which is essential for normal auditory function, including auditory sensitivity. In fact, DPOAEs provide a window into cochlear function that allows estimates of behavioral threshold (BT) (e.g., Martin et al., 1990; Boege and Janssen, 2002; Gorga et al., 2003a). DPOAEs also provide information about the rate of growth of cochlear responses. Information about both of these features of cochlear function may be obtained in individual ears by quantifying characteristics of DPOAE input∕output (I∕O) functions.
Normal properties of DPOAEs have been studied extensively in humans and other animals (e.g., Probst et al., 1991; Lonsbury-Martin and Martin, 2007), and share features that are at least qualitatively similar to those observed in invasive measurements of cochlear-response properties in lower animals. For example, I∕O functions derived from direct basilar membrane (BM) measurements (Ruggero and Rich, 1991; Ruggero et al., 1997; Rhode, 2007) are similar to DPOAE I∕O functions (Mills et al., 1993; Mills and Rubel, 1994). At the best or characteristic frequency (CF) for a particular location on the BM (defined as the frequency to which the place is most sensitive), there is nearly-linear growth in response to low stimulus levels, less-than-linear growth at moderate levels, and nearly linear growth again at high levels (e.g., Ruggero and Rich, 1991). However, when driven by a tone whose frequency is well below CF, growth rates remain nearly linear throughout the entire range of stimulus levels. Similar frequency dependence in slope has been observed when DPOAE responses are suppressed by a frequency that is about an octave below f2, the higher frequency in the primary-frequency pair eliciting the DPOAE (Gorga et al., 2003b, 2008).
Damage to OHCs is known to cause several changes to auditory function, including an increase in threshold (e.g., Dallos and Harris, 1978; Liberman and Dodds, 1984). Because the generation of DPOAEs depends on the integrity of the OHC system, DPOAEs are reduced or absent in ears with hearing loss (HL) (e.g., Kummer et al., 1998; Gorga et al., 1993, 2000; Dorn et al., 2001). Since DPOAEs can be measured noninvasively, they have been used as a tool to detect impaired auditory function in humans (e.g., Lonsbury-Martin and Martin, 1990; Bonfils and Avan, 1992; Kim et al., 1996; Gorga et al., 1993, 1997). The clinical utility of these measurements is based on the knowledge that OHCs have essential roles in determining both DPOAE level and auditory sensitivity. In efforts to exploit this fact, some investigators have demonstrated a relationship between DPOAEs and BTs (Martin et al., 1990; Gorga et al., 1996; Boege and Janssen, 2002; Gorga et al., 2003a; Rogers et al., 2009).
Besides reducing auditory sensitivity, OHC damage changes the way cochlear responses grow with level. Following administration of furosemide, an agent known to reversibly reduce the endocochlear potential that serves as the power supply for OHC motility, auditory sensitivity is reduced and BM I∕O functions at CF lose their characteristic compressive nonlinearity and become more linear (Ruggero and Rich, 1991). Cochlear responses altered by furosemide are similar to response patterns observed with other more permanent cochlear impairments. Just as normal DPOAE I∕O functions resemble directly-measured BM I∕O functions in normal-hearing animals, the DPOAE I∕O functions of hearing-impaired ears resemble BM I∕O functions following cochlear insult (Mills et al., 1993; Mills and Rubel, 1994; Dorn et al., 2001).
In summary, data from lower animals reveal that direct measures of BM motion and indirect DPOAE measures of cochlear-response properties are similar and undergo similar changes in ears with induced cochlear lesions. While direct measurement of BM motion is impossible in humans, DPOAE measurements are noninvasive and are routinely used to detect HL. The similarities between direct cochlear-response measures in lower animals and indirect cochlear-response estimates based on DPOAE data (either in humans or lower animals) suggest that it may be possible to use DPOAE measurements in humans to provide insights into cochlear function over a wide range of levels.
The present study examines characteristics of DPOAE I∕O functions in humans, with a goal of inferring cochlear-response properties for both normal and impaired ears. To the extent that DPOAE I∕O functions are measures of cochlear-response growth, these comparisons help to describe the changes in response growth that occur as a consequence of HL in humans.
METHODS
DPOAE I∕O functions were measured in 322 ears of 176 human subjects, ages 11–80 years old, at as many as eight f2 frequencies per ear. Subjects were included if they demonstrated air-bone gaps <15 dB and had normal 226-Hz tympanograms just prior to when the DPOAE data were collected. The f2 frequencies ranged from 0.7 to 8 kHz in half-octave steps. The level of f2 (L2) ranged from −20 to 80 dB sound pressure level (SPL) in 5-dB steps. The level of f1 (L1) and the ratio of primary frequencies (f2∕f1) were determined by the following equations suggested by Johnson et al. (2006):
| (1) |
| (2) |
It was expected that for any given f2 and L2, the largest DPOAE level (on average for normal-hearing subjects) would be obtained when f1 and L1 are selected to satisfy Eqs. 1, 2. However, obtaining the largest possible DPOAE level was not a requirement for this study.
At each f2, I∕O functions were sorted into 14 HL categories, ranging from −5 to 60 dB HL (see ANSI, 1996) in 5-dB steps, according to the BT of the ear at (or near) f2.
Measurement
Subjects were seated in a sound-isolated room. Complete data collection required one or two 2-h sessions from each subject. Tympanograms were obtained at the beginning of each data-collection session. Stimuli were generated and responses recorded by a 24-bit soundcard (CardDeluxe, Digital Audio Laboratories) using locally-developed software (EMAV version 2.70; Neely and Liu, 1994). Sound was delivered to the ear by an insert earphone that included two separate sound sources and a calibrated microphone (ER-10C, Etymōtic Research). The ER-10C was modified to remove 20 dB of attenuation in order to allow presentation of stimuli at 80 dB SPL. Stimulus levels were calibrated in dB SPL in the ear using the ER-10C microphone. There are concerns for calibration errors when SPL is used (Siegel and Hirohata, 1994; Siegel, 2007; Scheperle et al., 2008), especially at higher frequencies. However, recent data suggest that calibration method does not have a large impact on DPOAE test performance or the ability of DPOAEs to predict BT (Burke et al., 2009; Rogers et al., 2009).
For each f2, data collection began at the highest L2 and continued until the signal-to-noise ratio (SNR) <3 dB. DPOAE level (Ld) was based on the level in the 2f1−f2 frequency bin, while noise level (Ln) included the level in the 2f1−f2 bin as well as in five bins on either side of this bin. Levels were estimated by alternately storing 0.25-s samples in two buffers. To estimate Ld, the levels in the two buffers were summed and to estimate Ln, the levels in the two buffers were subtracted. Measurement-based stopping rules were used, in which data collection was terminated if the noise was <−25 dB SPL or artifact-free averaging time exceeded 32 s. The noise criterion, which places system distortion below the noise at all but the highest stimulus levels, was the primary stopping rule because its use resulted in the widest dynamic range of measurements across subjects and conditions. However, it was necessary to include an averaging-time criterion to avoid excessive averaging times for a single condition. In the majority of subjects, these rules allowed measuring DPOAEs for a wide range of levels, including low levels, and for a wide range of frequencies, including those at and below 1.5 kHz, where the noise floor sometimes is a problem.
Analysis
If complete I∕O functions had been measured at each of 8 frequencies in every ear, a total of 2576 I∕O functions would have been available for analysis. However, the inability to measure DPOAE levels above the noise floor in some subjects reduced the number of available I∕O functions. This occurred mainly in subjects with HL, a number of whom did not produce DPOAEs at some frequencies, even for high-level stimuli. Additionally, in some subjects, it was not possible to reduce the noise levels to levels that would allow measuring responses reliably. This problem was frequency dependent, occurring almost exclusively for low f2 frequencies. To be considered for further analysis, I∕O functions were required to have a SNR of at least 3 dB at three or more consecutive stimulus levels. Although ears with greater HL were more likely to fail to meet this criterion, acceptable I∕O functions were measured in some ears with thresholds as high as 60 dB HL. The distribution across frequencies and HL categories of the 1779 I∕O functions considered acceptable for analysis is described in Table 1.
Table 1.
The number of I∕O functions in each HL category at each frequency that were included in the analysis.
| 707 | 1000 | 1414 | 2000 | 2828 | 4000 | 5656 | 8000 | Total | |
|---|---|---|---|---|---|---|---|---|---|
| −5 | 2 | 6 | 7 | 5 | 6 | 18 | 12 | 12 | 68 |
| 0 | 25 | 20 | 36 | 27 | 26 | 37 | 28 | 18 | 217 |
| 5 | 54 | 53 | 35 | 31 | 37 | 21 | 28 | 29 | 288 |
| 10 | 32 | 42 | 36 | 36 | 21 | 17 | 19 | 22 | 225 |
| 15 | 33 | 31 | 22 | 23 | 22 | 14 | 16 | 15 | 176 |
| 20 | 21 | 21 | 18 | 14 | 16 | 6 | 10 | 12 | 118 |
| 25 | 19 | 19 | 25 | 11 | 5 | 10 | 8 | 6 | 103 |
| 30 | 7 | 11 | 12 | 15 | 4 | 8 | 7 | 6 | 70 |
| 35 | 3 | 11 | 13 | 19 | 19 | 14 | 10 | 3 | 92 |
| 40 | 2 | 7 | 18 | 16 | 13 | 15 | 8 | 11 | 90 |
| 45 | 7 | 5 | 7 | 11 | 12 | 13 | 15 | 9 | 79 |
| 50 | 5 | 4 | 7 | 13 | 14 | 17 | 18 | 15 | 93 |
| 55 | 1 | 4 | 8 | 8 | 13 | 15 | 17 | 11 | 77 |
| 60 | 1 | 1 | 1 | 5 | 16 | 29 | 12 | 18 | 83 |
| Total | 212 | 235 | 245 | 234 | 224 | 234 | 208 | 187 | 1779 |
Each individual I∕O function was fitted by two different methods. In the first method, a linear regression of linear pressure (in μPa) onto L2 (in dB SPL) was performed. This method was initially suggested by Boege and Janssen (2002) and has been used in other studies since its original description (e.g., Oswald and Janssen, 2003; Gorga et al., 2003a; Rogers et al., 2009).
In the second method, a nonlinear, two-slope function was fitted to the same data. The two-slope function models I∕O compression as output-controlled suppression. The equation used to describe the two-slope function was motivated by the observation in previous studies of DPOAE suppression (Gorga et al., 2003b, 2008) that decrements (amount of suppression) could be transformed into nearly-linear functions of suppressor level by the following equation:
| (3) |
In this equation, decr represents the DPOAE decrement in decibel and D has been observed to have nearly-linear dependence on suppressor level. The success of this transformation in characterizing DPOAE suppression suggests that the decrement due to suppression is well described by
| (4) |
where D is a linear function of suppressor level. Suppose that D=S2(Ls−Li), where Ls represents suppressor level, Li represents the input level (L2) at the breakpoint between near-linear slopes of the I∕O function at low levels and the more compressive slope at higher levels, and S2 represents the amount of compression. S2 and Li are parameters of the linear dependence of D on suppressor level. With this substitution, the equation for decrement may be written as a function of suppressor level relative to the parameter Li as follows:
| (5) |
Our previous studies suggest that Eq. 5 provides a good description of DPOAE suppression (e.g., Gorga et al., 2003b, 2008).
Suppose that compression of DPOAE I∕O functions can be modeled as decrements (self-suppression) due to increases in DPOAE level. Equation 4 can be adapted to represent decrement in this model by substituting D=S2(Ld−Lo) as follows:
| (6) |
In this equation, Ld represents DPOAE level and Lo represents the Ld at which the breakpoint between linear and compressive slopes occurred. The dependence of DPOAE level on stimulus level is presumed to be nearly linear when stimulus levels are low. The parameter S1 represents the slope of the low-level portion of the I∕O function. The nearly-linear and the compressive ranges are combined into a single, two-slope function that can be fitted to the DPOAE I∕O functions
| (7) |
Because Ld appears on both sides of Eq. 6, the fitting process is more conveniently performed by a nonlinear regression of Ld onto L2 as follows:
| (8) |
Equation 8 has four parameters (Li, Lo, S1, and S2), compared to only two parameters for the linear-pressure fit that has been used previously (i.e., Boege and Janssen, 2002). The increased number of parameters in the two-slope method is only justified if the resulting fits to the data are improved.
Prior to fitting I∕O functions by either method, the DPOAE data were modified to force the I∕O functions to have non-decreasing dependence on stimulus level. This requirement was imposed by replacing any DPOAE level that was less than the DPOAE level at the previous lower stimulus level with the larger DPOAE level. In effect, any local dips in the I∕O functions were flattened out. Note that in both fitting methods, L2 is the dependent variable of the regression. Flattening the I∕O function avoids having disconnected L2 values associated with any Ld. Elimination of the decreasing portions of the I∕O function when fitting the data is justified as a compromise required to allow the fitting of simple models to the data, such as the linear-pressure and two-slope models.
A nonlinear regression procedure was used to fit the two-slope function. In this procedure, the following limits were imposed to restrict the range of each parameter: −20<Li<80, −20<Lo<20, 0.1<S1<1.5, and 0.5<S2<8. The importance of setting these parameter limits was in controlling behavior of the nonlinear regression for unusual cases.
DPOAE thresholds were estimated differently for the two fitting methods. For the linear-pressure fit, DPOAE threshold was defined as the intercept of the fitted function with zero pressure (e.g., Boege and Janssen, 2002). For the two-slope fit, DPOAE threshold was defined by setting Ld=−25 dB SPL in Eq. 8 and solving for L2. DPOAE thresholds estimated by each method were used separately to predict BTs, and the predictive accuracy of the two methods was used as a quantitative approach to comparing the two fitting procedures. To improve the predictions from both methods, predicted BTs were restricted to the range from 0 to 60 dB HL.
RESULTS
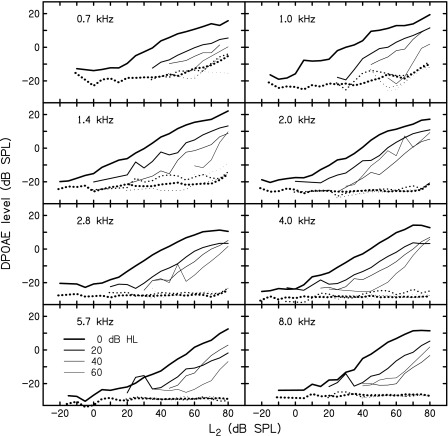
Figure 1 shows how the shape of typical DPOAE I∕O functions changes with frequency and HL category. These trends are illustrated by showing the median DPOAE level for representative HL categories (0, 20, 40, and 60 dB HLs) at each stimulus frequency (f2). Across all HL categories and f2 frequencies, I∕O functions show increasing Ld with increasing stimulus level (L2) with a maximum Ld of between 10 and 20 dB SPL. The modification to ensure non-decreasing I∕O functions for fitting purposes was not done when obtaining median values for Fig. 1.
Figure 1.
Median DPOAE levels (solid lines) as a function of stimulus level. Each panel shows four different HL categories (0, 20, 40, and 60 dB HLs) at the indicated f2 frequency. The HL category is indicated by the line weight from heavy (0 dB HL) to light (60 dB HL). The dashed lines indicate the median noise level at f2 corresponding to each I∕O function.
Each of the 1779 I∕O functions was fitted by both linear-pressure and two-slope methods. The two-slope method provided a better fit for 96% of the I∕O functions. A “better fit” was defined by one model resulting in a residual error that was at least 1% smaller than the other model. Of the remaining 4% that were not better fitted by the two-slope method, 1% were better fitted by the linear-pressure method and 3% were equally-well fitted by either method, meaning that the difference in the resulting residual error between the two methods was less than 1%. An examination of the distribution of better fits revealed no obvious trends for either the linear-pressure or two-slope methods across frequency and HL category.
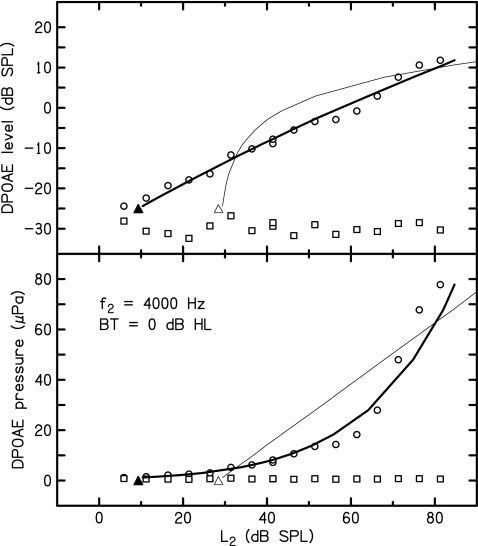
Figure 2 shows an example of an I∕O function that was better fitted by the two-slope method. In this case, the residual error was 74% less for the two-slope method. Note in the upper panel of Fig. 2 that DPOAE level is nearly a linear function of stimulus level over the entire range of stimulus levels. In other words, the I∕O function has a nearly constant slope. The linear dependence of DPOAE level translates into exponential growth of pressure in the lower panel of Fig. 2, which was not well fitted by the linear-pressure model, as would be expected.
Figure 2.
Example of an I∕O function better fitted by the two-slope model. The linear-pressure (thin line) and two-slope (thick line) fits are both superimposed on the DPOAE measurements at f2=4 kHz in an ear with 0 dB HL threshold. The circles in the upper panel represent the measured DPOAE levels (Ld) and the circles in the lower panel represent the corresponding pressure amplitudes (Pd) in μPa. In this case, the standard error for the two-slope fit was 76% smaller than the linear-pressure fit. The squares represent the noise levels corresponding to each DPOAE measurement. The filled and open triangles indicate the DPOAE thresholds associated with the two-slope fit and linear-pressure fits, respectively.
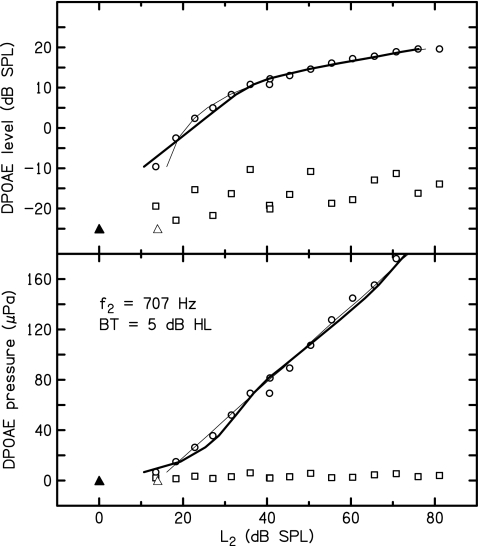
Figure 3 shows an example of an I∕O function that was better fitted by the linear-pressure method. In this case, the residual error was 28% greater for the two-slope method. A visual comparison of the thin (linear-pressure) and thick (two-stage model) lines, however, reveals no apparent difference in the quality of the fits. Note how the change in slope of the two-slope function in the upper panel of Fig. 3 translates into a more linear function of pressure in the lower panel. This observation suggests that one reason for the success of the simpler linear-pressure method in fitting the DPOAE data is that many I∕O functions are not well described by a single slope.
Figure 3.
Example of an I∕O function better fitted by the linear-pressure model. The linear-pressure (thin line) and two-slope (thick line) fits are compared for a DPOAE I∕O function at f2=707 Hz in an ear with 5-dB HL threshold. The circles in the upper panel represent the measured DPOAE levels (Ld) and the circles in the lower panel represent the corresponding pressure amplitudes (Pd) in μPa. In this case, the standard error for the two-slope fit was 28% larger than the linear-pressure fit. The squares represent the noise levels corresponding to each DPOAE measurement. The filled and open triangles indicate the DPOAE thresholds associated with the two-slope fit and linear-pressure fits, respectively.
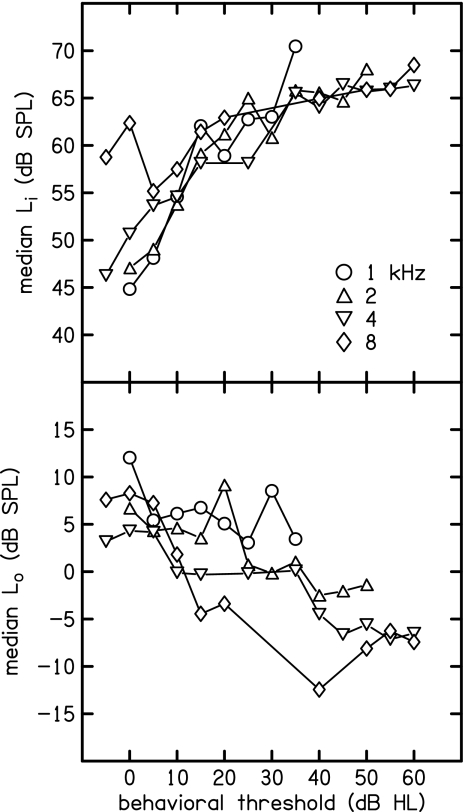
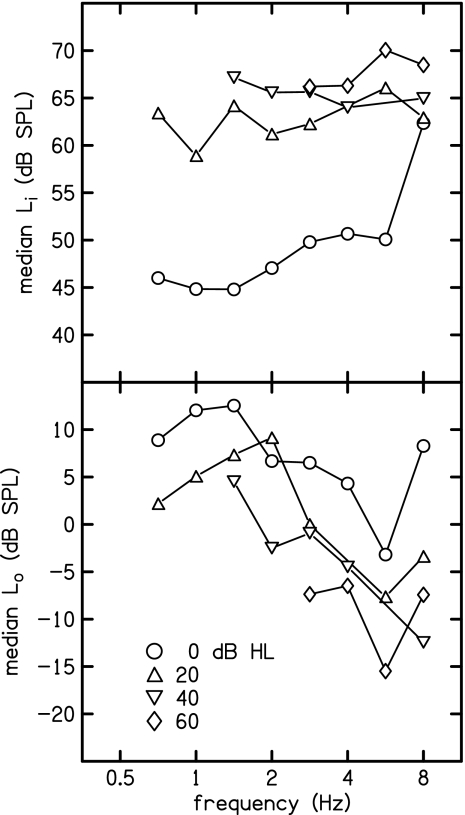
Figures 4567 describe the level and slope parameters that were selected by the two-slope method to fit the DPOAE data. The median-level parameters for octave frequencies and each HL category are shown in Fig. 4. The level parameters describe the location of the breakpoint between the two slopes along the input and output axes of the I∕O function in the top and bottom panels, respectively. The upper panel shows a trend of increasing Li with BT, especially in the normal-hearing range from −5 to 20 dB HL. Increasing Li means the breakpoint in the I∕O function along the input-stimulus dimension moves toward the right. In other words, the onset of compression is lower in ears with better hearing. The lower panel shows Lo decreasing with BT, indicating that the breakpoint along the output-stimulus dimension tends to be lower with increasing HL. This result is expected because one would predict that the ear would produce less DPOAE output as BT increases.
Figure 4.
Level parameters. The input-level parameter Li (upper panel) represents the position of the two-slope breakpoint along the x axis, while the output-level parameter Lo (lower panel) represents the position of the two-slope breakpoint along the y axis.
Figure 5.
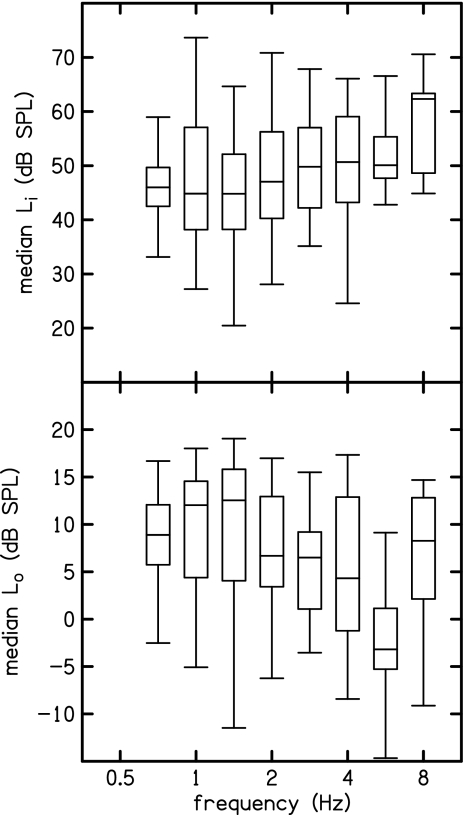
Distribution of level parameters for 0 dB HL. Each box-and-whisker symbol indicates the median, inter-quartile range, and furthest non-outliers for selected distributions of either Li (upper panel) or Lo (lower panel).
Figure 6.
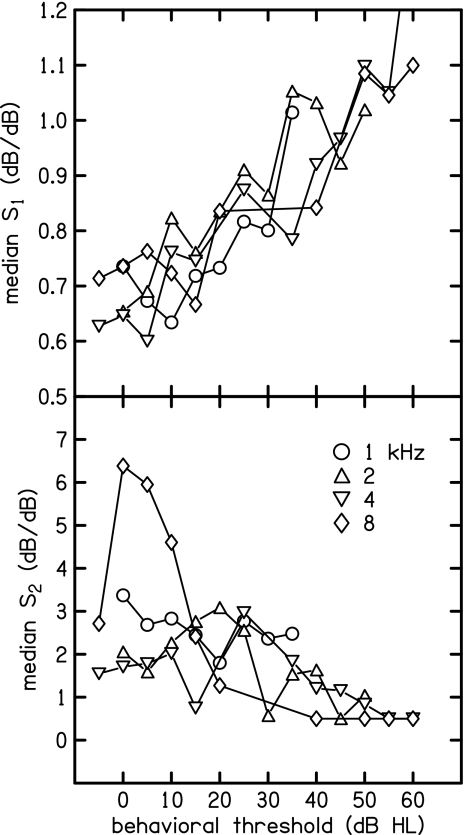
Slope parameters. The first slope parameter S1 (upper panel) represents the low-level slope, while the second parameter S2 represents the additional compression that is applied to reduce the slope at high levels.
Figure 7.
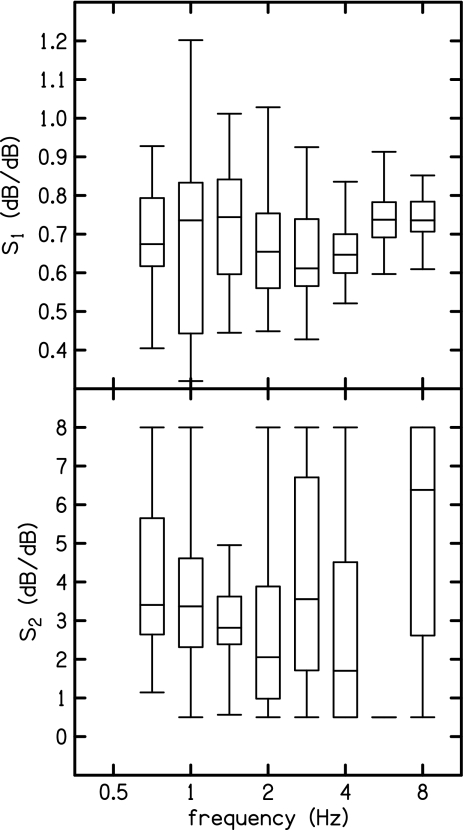
Distribution of slope parameters for 0 dB HL. Each box-and-whisker symbol indicates the median, inter-quartile range, and furthest non-outliers for selected distributions of either S1 (upper panel) or S2 (lower panel).
Figure 5 shows the distribution of the level parameters within the 0 dB HL category for each f2 frequency. The box-and-whisker plots show five characteristic points on these distributions. The top and bottom of the box represent the first and third quartiles, respectively, while the intermediate line bisecting the box represents the median. The upper and lower whiskers represent the furthest data points within 1.5 times the length of the box (i.e., 1.5 times the inter-quartile range) above the top or below the bottom of the box, respectively. In other words, the whiskers represent the furthest non-outlier data points. With two exceptions (0.7 and 5.6 kHz), the inter-quartile range of Li (upper panel) is more than 10 dB, while the upper and lower whiskers can span nearly 40 dB. This large range of shifts in the input level (L2) at which the break occurs is surprising considering that all of these ears had the same (0 dB HL) BTs. The distributions of Lo (lower panel) reveal that the range of vertical shifts in the output (Ld) at which the breakpoint occurs is similar to the range of horizontal shifts. There is no apparent trend in the median values of Li or Lo across frequency; however, the median Li appears to be skewed upward at 8 kHz, while the median Lo appears to be unusually low at 5.6 kHz. These anomalies will be discussed in more detail later.
Median-slope parameters are shown in Fig. 6. The lower-level slope S1 (upper panel) tends to increase with BT, while S2 tends to decrease. Note that median S1 values are typically less than 1 when BT is less than 50 dB HL. Because S2 multiplies Ld in Eq. 8, it may be interpreted as representing compression. This compression decreases the slope of the I∕O function when L2>Lo. As a result, the high-level slope of the two-slope function is S1∕S2. The slope parameters in Fig. 6 reveal no obvious trend with frequency. Overall, the summary of median data in Fig. 6 indicates that the slope of the I∕O function increases and the amount of compression decreases as threshold increases. Stated another way, response grows more rapidly when HL exists.
Figure 7 shows the distribution of the slope parameters within the 0 dB HL category for each f2 frequency. Median values of S1 are about 0.7 at all frequencies. Above 2 kHz, the inter-quartile range of S1 is smaller, being only about 15% of its median value. The relatively small inter-quartile range suggests that S1 is less variable across subjects than the other three parameters from the two-slope model. Median values of S2 are less consistent across frequency compared to S1. Note how the entire distribution of S2 collapses to the minimum allowed value (0.5) at 5.6 kHz. This is the same frequency where the output-level parameter Lo is unusually low, which may indicate lower reverse middle-ear transmission at this frequency. Another interpretation is that the cochlea generates less distortion at 5.6 kHz, either due to a transition in cochlear mechanics or (perhaps more likely) to the particular choice of stimulus levels at this frequency.
Similar to Li in Fig. 5, S2 at 8 kHz is also skewed toward its maximum value in Fig. 7. These two trends reflect the fact that a large number of I∕O functions at 8 kHz appear to become very compressed or saturate at a maximum DPOAE level when L2 is large. In contrast, none of I∕O functions at 5.6 kHz exhibited any compression at high levels, as evidenced by the collapse of the S2 to its minimum value at this frequency in Fig. 7. Because stimulus parameters varied gradually across frequency, the contrast in observed I∕O-function features between 5.6 and 8 kHz may indicate a transition in the underlying cochlear mechanics in this frequency region.
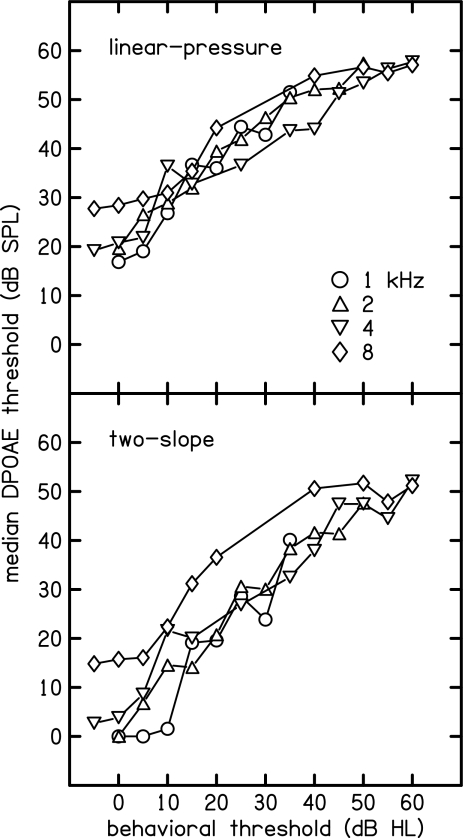
DPOAE thresholds (defined specifically and differently for each method as described above) are shown in Fig. 8 for both the linear-pressure (upper panel) and two-slope (lower panel) methods. For both methods, there appears to be a nearly-linear relation between DPOAE threshold and BT with no obvious difference in slope across frequency. The linear-pressure thresholds show less variability across frequency and have a shallower slope, compared to the two-slope thresholds. In practical terms, this means that DPOAE thresholds from the linear model were higher than BTs when BTs were less than 25 dB HL, compared to the two-slope model, but both models produced similar threshold estimates for greater HLs. If the dependent and independent variables were reversed in this figure (as might be the case in the clinic), then the two-slope model would provide threshold estimates in better agreement with BTs when hearing was within broadly defined normal limits. A linear regression of BT onto median DPOAE thresholds provided the coefficients needed to predict BT from DPOAE threshold. In this regression, the coefficient that multiplies threshold was the same for all frequencies, but each frequency was allowed to have a different additive constant. The variance accounted for by this regression was essentially the same (96%) for both linear-pressure and two-slope methods. Adding all four two-slope parameters to the regression resulted in no improvement. The overall variance in individual BTs accounted for by the predicted thresholds was better for the two-slope method (57%) compared to the linear-pressure method (39%). Consistent with this improvement, the residual error in predicting BTs from DPOAE threshold was less with the two-slope method (12.5 dB) compared to the linear-pressure method (14.9 dB).
Figure 8.
DPOAE thresholds for both the linear-pressure (upper panel) and two-slope (lower panel) methods. For the linear-pressure method, threshold was defined as the intercept of the fitted line with the L2 axis at zero pressure. For the two-slope method, threshold was defined as the L2 value on the fitted function corresponding to Ld=−25 dB SPL. Examples of the relation of the DPOAE threshold to the fitted I∕O function are illustrated by the triangles in Figs. 23.
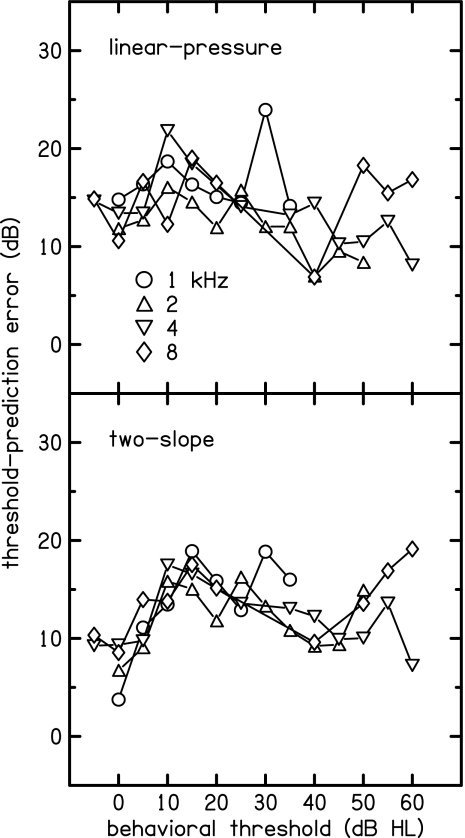
The distributions of residual errors across frequency and HL categories (shown in Fig. 9) reveal no obvious trends, except that the two-slope errors tend to be smaller when BTs are near zero, which follows from the summary provided in Fig. 8. The smaller prediction error at 0 dB HL may simply be due to the restriction on predicted BTs that prevented them from ever being less than zero, which was applied for both model predictions. The similarity between the two methods in the pattern of prediction errors suggests that these errors are predominantly due to variability inherent in I∕O-function characteristics rather than being due to any failure to represent essential features of the I∕O functions.
Figure 9.
Standard error of BT prediction based on DPOAE threshold for both the linear-pressure (upper panel) and two-slope (lower panel) methods. For both methods, the predicted BT was based on a linear regression of median DPOAE thresholds onto BT.
DISCUSSION
Previous studies have used a variety of methods to model individual I∕O functions. Boege and Janssen (2002) demonstrated that the linear-pressure fit produced DPOAE-threshold estimates that correlated with BT. Gorga et al. (2003a), using the linear-pressure method described by Boege and Janssen (2002), confirmed these results and suggested improvements by imposing limits on the ranges of both measured and predicted BTs. Oswald and Janssen (2003) suggested improvements in the linear-pressure threshold predictions by using weighted regressions that took into account the SNR of the measured DPOAE levels. Goldman et al. (2006) suggested an improvement to the linear-pressure method by applying a segmented-linear regression that incorporated more low-level responses into the regression, compared to Boege and Janssen (2002), giving it better detection performance. Compared to all of these previous methods, the two-slope method provides a better characterization of the rate of growth of DPOAE level over the entire range of stimulus levels. It is expected that the low-level slope parameter S1 provides a useful measure of low-level DPOAE growth rate that may be compared with other measures of cochlear-response growth.
Decreasing dependence of DPOAE level with increasing stimulus level is more likely to occur in individual I∕O functions than in group averages. Such “dips” or “notches” in individual I∕O functions do not occur consistently at particular levels, so they tend to be smoothed out by the averaging process. The presence of notches in I∕O functions implies contributions from multiple sources within the cochlea that sometimes cancel each other due to having different phase. Notches were ignored when fitting individual I∕O functions because of greater interest in characterizing response growth that might correlate with the perception of sound intensity than in the interaction of sources within the cochlea. Fitting notches in I∕O functions would require more complex models than the linear-pressure and two-slope models that were employed in this study, and it is unclear as to whether the added complexity would improve the understanding of correlations between DPOAE response growth and the percept of intensity.
Fitting group-average DPOAE I∕O functions is different than fitting individual I∕O functions. Dorn et al. (2001) fitted an ad-hoc equation to median I∕O functions from 77 subjects and observed some of the same trends with frequency, HL, and stimulus level as reported in the present study. Neely et al. (2003) noted the similarity in the shape of the average DPOAE I∕O functions for normal-hearing ears with the shape of the loudness function described by Fletcher and Munson (1933). However, the logarithmic function that successfully characterized both DPOAE growth and loudness growth in that study failed to fit individual DPOAE I∕O functions. Since only “average” functions of loudness growth were available in the Fletcher and Munson (1933) paper, it remains undetermined if the same problem exists for individual loudness functions as exists for individual DPOAE I∕O functions.
Keefe (2002), Keefe and Abdala (2007), and Sanford et al. (2009) fitted rotated logistic functions to averaged DPOAE I∕O functions from normal-hearing subjects. They suggested that the horizontal shift in the I∕O function represents the influence of forward middle-ear transmission, while the vertical shift represents the influence of reverse middle-ear transmission. In a similar way, the level parameters of the two-slope function, which are plotted as functions of frequency in Fig. 10, may be interpreted as representing the influence of forward and reverse middle-ear transmissions. Any frequency dependence in forward middle-ear transmission should be observed in the frequency dependence of Li and reverse transmission should be observed in Lo
Figure 10.
Frequency dependence of two-slope level parameters for representative HL categories (0, 20, 40, and 60 dB HLs). The input-level parameter Li (upper panel) includes the influence of forward middle-ear transmission, while the output-level parameter Lo (lower panel) includes the influence of reverse middle-ear transmission.
The influence of forward or reverse middle-ear transmission on these input- and output-level parameters would be expected to be preserved across HL category, because the etiology of these HLs is thought to be within the cochlea and not the middle ear, at least to the extent that a normal 226-Hz tympanogram just prior to DPOAE data collection indicates that the middle ear functions normally. The 6-dB rise in the input-level parameter Li between 1 and 4 kHz (upper panel, Fig. 10) appears similar at 0 and 20 dB HL and may represent the influence of forward middle-ear transmission. However, a more obvious feature of Li in Fig. 10 is the separation of 0 dB HL from the other HL categories. At most frequencies for the ears with BT=0 dB HL, the two-slope breakpoint typically occurs at input levels between 40 and 50 dB SPL, while the breakpoint moves above 60 dB SPL for ears with higher BTs. At f2=8 kHz, the median Li is above 60 dB SPL even for ears with thresholds of 0 dB HL. The output parameter Lo in the lower panel of Fig. 10 exhibits a notch at f2=5.6 kHz for all HL categories. Because the output occurs at the 2f1−f2 distortion frequency, a notch in Lo at f2=5.6 kHz suggests that there maybe a notch in the reverse middle-ear transmission in the vicinity of 3.6 kHz.
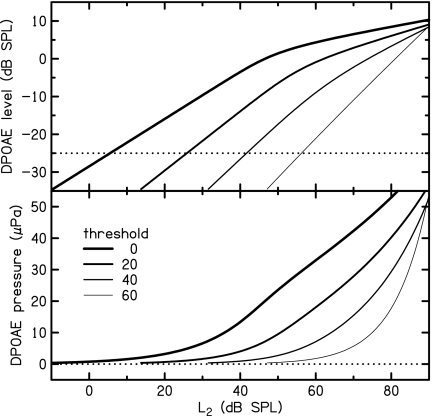
Although the two-slope fit requires more computational effort than the linear-pressure fit and provided only minor improvement (as evaluated by the BT prediction error, which decreased from 14.9 to 12.5 dB), its major advantage may be in providing a meaningful quantification of I∕O-function growth rate. Linear-regression coefficients of median two-slope parameters onto BT are listed in Table 2. These coefficients allow trends in I∕O-function shape to be visualized. For example, Fig. 11 demonstrates how model I∕O functions at 4 kHz change as BT increases. Specifically, the breakpoint (between the two slopes) moves to the right and downward, while the low-level slope increases. Similar trends could be observed by using the regression coefficients for other frequencies. In the lower panel of Fig. 11, the same function that has two slopes when plotted in dB approximates a linear function over the range of pressures from 10 to 50 dB. This observation helps to explain why the linear-pressure fit performs as well as it does in predicting BTs.
Table 2.
Linear-regression coefficients describing median I∕O-function parameters as functions of BT at each frequency. As an example, the I∕O functions based on these parameters at 4 kHz are shown in Fig. 11.
| C707 | C1000 | C1414 | C2000 | C2828 | C4000 | C5656 | C8000 | CBT | |
|---|---|---|---|---|---|---|---|---|---|
| Li | 53.4 | 52.4 | 51.1 | 50.1 | 51.9 | 50.3 | 53.0 | 54.7 | 0.3367 |
| Lo | 8.90 | 10.79 | 11.00 | 5.70 | 4.81 | 3.07 | −2.01 | 1.48 | −0.1798 |
| S1 | 0.602 | 0.689 | 0.716 | 0.698 | 0.622 | 0.627 | 0.708 | 0.650 | 0.0079 |
| S2 | 3.74 | 3.44 | 2.83 | 2.61 | 4.43 | 2.42 | 1.64 | 3.04 | −0.0368 |
Figure 11.
Two-slope model I∕O functions at 4 kHz for representative HL categories (0, 20, 40, and 60 dB HLs). DPOAE levels (dB SPL) are shown in the upper panel and the corresponding pressure (μPa) in the lower panel. These I∕O functions were calculated using the regression coefficients listed in Table 2.
The change in the shape with increasing HL category observed in the two-slope I∕O functions shown in Fig. 11 is similar to the shape change observed in the median I∕O functions in Fig. 1. However, few of the I∕O functions in Fig. 1 show two distinct slopes. One reason why the median I∕O functions lack the two-slope appearance may be that the input level at which the breakpoint occurs differs across subjects within the same HL category, causing the breakpoint to be smoothed and less distinct in the median I∕O functions. Individual differences in forward and∕or reverse middle-ear transmission might also add variability in the input and output levels associated with the breakpoint. Group data would obscure the breakpoint under these conditions as well. Another reason that the breakpoint is less distinct in the group-average I∕O functions may be that it is also less distinct in individual I∕O functions. This appears to be the case in the example selected for Fig. 3, where there appears to be more curvature in the data below the breakpoint than in the fitted two-slope function. Despite the inability of the two-slope function to represent curvature below the breakpoint, it appears to provide a useful description of DPOAE I∕O functions. The contribution to BT prediction error due to differences in the shape of the fitted and measured I∕O functions appears to be small in comparison to other sources of variability.
The shape of DPOAE I∕O functions for any particular L2 and f2 also depends on the selection of L1 and f1. In this study, the selection of L1 and f1 was based on the observations of Johnson et al. (2006), who described stimulus conditions (i.e., f2-dependent f2∕f1, and L1 and L2 combinations) thought to produce the largest Ld (on average) for normal-hearing subjects. If L1 and f1 had been chosen differently, the shapes of individual I∕O functions may have been different. The similarity between the I∕O-function shapes in Fig. 1 with those shown in Dorn et al., 2001 (Fig. 3), where L1 and f1 were chosen differently, suggests that minor differences in the selection of L1 and f1 do not produce large differences in the I∕O-function shapes.
It is possible that the growth rate of individual DPOAE I∕O functions is correlated with loudness-growth rate in the same individuals, given the dependence of both measurements on the integrity of the cochlea. It is not known, however, whether S1 or S2 will exhibit more correlation with loudness-growth rate. Determining the extent of the correlation between loudness-growth rate and either S1 or S2 will require that loudness functions and DPOAE I∕O functions both be measured in the same ears.
CONCLUSIONS
In addition to improving BT prediction, the two-slope function provides a description of individual DPOAE I∕O functions that allows cochlear-response growth to be quantified. The low-level slope of the two-slope function is typically near 0.7 dB∕dB in normal-hearing subjects and increases with HL. The variation of this low-level slope across subjects within the same HL category may represent individual differences in cochlear function, which could be compared to other measures of cochlear-response growth.
ACKNOWLEDGMENTS
The authors thank Liz Kennedy and Connie Converse for their contribution to data-collection efforts. This work is supported by the NIH∕NIDCD (Grant Nos. R01 DC8318, R01 DC 2251, F32 DC7536, and P30 DC4662).
References
- American National Standards Institute (1996). “Specifications for audiometers,” ANSI S3.6-1996, New York.
- Boege, P., and Janssen, T. (2002). “Pure-tone threshold estimation from extrapolated distortion product otoacoustic emission I∕O-functions in normal and cochlear hearing loss ears,” J. Acoust. Soc. Am. 111, 1810–1818. 10.1121/1.1460923 [DOI] [PubMed] [Google Scholar]
- Bonfils, P., and Avan, P. (1992). “Distortion-product otoacoustic emissions. Values for clinical use,” Arch. Otolaryngol. Head Neck Surg. 118, 1069–1076. [DOI] [PubMed] [Google Scholar]
- Burke, S., Rogers, A. R., Neely, S. T., Kopun, J. G., Tan, H., and Gorga, M. P. (2009). “Influence of calibration method on DPOAE measurements: I. Test performance,” presented at the American Auditory Society Meeting, Scottsdale, AZ.
- Dallos, P. J., and Harris, D. M. (1978). “Two-tone rate suppression in auditory-nerve fibers: Dependence on suppressor frequency and level,” Hear. Res. 49, 225–246. [DOI] [PubMed] [Google Scholar]
- Dorn, P. A., Konrad-Martin, D., Neely, S. T., Keefe, D. H., and Gorga, M. P. (2001). “Distortion product otoacoustic emission input∕output functions in normal and impaired ears,” J. Acoust. Soc. Am. 110, 3119–3131. 10.1121/1.1417524 [DOI] [PubMed] [Google Scholar]
- Fletcher, H., and Munson W. (1933). “Loudness: Its definition, measurement, and calculation,” J. Acoust. Soc. Am. 5, 82–108. 10.1121/1.1915637 [DOI] [Google Scholar]
- Goldman, B., Sheppard, L., Kujawa, S. G., and Seixas, N. S. (2006). “Modeling distortion product otoacoustic emission input∕output functions using segmented regression,” J. Acoust. Soc. Am. 120, 2764–2776. 10.1121/1.2258871 [DOI] [PubMed] [Google Scholar]
- Gorga, M. P., Stover, L., Neely, S. T., and Montoya, D., (1996). “The use of cumulative distributions to determine critical values and levels of confidence for clinical distortion product otoacoustic emission measurements,” J. Acoust. Soc. Am. 100, 968–977. 10.1121/1.416208 [DOI] [PubMed] [Google Scholar]
- Gorga, M. P., Neely, S. T., Bergman, B., Beauchaine, K. L., Kaminski, J. R., Peters, J., and Jesteadt, W. (1993). “Otoacoustic emissions from normal hearing and hearing-impaired subjects: Distortion product responses,” J. Acoust. Soc. Am. 93, 2050–2060. 10.1121/1.406691 [DOI] [PubMed] [Google Scholar]
- Gorga, M. P., Neely, S. T., Dierking, D. M., Dorn, P. A., Hoover, B. M., and Fitzpatrick, D. (2003b). “Distortion product otoacoustic emission suppression tuning curves in normal-hearing and hearing-impaired human ears,” J. Acoust. Soc. Am. 114, 263–278. 10.1121/1.1575751 [DOI] [PubMed] [Google Scholar]
- Gorga, M. P., Neely, S. T., Dierking, D. M., Kopun, J., Jolkowski, K., Groenenboom, K., Tan, H., and Stiegemann, B. (2008). “Low-frequency and high-frequency distortion product otoacoustic emission suppression in humans,” J. Acoust. Soc. Am. 123, 2172–2190. 10.1121/1.2839138 [DOI] [PMC free article] [PubMed] [Google Scholar]
- Gorga, M. P., Neely, S. T., Dorn, P. A., and Hoover, B. M. (2003a). “Further efforts to predict pure-tone thresholds from distortion product otoacoustic emission input∕output functions,” J. Acoust. Soc. Am. 113, 3275–3284. 10.1121/1.1570433 [DOI] [PubMed] [Google Scholar]
- Gorga, M. P., Neely, S. T., Ohlrich, B., Hoover, B., Redner, J., and Peters, J. (1997). “From laboratory to clinic: A large scale study of distortion product otoacoustic emissions in ears with normal hearing and ears with hearing loss,” Ear Hear. 18, 440–455. 10.1097/00003446-199712000-00003 [DOI] [PubMed] [Google Scholar]
- Gorga, M. P., Nelson, K., Davis, T., Dorn, P. A., and Neely, S. T. (2000). “Distortion product otoacoustic emission test performance when both 2f1−f2 and 2f2−f1 are used to predict auditory status,” J. Acoust. Soc. Am. 107, 2128–2135. 10.1121/1.428494 [DOI] [PubMed] [Google Scholar]
- Johnson, T. A., Neely, S. T., Garner, C. A., and Gorga, M. P. (2006). “Influence of primary-level and primary-frequency ratios on human distortion product otoacoustic emissions,” J. Acoust. Soc. Am. 119, 418–428. 10.1121/1.2133714 [DOI] [PMC free article] [PubMed] [Google Scholar]
- Keefe, D. H. (2002). “Spectral shapes of forward and reverse transfer functions between ear canal and cochlea estimated using DPOAE input∕output functions,” J. Acoust. Soc. Am. 111, 249–260. 10.1121/1.1423931 [DOI] [PubMed] [Google Scholar]
- Keefe, D. H., and Abdala, C. (2007). “Theory of forward and reverse middle-ear transmission applied to otoacoustic emissions in infant and adult ears,” J. Acoust. Soc. Am. 121, 978–993. 10.1121/1.2427128 [DOI] [PMC free article] [PubMed] [Google Scholar]
- Kim, D. O., Paparello, J., Jung, M. D., Smurzynski, J., and Sun, X. (1996). “Distortion product otoacoustic emission test of sensorineural hearing loss: Performance regarding sensitivity, specificity and receiver operating characteristics,” Acta Oto-Laryngol. 116, 3–11. 10.3109/00016489609137705 [DOI] [PubMed] [Google Scholar]
- Kummer, P., Janssen, T., and Arnold, W. (1998). “The level and growth behavior of 2f1−f2 distortion product otoacoustic emission and its relation to auditory sensitivity in normal hearing and cochlear hearing loss,” J. Acoust. Soc. Am. 103, 3431–3444. 10.1121/1.423054 [DOI] [PubMed] [Google Scholar]
- Liberman, M. C., and Dodds, L. W. (1984). “Single-unit labeling and chronic cochlear pathology. III. Stereocilia damage and alterations of threshold tuning curves,” Hear. Res. 16, 55–74. 10.1016/0378-5955(84)90025-X [DOI] [PubMed] [Google Scholar]
- Lonsbury-Martin, B. L., and Martin, G. K. (1990). “The clinical utility distortion-product otoacoustic emissions,” Ear Hear. 11, 144–154. 10.1097/00003446-199004000-00009 [DOI] [PubMed] [Google Scholar]
- Lonsbury-Martin, B. L., and Martin, G. K. (2007). “Distortion-product otoacoustic emissions in populations with normal hearing sensitivity,” in Otoacoustic Emissions: Clinical Applications, edited by Robinette M. S. and Glattke T. J. (Thieme, New York: ), pp. 107–130. [Google Scholar]
- Martin, G. K., Probst, R., and Lonsbury-Martin, B. L. (1990). “Otoacoustic emissions in human ears: Normative findings,” Ear Hear. 11, 106–120. 10.1097/00003446-199004000-00005 [DOI] [PubMed] [Google Scholar]
- Mills, D. M., Norton, S. J., and Rubel, E. W. (1993). “Vulnerability and adaptation of distortion product otoacoustic emissions to endocochlear potential variation,” J. Acoust. Soc. Am. 94, 2108–2122. 10.1121/1.407483 [DOI] [PubMed] [Google Scholar]
- Mills, D. M., and Rubel, E. W. (1994). “Variation of distortion product otoacoustic emissions with furosemide injection,” Hear. Res. 77, 183–199. 10.1016/0378-5955(94)90266-6 [DOI] [PubMed] [Google Scholar]
- Neely, S. T., and Liu, Z. (1994). “EMAV: Otoacoustic emission averager,” Technical Memorandum 17, Boys Town National Research Hosptial, Omaha, NE.
- Neely, S. T., Gorga, M. P., and Dorn, P. A. (2003). “Cochlear compression estimates from measurements of distortion-product otoacoustic emissions,” J. Acoust. Soc. Am. 114, 1499–1507. 10.1121/1.1604122 [DOI] [PubMed] [Google Scholar]
- Oswald, J. A., and Janssen, T. (2003). “Weighted DPOAE input∕output functions: A tool for automatic assessment of hearing loss in clinical application,” Z. Med. Phys. 13, 93–98. [DOI] [PubMed] [Google Scholar]
- Probst, R., Lonsbury-Martin, B. L., and Martin, G. K. (1991). “A review of otoacoustic emissions,” J. Acoust. Soc. Am. 89, 2027–2067. 10.1121/1.400897 [DOI] [PubMed] [Google Scholar]
- Rhode, W. S. (2007). “Basilar membrane mechanics in the 6–9 kHz region of sensitive chinchilla cochleae,” J. Acoust. Soc. Am. 121, 2792–2804. 10.1121/1.2718397 [DOI] [PubMed] [Google Scholar]
- Rogers, A. R., Burke, S., Neely, S. T., Kopun, J. G., Tan, H., and Gorga, M. P. (2009). “Influence of calibration method on DPOAE measurements: I. Threshold prediction,” presented at the American Auditory Society Meeting, Scottsdale, AZ.
- Ruggero, M. A., and Rich, N. C. (1991). “Furosemide alters organ of corti mechanics: Evidence for feedback of outer hair cells upon the basilar membrane,” J. Neurol. 11, 1057–1067. [DOI] [PMC free article] [PubMed] [Google Scholar]
- Ruggero, M. A., Rich, N. C., Recio, A., Narayan, S. S., and Robles, L. (1997). “Basilar-membrane responses to tones at the base of the chinchilla cochlea,” J. Acoust. Soc. Am. 101, 2151–2163. 10.1121/1.418265 [DOI] [PMC free article] [PubMed] [Google Scholar]
- Sanford, C. A., Keefe, D. H., Fitzpatrick, D. F., and Gorga, M. P. (2009). “Estimating forward and reverse ear-canal and middle-ear transmission in infants,” presented at the American Auditory Society Meeting, Scottsdale, AZ.
- Scheperle, R. A., Neely, S. T., Kopun, J. G., and Gorga, M. P. (2008). “Influence of in-situ, sound-level calibration on distortion-product otoacoustic emission variability,” J. Acoust. Soc. Am. 124, 288–300. 10.1121/1.2931953 [DOI] [PMC free article] [PubMed] [Google Scholar]
- Siegel, J. H. (2007). “Calibrating otoacoustic emission probes,” in Otoacoustic Emissions: Clinical Applications, edited by Robinette M. S. and Glattke T. J. (Thieme, New York: ), pp. 403–427. [Google Scholar]
- Siegel, J. H., and Hirohata, E. T. (1994). “Sound calibration and distortion product otoacoustic emissions at high frequencies,” Hear. Res. 80, 146–152. 10.1016/0378-5955(94)90106-6 [DOI] [PubMed] [Google Scholar]


