Abstract
The purpose of this study was to develop a method by which a vowel-consonant-vowel (VCV) utterance based on x-ray microbeam articulatory data could be separated into a vowel-to-vowel transition and a consonant superposition function. The result is a model that represents a vowel sequence as a time-dependent perturbation of the neutral vocal tract shape governed by coefficients of canonical deformation patterns. Consonants were modeled as superposition functions that can force specific portions of the vocal tract shape to be constricted or expanded, over a specific time course. The three VCVs [əpɑ], [ətɑ], and [əkɑ], produced by one female speaker, were analyzed and reconstructed with the developed model. They were shown to be reasonable approximations of the original VCVs, as assessed qualitatively by visual inspection and quantitatively by calculating rms error and correlation coefficients. This establishes a method for future modeling of other speech material.
INTRODUCTION
It is well known that speech does not merely consist of a serial concatentation of individual speech sounds, but rather a continuous blending of one sound into another. Production of a blended acoustic stream requires that movements of the articulatory structures be temporally and spatially coordinated such that they are engaged in generating more than one sound segment at any instant of time. This process of overlapping speech movements, commonly referred to as coarticulation (e.g., Kozhevnikov and Chistovich, 1965; Öhman, 1966; Kent and Minifie, 1977) or coproduction (e.g., Fowler, 1980), must be included in the development of any realistic model of speech production. Because movement of the articulators has the collective effect of determining the shape of the vocal tract airspace, and because the shape of the airspace is the most direct connection to the acoustic resonances expressed in the speech signal as formants, it is important to develop a model that directly relates overlap of phonetically-relevant gestures to the time-dependent changes of the tract shape during production of speech. The purpose of this study was to determine whether realistic changes in vocal tract shape can be accurately represented with a model where coarticulated speech is produced by superimposing consonant gestures on an ongoing sequence of vowel transitions.
This particular view of coarticulation seems to have originated with Öhman’s (1966) spectrographic analysis of vowel-consonant-vowel (VCV) utterances. The results suggested that vowels and consonants are generated by two parallel production systems and place coincident demands on the same articulatory structures. Thus, a VCV is considered to be produced as a vowel-vowel (VV) sequence upon which a consonant gesture is superimposed. Based on a cineradiographic study of ∕hə’CV∕ utterances, Perkell (1969) similarly concluded that production of vowels and consonants is carried out by two functionally different types of articulatory activity. He noted that consonant articulations are generally faster and require more precise timing than vowel articulations. This led to the hypothesis that articulatory activity could be divided into two classes in which the extrinsic speech musculature is utilized primarily for vowel production, whereas the intrinsic musculature of the tongue and lips executes the place, manner, and degree of a specific consonant that is additively superimposed on the overall vocal tract posture provided by the extrinsic musculature. That is, rapid, precise consonantal gestures are superimposed on an underlying vowel gesture. Gracco (1992) also referred to a functional division of vocal tract movement into two general categories: “…those that produce and release constrictions (valving), and those that modulate the shape or geometry of the vocal tract.” Löfqvist and Gracco (1999) later reported that, during production of a VCV, tongue movement toward the final vowel often began before the consonant closure had occurred, and further that most of the movement from the initial vowel occurred during the consonant closure. Both findings suggest that the overall shaping of the vocal tract continues while constrictions are imposed and released.
The paradigm of functional division of the articulatory system into separate vowel and consonant classes has influenced various control strategies for articulatory and vocal tract models. Öhman (1967) followed his spectrographic study by proposing a model that allows for interpolation of the midsagittal cross-distance (width) of one vowel shape to another over the time course of an utterance. Simultaneously, a consonant constriction function can be activated that varies over the same time course as the vowel component. At each successive point in time, the consonantal function is superimposed on the modeled vowel substrate to produce a composite tract shape. Nakata and Mitsuoka (1965) and Ichikawa and Nakata (1968) used the idea of superimposing a consonant on a VV transition in a rule-based speech synthesizer. Similarly, Båvegård (1995) and Carré and Chennoukh (1995) both reported vocal tract area function models where consonant constrictions are superimposed on an interpolation of a vowel-to-vowel transition. Browman and Goldstein’s (1990) development of “articulatory phonology” also reflects the ideas suggested by Öhman’s work. In their view, speech is produced by a series of overlapping gestures created by activation of “tract variables” such as constriction location and degree of the tongue body and tip. Models based on similar conceptualizations of speech production have been proposed by Fowler and Saltzman (1993), Byrd (1996), and Tjaden (1999).
More recently, Story (2005a) described a model of the vocal tract area function that incorporates many aspects of the type of speech production system suggested by Öhman (1966, 1967) and Perkell (1969). The model consists of multiple hierarchical tiers,1 each of which is capable of imposing particular types of perturbation on the vocal tract shape. In the first tier, vowels and vowel-to-vowel transitions are produced by perturbing a phonetically-neutral vocal tract configuration with two canonical deformation patterns called modes. The modes, which were derived by principal component analysis, are shaped such that they efficiently exploit the acoustic properties of the vocal tract (Story, 2007a), and tend to be common across speakers (Story and Titze, 1998; Story, 2005b, 2007b). Consonant production results from a second tier of perturbation that imposes severe constrictions on the underlying vowel or evolving VV transition. The constriction functions are precisely defined by the range along the tract length that is affected by the constriction, the constriction location, the cross-sectional area at the point of maximum constriction, and by the timing of the activation.
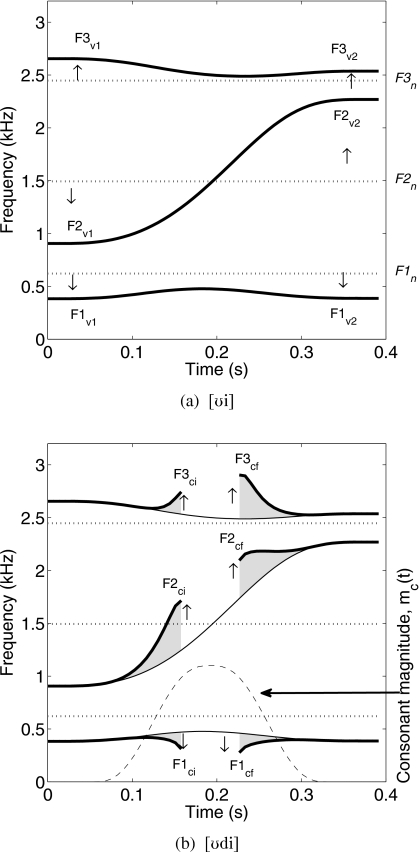
A speech signal produced by this model2 carries information characteristic of the successive tiers of vocal tract structure or movement on which it is built. For example, the idiosyncratic features of the neutral vocal tract shape will set the acoustic background on which vowel transitions generated by the first tier are superimposed. This is demonstrated in Fig. 1a where time-dependent formant contours are shown for a transition from [ʊ] to [i] simulated by the model in terms of area function changes. At any point in time, the formants along the transition can be considered to be perturbed or deflected away (as suggested by the up and down arrows) from the formants of the underlying neutral tract (shown with dotted lines). The characteristics of the vowel transitions, in turn, provide the acoustic background on which consonantal perturbations are imposed by the second tier of the model. Demonstrated in Fig. 1b are the formant contour effects that result from perturbing the [ʊi] transition with a consonant constriction intended to approximate a [d]. For comparison purposes, the [ʊi] transition and neutral tract formants are also shown in this figure, along with the time course of the consonant magnitude, denoted as mc(t). The consonant magnitude indicates the period of time in which the consonant perturbation affects the vocal tract shape [i.e., for mc(t)>0] and causes the formant frequencies to be deflected upward or downward relative to those formants that would exist in the absence of the consonant (see arrows).
Figure 1.
Demonstration of multiple “layers” of vocal tract perturbations to produce a VCV. (a) Time-varying formant frequencies (thick solid lines) that result from perturbing a neutral vocal tract shape with vowel-to-vowel (VV) sequence; the Fn’s are the formants for the neutral tract shape and shown with dotted lines, Fv’s are the formants in an approximately stable portion of the initial and final vowels. (b) Time-varying formant frequencies (thick solid lines) that result from perturbing the VV sequence (thin solid lines) with a consonant perturbation approximately representative of [d]; the dashed line indicates the time course of the consonant activation whose amplitude ranges from 0 to 1 (not Hz) and the Fci’s and Fcf’s are formant frequencies that exist at the point where the occlusion begins and ends.
Although utterances can be simulated with this model, temporal activations of the vowel and consonant elements have been mostly prescribed by ad hoc rules (Story, 2005a) or formant-to-coefficient mapping (Story and Titze, 1998). It was shown in Story (2007b), however, that canonical modes similar to those on which the vowel tier is based could be extracted from the articulatory data available in the University of Wisconsin-Madison’s x-ray microbeam (XRMB) database (Westbury, 1994). Specifically, the x-y coordinates of fleshpoint pellets, along with the outline of the hard palate, were used to approximate the shape of the oral part of the vocal tract as a midsagittal cross-distance function for eleven vowels. A principal component analysis (PCA) performed on speaker-specific sets of these cross-distance functions revealed mode shapes essentially the same as those derived from MRI-based (magnetic resonance imaging) area function sets in previous research (e.g., Story and Titze, 1998; Story, 2005b; Mokhtari et al. 2007), even though only the oral portion of the vocal tract was available for analysis. Further analysis demonstrated that VV transitions could be accurately represented with time-dependent scaling of the modes superimposed on the mean cross-distance function, thus validating the first tier of the Story (2005a) model. It remains a question though whether naturally spoken VCVs can be accurately represented by modeling them as a VV transition with a superimposed consonant function, as prescribed by the second tier of the model.
The aim of this study was to address this question by extracting time-varying cross-distance functions from XRMB data, with the method described in Story (2007b), for VCV utterances with stop consonants, and determining how well their time course can be represented with a model similar to Story (2005a) but formulated for cross-distance, rather than area. The assumption was that the initial and final vowels in a VCV can be well represented by scaling coefficients of the vowel-based modes. These coefficients can then be interpolated to generate the underlying VV transition. It was also assumed that the consonant superposition function can be determined from the shape of the vocal tract during the closure period, and represented with parameters such as constriction location, extent, degree, and temporal activation.
Described in Secs. 2, 3, 4, 5 is a step-by-step process for transforming the x-y coordinates of articulatory fleshpoints during production of a VCV to the components of a vocal tract model based on superimposing a consonant gesture on a vowel substrate. Since the outcome of early steps in the process are needed for later steps, each section combines explanations of the method with intermediate results.
MEASUREMENT OF TIME-VARYING CROSS-DISTANCE FUNCTIONS
Speaker and speaking tasks
The speaker chosen from the XRMB database for the present study was JW26. This female speaker was 24 years old at the time of data collection and her dialect base is listed as Verona, Wisconsin (Westbury, 1994). She was also one of the four speakers studied in Story (2007b) so that vocal tract modes have already been reported for her vowels. These will be used subsequently in Sec. 3. The XRMB protocol for each speaker in the database contains a set of VCVs in the form of [əCɑ], where “C” is 1 of 21 different consonants (task number 16, file “tp016”). Only those VCVs with the unvoiced stop consonants [p, t, k] were analyzed in this study.
Cross-distance functions from XRMB data
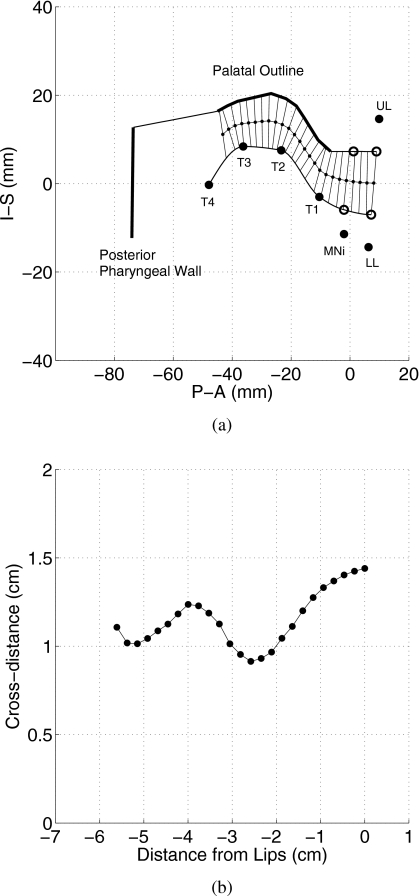
The XRMB data consist of time-dependent displacements of gold pellets affixed to four points on the tongue, two on the jaw, and one on each of the upper and lower lips. During data collection, x-y coordinates of each pellet were acquired at a sampling interval of 6.866 ms (Westbury, 1994). To extract a representation of the vocal tract shape, the same technique was used as described by Story (2007b) where a midsagittal cross-distance function can be determined from a two-dimensional vocal tract profile, constructed from pellet coordinates, for any time frame of data produced by a given speaker. Although the details of the technique will not be repeated here, the process is demonstrated graphically in Fig. 2. The positions of the pellets on the tongue (T1–T4), incisor (MNi), lower lip (LL), and upper lip (UL) are shown as filled circles in Fig. 2a for a specific time frame representative of JW26’s [æ] vowel. Also shown is the palatal outline and an approximation of the posterior pharyngeal wall. The open circles denote derived “phantom” points (see Story, 2007b, p. 3774) that more accurately represent the interface of tissue and air than do the actual pellets on the lips and jaw.3 The inferior vocal tract profile is generated with a spline fit through the four tongue points and the two lower phantom points. Similarly, the upper profile is constructed with a spline fit through the upper two phantom points and the palatal outline. The next step is to use an iterative bisection algorithm to find the centerline through the airspace, extending from the lips back to the most posterior point of the palatal outline. Finally, the distance from the lower to upper profile is measured perpendicularly at a succession of points along the centerline. This collection of cross-distances can be plotted as a function of the distance from the lips, as shown in Fig. 2b. It is noted that the number of points in a particular cross-distance function depends on the vocal tract shape at a given time frame (see Story, 2007b, p. 3775). For all uses of the algorithm in this study and previously in Story (2007b), each cross-distance function was resampled with a cubic spline so that it contains 33 elements separated by equal length intervals.
Figure 2.
Demonstration of finding a cross-distance function from XRMB data. (a) Sagittal view of a time frame representative of JW26’s [æ] vowel. A superior and an inferior vocal tract boundary are generated based on the tongue points (T1-T4), palatal outline, pharyngeal wall, and four phantom points (open circles) related to the mandible and lips. The lines extending across the vocal tract are perpendicular to the centerline and comprise the cross-distance measurements. (b) Resulting cross-distance function; note that the x-axis indicates distance into the vocal tract from the lips, where the lips are at 0 cm.
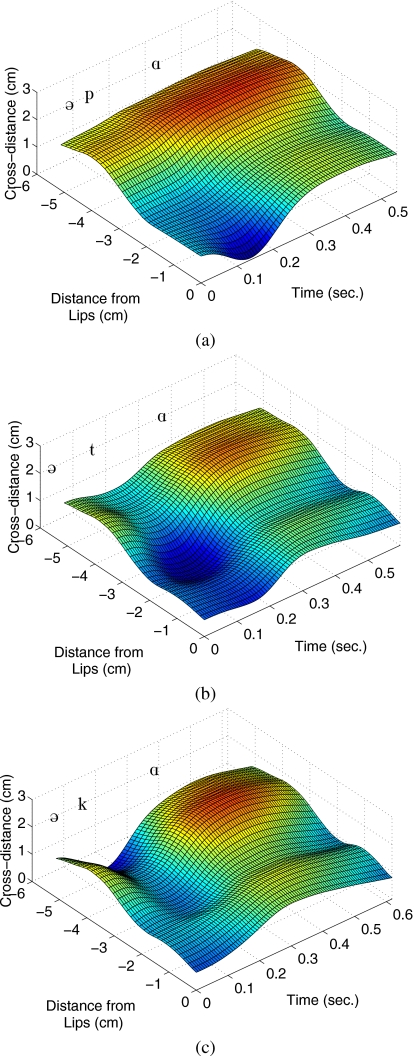
This same process can be performed over consecutive XRMB time frames to generate a time-dependent cross-distance function. These will, in general, be referred to as DVCV(x,t) where x is the distance from the lips and t is time. Shown in Fig. 3 are three-dimensional (3D) surface plots of the DVCV(x,t)’s determined for JW26’s utterances [əpɑ], [ətɑ], and [əkɑ]. The three phonetic symbols on each plot indicate the approximate temporal location of the initial vowel [ə], the consonant, and the final vowel [ɑ], respectively. It is noted that, as expected, the consonant constriction is moved progressively in the posterior direction for the [p], [t], and [k] consonants. Because the cross-distance analysis only extends as far back as the posterior end of the palatal outline, the representation of the [k] is somewhat incomplete. That is, the point of maximum constriction is included, along with the vocal tract shape anterior to it, but the tract shape posterior to the constriction is not available. Although difficult to discern from the figures, it is also noted that the cross-distance does not necessarily become zero at the point of constriction. For points on the tongue this is a result of the low spatial resolution of the data. That is, if the point of contact of the tongue with an opposing surface is between two pellets, the cross-distance algorithm will not account for it. At the lips, an incomplete occlusion may appear in the cross-distance function for a bilabial closure because of potentially different degrees of compression force. Corrections for the “non-zero” occlusions based on various mathematical functions could perhaps be proposed. For the present study, however, it was decided not to alter the measured cross-distances and to assume that the spatial and temporal characteristics of the consonant constriction are accurately depicted. These three VCV surfaces served as the vocal tract shape data for which the subsequently described method was developed and tested.
Figure 3.
Time-varying cross-distance functions for VCVs spoken by JW26. The phonetic symbols are approximately aligned with the time frame where the respective vowels or consonants are expressed in the cross-distance function. (a) [əpɑ], (b) [ətɑ], and (c) [əkɑ].
RECOVERY OF THE VV SEQUENCE
The method for separating the vowel and consonant parts of a VCV cross-distance function is based on the assumption that
| (1) |
where DVV(x,t) is the vowel-to-vowel (VV) cross-distance function that would exist in the absence of a consonant, C(x,t) is a consonant superposition function that perturbs the VV by imposing a constriction at a specific time and location, and Δ is the distance between each of the N=33 consecutive elements in a cross-distance function. Thus, the aim of the method is to extract a representation of both DVV(x,t) and C(x,t) from a measured DVCV(x,t).
In this section, a technique is described for approximating the vowel-to-vowel sequence DVV(x,t) that underlies a given VCV. Using the concept of vocal tract modes, the technique effectively allows for the “recovery” of the VV sequence from the cross-distance functions generated in the previous section.
Vocal tract modes
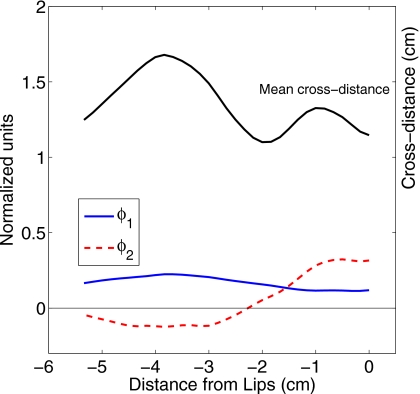
It was assumed that the VV cross-distance function can be represented by time-dependent linear combinations of vocal tract modes such as those reported in Story (2007b). In that study cross-distance functions were obtained for 11 vowels from each of four speakers. Vocal tract modes were then computed, with principal component analysis, for each speaker’s set of vowels. The two modes that accounted for nearly 99% of the variance in JW26’s set of cross-distance functions are shown in the lower part of Fig. 4. The first mode ϕ1 is plotted with a solid line and the second mode ϕ2 is shown as a dashed line. The mean cross-distance function (across the eleven vowels) Ω is shown in the upper part of the plot. Although plotted in the same figure for convenience, the units for the modes and mean cross-distance are not the same, as indicated on the left and right hand sides of the plot, respectively.
Figure 4.
Vocal tract modes and mean tract shape for JW26 (see Story 2007b). The modes (ϕ1 and ϕ2) are shown in the lower part of the plot as solid and dashed lines and the mean cross-distance is shown in the upper part. Note that the axis label corresponding to the modes is on left side, whereas for the mean tract shape the label is on the right.
Cross-distance functions can be reconstructed with high accuracy for the original 11 vowels with the relation,
| (2) |
where ϕ1(x) and ϕ2(x) are the modes, Ω(x) is the mean cross-distance function, x is the distance from the lips, and q1 and q2 are weighting coefficients that generate a specific vocal tract shape.
Time-varying mode coefficients
The purpose of this step was to find time-dependent mode coefficients representative of the transition from initial to final vowel for each of the VCV utterances shown previously as time-varying cross-distance functions in Fig. 3. For any given VCV cross-distance function, it was hypothesized that the portions of the utterance not affected by the consonant can be fairly well approximated by a particular combination of the q1 and q2 coefficients of Eq. 1. It follows that those portions of the VCV that are affected by the consonant will be poorly represented by the mode coefficients. Thus, the first step in recovering the vowel and consonant components of the VCV consists of finding mode coefficients that provide a best fit to the cross-distance function at each time frame. The error between measured and reconstructed cross-distances should be low during the initial and final vowel portions and high during the consonant, and thus can provide a means of segmenting the VCV.
To determine coefficient values for the cross-distance function within each time frame of a VCV, a Nelder–Mead Simplex optimization technique (Lagarias et al., 1998; the Mathworks, 2008) was used to find the [q1,q2] coefficients that minimized the squared error between a measured cross-distance function and that constructed with Eq. 2. The minimum error within each frame can be used to generate an error function over the duration of the utterance.
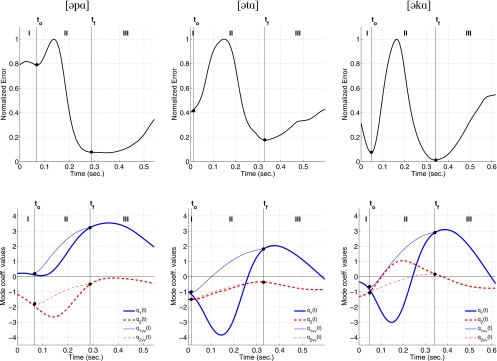
Applying this process to the three DVCV(x,t)’s in Fig. 3 produces the error functions shown in the top row of Fig. 5. Although they represent the squared error at each time frame, for purposes here, each one is normalized so that the maximum error is equal to 1.0. The points denoted with filled circles, labeled as to and tf, indicate the time instants where local minima of the error functions occur, suggesting that the particular combination of coefficients determined at these points provides a good fit to the vocal tract shape. The vertical lines that pass through each of the filled circles divide the VCV into three regions. The first region (“I” in the figure), extending from the beginning of the utterance to the first local minima to, is the domain of the initial vowel. Between to and tf is region II, a time segment where the error increases rapidly due to the influence of the consonant constriction on the underlying VV transition, and then decreases toward zero as the consonant vanishes. Region II is assumed to be a transition zone where the speaker simultaneously moves the vocal tract from the initial to final vowel shape and executes the onset and offset of a consonantal constriction. Region III extends from the second minimum tf to the end of the utterance, and is assumed to be the domain of the final vowel.
Figure 5.
Normalized error functions (top row) and time-varying mode coefficients (bottom row) for [əpɑ] (left column), [ətɑ] (middle column), and [əkɑ] (right column). The error functions indicate the differences between the original VCV cross-distance functions and those constructed by the mode-coefficient fitting algorithm. The bottom row of plots show the time-varying mode coefficients derived from the fitting algorithm (thick lines) and the corrected versions (thin lines) based on interpolation. The regions in each plot are defined by the points, to and tf, which denote the local minima on either side of the peak in the respective error function.
Ideally, the error within regions I and III would drop to zero for any given VCV because the vowel-based modes would provide an exact match to the actual cross-distance function. Although each error function plot indicates a tendency toward zero in these regions, none of the three actually becomes zero at any point in time. For [əpɑ], there is a fairly large error in region I indicating that the cross-distance functions are not well represented by the vowel-based modes, likely due to the influence of the consonant already during this period of time. For [ətɑ], a local minimum does not actually exist on the left side of the error peak, so to was manually chosen at a point where the slope of the error was reduced; this was done so that three regions could still be defined. The error function for [əkɑ] contains two clearly defined minima that bracket the error peak but the error does rise at the beginning of the utterance. In all three cases, the error increases toward the end of the utterance suggesting that the speaker may have been moving the vocal tract toward a less vowel-like shape that could not be well represented by the mode coefficients.
In the second row of Fig. 5 are plots of the mode coefficients as they vary over the time course of each of the three VCV utterances. The same three regions defined by the error functions are also indicated in each of these three plots. The thick lines (both solid and dashed) represent the q1 and q2 coefficients derived by the frame-by-frame optimization process. As would be expected because of the same target vowels, they are similar, although certainly not identical, across the three utterances in regions I and III. In region II, however, the coefficients differ across the three VCVs because the optimization process was attempting to find a vocal tract shape that would fit both the vowel shape and the given consonant constriction during this period.
To remove the effect of the consonant constriction from the temporal pattern of the mode coefficients it was assumed that, within region II, they could be replaced with an interpolation of the coefficient values at to (boundary of regions I and II), and their values at tf (boundary of regions II and III). With the interpolation specified as a sinusoidal function, the q1(t) and q2(t) coefficients over the entire duration T of the utterance were replaced with
| (3) |
where n=[1,2], and qno and qnf are the coefficient values at the boundaries of region II. The qnVV(t) were also smoothed with a tenth order FIR filter that had a low-pass cutoff frequency of 10 Hz. The thin lines (both solid and dashed) visible in region II of the three mode coefficient plots (Fig. 5) are the result of interpolation with Eq. 3, and are representative of the underlying VV transition. Although not visible in the plots, note that q1VV(t)=q1(t) and q2VV(t)=q2(t) in regions I and III. The filled circle corresponding to to on the q2VV(t) trace for [əpɑ] is displaced slightly upward from the q2(t) trace. This is due to the mild filtering that is applied after the interpolation. Other interpolation schemes such as cosine, minimum jerk, or linear were also tested, but the sinusoidal function seemed to best serve the purpose of approximating the time-dependence of the coefficients during the portion of the vowel transition that is affected by the constriction. Kröger et al. (1995) made use of a similar sinusoid-based function for estimating movement trajectories of articulatory fleshpoints.
It is noted that division of the VCV into the three specific regions is critical for separating the vowel and consonant components. Temporal parsing by any other criterion would undermine the hypothesized representation of a VCV as a constriction superimposed on a vowel transition, and would reduce the effectiveness of the interpolation in region II to remove the influence of the consonant.
Reconstruction of the hypothetical VV sequence
The interpolated time-varying mode coefficients can now be used to construct a hypothetical cross-distance history over the duration of the vowel sequence with a time-dependent version of Eq. 2,
| (4) |
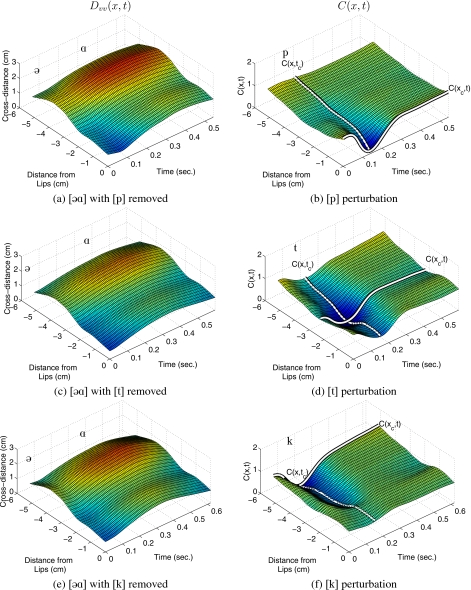
in which q1VV(t) and q2VV(t) are functions of time, and ϕ1(x), ϕ2(x), and Ω(x) remain unchanged as functions of the distance from the lips. Time-varying vowel-to-vowel cross-distance functions were generated with the coefficients q1VV(t) and q2VV(t) from the each of the plots in the bottom row of Fig. 5, and are shown in the left column of Fig. 6. There are some subtle differences, but, as expected, each plot shows a similar time-progression of the cross-distance from the initial [ə] to the final [ɑ] in the absence of the consonant constriction. Thus a hypothetical underlying VV transition has been recovered, in each case, from the original VCV.
Figure 6.
In the left column are the hypothetical VV sequences, Dvv(x,t), recovered from the three original VCVs, and shown in the right column are the consonant perturbation functions C(x,t). The product of the VV sequences with the consonant perturbations would reconstruct the original cross-distance functions. The white lines in the right column plots indicate the time frame and spatial location corresponding to the maximum constriction.
RECOVERY OF THE CONSONANT SUPERPOSITION FUNCTION
Separation of vowel and consonant portions of VCVs
With DVV(x,t) known for a given VCV, the time-dependence of the consonant constriction can now be recovered by rearrangement of Eq. 1 such that
| (5) |
This is a ratio of the measured VCV to hypothetical VV cross-distances at every point in time and space. In regions I and III, as defined previously, this ratio should ideally be 1.0 since the cross-distances are representative of the same vowels in both the VCV and VV. The values of C(x,t) in region II are expected to deviate toward 0.0 due to the influence of the consonant constriction.
With Eq. 5, C(x,t) functions were calculated for the three VCVs and are shown in the right column of Fig. 6. In the initial and final vowel portions of each case, the functions are fairly flat and nearly equal to one along the posterior extent from the lips into the oral cavity. The slight deviations away from one in the vowel portions result from the inexact match of the vowel-based model to the measured cross-distance functions. Such deviations are expected based on the nonzero values present in regions I and III of the error functions (Fig. 5). In the vicinity of the consonant, each C(x,t) decreases toward a minimum value near zero, revealing the onset and offset of the constriction perturbation in the absence of the vowel substrate. The temporal pattern of each constriction can be best seen along the spatial point xc, where C(xc,t) is highlighted with a white line. The shape of C(x,t) at time instant tc represents the fully expressed consonant constriction. C(x,tc) functions are indicated on each of the plots as white lines extending from the lips back into the vocal tract.
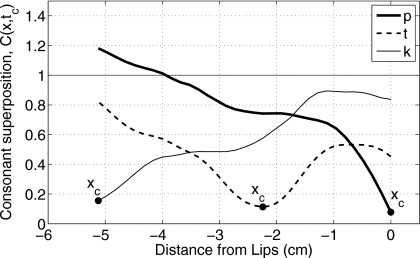
To provide a clearer picture of the overall shape of the constrictions, all three C(x,tc) functions are replotted in Fig. 7. The constriction minima xc, marked with filled circles, are located at the lips for [p], at −2.3 cm from the lips for [t], and at −5.1 cm for [k]. It is noted that the constriction for [k] is located at the most posterior point afforded by the XRMB data. This means that the C(x,tc) for [k] captures only the anterior portion of the constriction shape. It is also noted that even though each VCV contains a stop consonant, none of the three C(x,tc) functions in Fig. 7 actually becomes zero, suggesting that a complete occlusion is never attained. This is an artifact due to the low spatial resolution as discussed previously in Sec. 2B.
Figure 7.
Consonant perturbation (superposition) functions for [p, t, k] at the point in time representative of maximum constriction (tc). These plots provide a clearer view of the white lines C(x,tc) shown previously in Fig. 6.
Time dependence of the consonant perturbation function
The operations described to this point allow for a given VCV cross-distance function to be effectively separated into the “VV” and “C” components of Eq. 1. In this section, additional operations are described for estimating the temporal activation of the consonant constriction.
The spatial configuration of the constriction is assumed to be fully expressed at time instant tc as the function C(x,tc); these were shown previously in Fig. 7 for each of the three VCVs. This function can be represented in general as
| (6) |
where mc(tc) is a scaling function defined to be equal to one at tc, and f(x) is a spatial shaping function that, when subtracted from 1.0 at all values along the x-axis, will produce C(x,tc). At all other time instants, C(x,t) is considered to be a scaled version of C(x,tc) that returns to a value of 1.0 along the entire x-axis when the consonant effect is absent.
The time course of the consonant perturbation can be determined from the variation along C(xc,t), where xc is the constriction location. These functions were shown as white lines in the right column plots of Fig. 6. Note that each C(xc,t) tracks the temporal variation of the point of maximum constriction, and is perpendicular to the corresponding spatial variation. Each C(xc,t) can be written as
| (7) |
where mc(t) is the time-dependent consonant magnitude. The mc(t) function can be determined from known quantities by first substituting Eq. 7 into Eq. 1 (evaluated at xc) to give the relation
| (8) |
Rearranging Eq. 6 and evaluating at xc yields
| (9) |
which can be substituted into Eq. 8. Solving for mc(t) results in
| (10) |
where all quantities on the right-hand side of the equation are known from previous measurements and analyses.
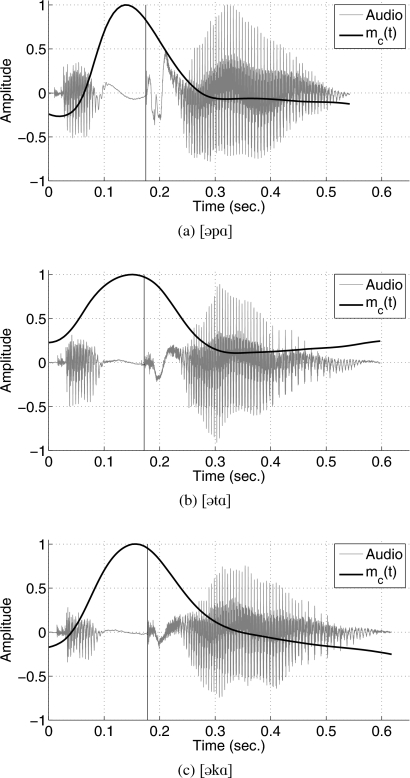
Plots of the magnitude mc(t) calculated with Eq. 10 for each VCV, along with the corresponding audio signal are shown in Fig. 8. In all three cases, the peak [where mc(t)=1] occurs just prior to the plosive burst as indicated by the vertical lines, and is the point at which the corresponding consonant function would be fully superimposed on the underlying VV transition. On either side of the peaks, mc(t) decreases rapidly indicating progressively less consonantal effect on the vocal tract shape. Ideally the consonant magnitude would drop to zero in these regions (i.e., no consonantal influence), but for [p] and [k], it decreases to values slightly below zero, and for [t], never reaches zero. The imperfect match of the hypothetical VV transitions to the non-consonantal portions of the original utterances causes the numerator of Eq. 10 to be non-zero during these time periods, thus generating the positive or negative offset observed in the mc(t) functions. Nonetheless, it is apparent from these plots that the influence of the consonant begins prior to the acoustic offset of the initial vowel, and seems to subside in less than 0.1 s after the acoustic onset of the final vowel. These values are approximately representative of the three utterances spoken by the speaker JW26 and are not intended to characterize the consonants in general, but rather to show the superposition effect of the consonant on the underlying vowel substrate.
Figure 8.
Consonant magnitude functions mc(t) calculated with Eq. 10 for each of the three VCVs. Also shown in the background are the corresponding audio signals. The vertical line in each plot marks the time instant of the plosive burst.
RECONSTRUCTION OF THE ORIGINAL VCVs
The mc(t) functions derived in the previous section can now be used to reconstruct the time-varying cross-distance functions for each of the respective VCVs. First, from Eq. 6
| (11) |
which can be substituted into
| (12) |
to produce a consonant superposition function. Next, Eq. 1 is rewritten with new notation as
| (13) |
where the primes indicate an approximation to the previous similar quantities.
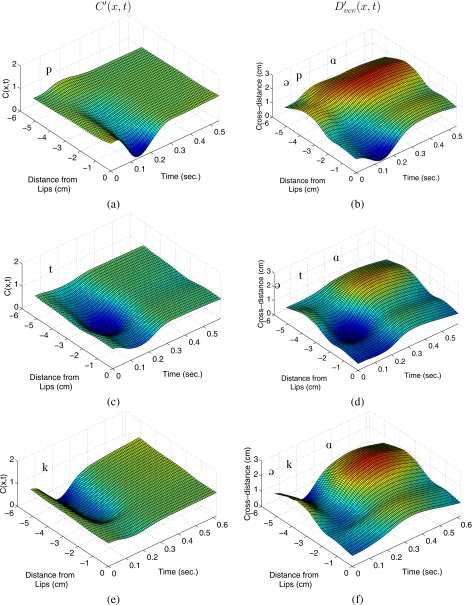
Using Eqs. 12, 13, the C′(x,t) was recovered and reconstructed for [əpɑ], [ətɑ], and [əkɑ]. The resulting time-varying functions are shown as 3D plots in the left and right columns of Fig. 9. As prescribed by Eq. 13, each in the right column is the product of the corresponding C′(x,t) in the left column with the appropriate DVV(x,t) shown previously in Fig. 6. Qualitatively, these plots indicate that the primary temporal and spatial features of both the original cross-distance functions (Fig. 3) and the derived consonant superposition functions (Fig. 6, right column) are maintained in the reconstructed versions, but some of the fine detail is lost.
Figure 9.
In the left column are the consonant perturbation functions C′(x,t) recovered for each of the three VCVs with Eq. 12, and shown in the right column are the reconstructed VCV cross-distance functions .
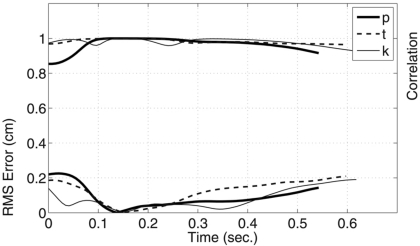
The accuracy of each relative to the original time-varying cross-distance function was assessed by calculating the rms error and correlation coefficient at each time frame. These quantities are shown in Fig. 10 as functions of time. The rms error, which provides a measure of the absolute difference in the cross-distances, is shown in the lower part of the graph and its units are denoted by the axis label on the left. With the exception of the initial 0.05 s of [əpɑ], the rms error of all three VCVs is less than 0.2 cm for the duration of the utterance. During the period of time where the consonant affected the vocal tract shape, the rms error is nearly zero. Shown in the upper part of Fig. 10, and denoted by the right axis label, is the correlation coefficient. This gives an assessment of the similarity in shape of the original and reconstructed cross-distance functions at each time frame, and is nearly 1.0 over the duration of each VCV. The exception, again, is the initial 0.05 s portion of [əpɑ] where the correlation coefficient drops to about 0.85. Taken together, these two measures suggest that the three VCVs can be reasonably well represented and reconstructed by combining a separate VV sequence with a time-dependent consonant perturbation.
Figure 10.
Comparison of the reconstructed VCVs of Fig. 9 to the original time-varying cross-distance functions shown previously in Fig. 3. The lower part of the plot indicates the rms error between the cross-distance functions at every time frame over the course of each utterance. The upper part shows the correlation coefficients calculated at each time frame. Note the axis label for the rms error is on the left side of the plot and on the upper right side for the correlation coefficients.
DISCUSSION
In the discussion of his numerical model of coarticulation, Öhman (1967, p. 318) stated that “The principal value of the model…lies in its ability to summarize with a single mathematical formula the articulatory equivalent of the rather complex acoustic description of VCV coarticulation…” Perhaps the same might be said for the present model, although a few more mathematical relations than just one are required for the complete description. In particular, the ability of the VCV cross-distance model to separate the temporal and spatial contributions of vowels and consonants to the vocal tract shape may allow for insight into the planning of speech utterances. For instance, questions regarding the variability of constriction location, shape, and timing within different vowel environments may be addressed. It is also of interest to relate vocal tract shape change to acoustic output. This could be studied by comparing the structure of formant frequency contours measured for the VCV utterances with the temporal variations of the consonant magnitude and mode coefficients, similar to the idealized version of acoustic characteristics shown in Fig. 1.
A goal in developing the VCV model is to eventually use it to provide information useful for controlling an area function model of the vocal tract. Since the cross-distance model shares many features with the area function model proposed by Story (2005b), transformation of the spatial and temporal information derived for VCVs to parameters relevant for this model should be relatively straightforward. Such a transformation was demonstrated for vowel sequences (Story, 2007b) based on mode coefficients, but additional work is needed to parametrize the consonant superposition functions. Specifically, the C(x,tc) functions (Fig. 7) will need to be described in terms of constriction location (already denoted as xc), extent of the constriction along the vocal tract length, and degree of symmetry about the constriction location (skewness). In addition, informed techniques for correcting the C(x,tc) functions for complete occlusions need to be developed, as well as corrections for the offsets of the consonant magnitude functions [mc(t)] during the vowel-only portions of VCVs, as noted in Fig. 8.
Although speculative at this point, transformation of the VCV cross distance information to area function model parameters may allow for more realistic simulation of vocal tract shape changes along with associated acoustic output. This could aid in understanding both the acoustic and perceptual consequences of various spatial and temporal aspects of vocal tract movement. Controlling an area function with these parameters would also allow for experimenting with the temporal or spatial variability of the vowel and consonant components of an utterance. For example, the acoustic effect and perception of “sliding” the consonant magnitude function (cf. Tjaden, 1999; Löfqvist and Gracco, 1999) along the time axis relative to the vowel transition could be investigated systematically.
A key part of the VCV cross-distance model is the interpolation of the time-varying mode coefficients during the period when the consonant affects the vocal tract shape. It is this interpolation that allows for the recovery of a hypothetical VV sequence that can subsequently be used to recover the consonant superposition function. The sinusoidal function used in the model was chosen because it was found to provide a reasonable fit to the mode coefficients between the boundaries of region II. This does not mean that a sinusoidal function is necessarily representative of the temporal pattern of a complete vocal tract gesture, however. It is noted that the time points, to and tf, that bound region II for each VCV are located at the onset and offset of the consonant gesture (defined by the minima in the error functions), not the beginning and end of the VV transition. Thus, the interpolation of the mode coefficients within region II is an estimate of only a portion of the entire VV transition. It is also important to note that locating to and tf at the error function minima is necessary to avoid an interpolation that (1) could include remnants of the consonant constriction if Region II were reduced in duration or (2) not adequately represent the VV transition if the duration of Region II were increased.
Although the VCV cross-distance model shares many similarities with the Öhman (1967) model, a primary difference is that all of the parameters needed by the present model to decompose and reconstruct a given VCV can be obtained from analysis of that VCV alone. In Öhman’s model the canonical vocal tract shape for a particular consonant and the coarticulation function could be obtained only from multiple VCVs in which that consonant was embedded within two different symmetric vowel contexts. Also required were canonical tract shapes for the vowels themselves. In the XRMB database, isolated VCVs were spoken only in the asymmetric [əɑ] context, hence, a direct comparison with the Öhman model is not currently possible unless a variety of VCVs were approximated from word and sentence level material. Additional new XRMB data collection could potentially supply a wider variety of VCV speech material for which a comparison could be made. Another difference is that the representation of velar stop consonants by the Öhman model is problematic because the location of the constriction is dependent on the vowel context, meaning that a canonical tract shape does not exist for this class of consonants. Although the VCV cross-distance approach has the problem of limited data in the velar region, there is no limitation of the model with regard to vowel-dependent constriction locations.
At this point the utility of the VCV model is admittedly limited by a number of factors. First, it has been applied to only three VCVs from one speaker. Certainly more speech material from additional speakers needs to be modeled in order to determine if the decomposition technique generalizes across a wide range of initial and final vowels, as well as across a variety of consonantal constrictions. Second, the constraint that XRMB articulatory data represent only the oral cavity does limit the degree to which the results can be extended to describe movement of the entire vocal tract. This limitation is tempered somewhat by knowing that the vocal tract modes determined from XRMB data appear to replicate those modes found for area functions based on the entire vocal tract (Story, 2007b). In addition, for most consonants other than those in the velar region, the consonant constriction is fairly well represented by the extent of the XRMB data. For the velar consonants, only a portion of the full extent of the constriction is captured by the data, and it is possible that in some cases the location of maximum constriction is not well represented. It can be noted, however, that the location and general configuration of the constrictions for each of the three consonants represented by the consonant superposition functions in Fig. 7 are similar to the vocal tract area functions reported for the same stop consonants in Story and Titze (1998). A third limitation is that the XRMB flesh points (pellets) provide a sparse spatial representation of the vocal tract in only the midsagittal plane. The low spatial resolution does not allow for a detailed representation of the air channels needed for fricative and affricate production, and midsagittal data cannot adequately depict consonants with lateral constrictions.
Despite these limitations, however, reconstruction of even a rudimentary and partial representation of the time-varying vocal tract shape is difficult to achieve by any means other than fleshpoint tracking [i.e., XRMB data, but also articulometer-type data (Perkell et al. 1992)]. New techniques in magnetic resonance imaging show promise for obtaining 3D time-dependent image sets (e.g., Takemoto et al. 2006), but these are currently limited to short utterances that must be repeated several hundred times. Finally, it must be pointed out that reasonable success in separating the vowel and consonant components of a VCV with the proposed model does not prove that a speaker necessarily plans an utterance by superimposing a constriction on a vowel transition. Rather, the results merely suggest it to be a possible planning paradigm that, at this stage, may provide useful information for more detailed modeling of the time-varying vocal tract shape.
CONCLUSION
The aim of this study was to develop a method by which a VCV, represented as a time-dependent cross-distance function derived from XRMB articulatory data, could be separated into a vowel-to-vowel sequence and a consonant superposition function. The result is a model that represents a vowel sequence as a time-dependent perturbation of the neutral vocal tract shape governed by coefficients of the vocal tract modes. Consonants are modeled as superposition functions that can force specific portions of the tract shape to be constricted or expanded, over a specific time course. Reconstructions of three VCVs ([əpɑ], [ətɑ], and [əkɑ]) with the developed model were shown to be reasonable approximations of the original VCVs, as assessed qualitatively by visual inspection and quantitatively by calculating rms error and correlation coefficients. Although the method was developed and tested on a small data set from one female speaker, it does establish a method for future modeling of other speech material.
ACKNOWLEDGMENTS
This research was supported by NIH Grant No. R01-DC04789. The author would like to thank Kate Bunton for discussions on x-ray microbeam data and editing of early drafts of the manuscript, as well as the Associate Editor and two anonymous reviewers for their insightful comments.
Footnotes
The model includes four hierarchical tiers where the third and fourth tiers provide time-dependent control of vocal tract length changes and nasalization, respectively. These aspects of speech production, however, are not discussed in the present study. Hence, these capabilities of the model are not reviewed.
In addition to a model of the vocal tract shape, production of synthetic or simulated speech requires components for computing voice source characteristics and wave propagation. These latter two components are part of an existing speech production model (e.g., Story and Titze, 1998), but will not be discussed here.
In Story (2007b) the two most anterior phantom points were determined by a correction function applied to the upper and lower lip pellet positions based on assuming contact during production of the bilabial consonant (m). In the present study, this correction function was based on lip closure during a silent non-speech segment of recorded data. This was done so that the upper and lower lip positions would indicate contact without the lip compression that is characteristic of bilabials. The vocal tract modes used in this study were also recalculated based on the new correction.
References
- Båvegård, M. (1995). “Introducing a parametric consonantal model to the articulatory speech synthesizer,” in Proceedings Eurospeech 95, Madrid, Spain, pp. 1857–1860.
- Browman, C., and Goldstein, L. (1990). “Gestural specification using dynamically-defined articulatory structures,” J. Phonetics 18, 299–320. [Google Scholar]
- Byrd, D. (1996). “Influences on articulatory timing in consonant sequences,” J. Phonetics 24, 209–244. 10.1006/jpho.1996.0012 [DOI] [Google Scholar]
- Carré, R., and Chennoukh, S. (1995). “Vowel-consonant-vowel modeling by superposition of consonant closure on vowel-to-vowel gestures,” J. Phonetics 23, 231–241. 10.1016/S0095-4470(95)80045-X [DOI] [Google Scholar]
- Fowler, C. A. (1980). “Coarticulation and theories of extrinsic timing,” J. Phonetics 8, 113–133. [Google Scholar]
- Fowler, C. A., and Saltzman, E. (1993). “Coordination and coarticulation in speech production,” Lang Speech 36, 171–195. [DOI] [PubMed] [Google Scholar]
- Gracco, V. L. (1992). “Characteristics of speech as a motor control system,” Haskins Labs. Stat. Rep. on speech Res., SR-109/110, 13-26.
- Ichikawa, A., and Nakata, K. (1968). “Speech synthesis by rule,” Reports of the Sixth International Congress on Acoustics, edited by Kohasi Y. (International Council of Scientific Unions, Tokyo: ), pp. 171–1744.
- Kent, R. D., and Minifie, F. D. (1977). “Coarticulation in recent speech production models,” J. Phonetics 5, 115–133. [Google Scholar]
- Kozhevnikov, V. A., and Chistovich, L. A. (1965). “Speech: Articulation and perception (trans. US Dept. of Commerce, Clearing House for Federal Scientific and Technical Information),” Joint Publications Research Service, Washington, DC, No. 30, p. 543.
- Kröger, B. J., Schröder, G., and Opgen-Rhein, C. (1995). “A gesture-based dynamic model describing articulatory movement data,” J. Acoust. Soc. Am. 98, 1878–1889. 10.1121/1.413374 [DOI] [Google Scholar]
- Lagarias, J. C., Reeds, J. A., Wright, M. H., and Wright, P. E. (1998). “Convergence properties of the Nelder–Mead Simplex method in low dimensions,” SIAM J. Optim. 9, 112–147. 10.1137/S1052623496303470 [DOI] [Google Scholar]
- Löfqvist, A., and Gracco, V. L. (1999). “Interarticulator programming in VCV sequences: Lip and tongue movements,” J. Acoust. Soc. Am. 105, 1864–1876. 10.1121/1.426723 [DOI] [PMC free article] [PubMed] [Google Scholar]
- Mokhtari, P., Kitamura, T., Takemoto, H., and Honda, K. (2007). “Principal components of vocal tract area functions and inversion of vowels by linear regression of cepstrum coefficients,” J. Phonetics 35, 20–39. 10.1016/j.wocn.2006.01.001 [DOI] [Google Scholar]
- Nakata, K., and Mitsuoka, T. (1965). “Phonemic transformation and control aspects of synthesis of connected speech,” J. Radio Res. Labs. 12, 171–186. [Google Scholar]
- Öhman, S. E. G. (1966). “Coarticulation in VCV utterances: Spectrographic measurements,” J. Acoust. Soc. Am. 39, 151–168. 10.1121/1.1909864 [DOI] [PubMed] [Google Scholar]
- Öhman, S. E. G. (1967). “Numerical model of coarticulation,” J. Acoust. Soc. Am. 41, 310–320. 10.1121/1.1910340 [DOI] [PubMed] [Google Scholar]
- Perkell, J. (1969). Physiology of Speech Production: Results and Implications of a Quantitative Cineradiographic Study (MIT, Cambridge, MA: ). [Google Scholar]
- Perkell, J., Cohen, M. H., Svirsky, M. A., Matthies, M. L., Garabicta, I., and Jackson, M. T. T. (1992). “Electromagnetic midsagittal articulometer systems for transducing speech articulatory movements,” J. Acoust. Soc. Am. 92, 3078–3096. 10.1121/1.404204 [DOI] [PubMed] [Google Scholar]
- Story, B. H. (2005a). “A parametric model of the vocal tract area function for vowel and consonant simulation,” J. Acoust. Soc. Am. 117, 3231–3254. 10.1121/1.1869752 [DOI] [PubMed] [Google Scholar]
- Story, B. H. (2005b). “Synergistic modes of vocal tract articulation for American English vowels,” J. Acoust. Soc. Am. 118, 3834–3859. 10.1121/1.2118367 [DOI] [PubMed] [Google Scholar]
- Story, B. H. (2007a). “A comparison of vocal tract perturbation patterns based on statistical and acoustic considerations,” J. Acoust. Soc. Am. 122, EL107–EL114. 10.1121/1.2771369 [DOI] [PMC free article] [PubMed] [Google Scholar]
- Story, B. H. (2007b). “Time-dependence of vocal tract modes during production of vowels and vowel sequences,” J. Acoust. Soc. Am. 121, 3770–3789. 10.1121/1.2730621 [DOI] [PMC free article] [PubMed] [Google Scholar]
- Story, B. H., and Titze, I. R. (1998). “Parameterization of vocal tract area functions by empirical orthogonal modes,” J. Phonetics 26, 223–260. 10.1006/jpho.1998.0076 [DOI] [Google Scholar]
- Takemoto, H., Honda, K., Masaki, S., Shimada, Y., and Fujimoto, I. (2006). “Measurement of temporal changes in vocal tract area function from 3D cine-MRI data,” J. Acoust. Soc. Am. 119, 1037–1049. 10.1121/1.2151823 [DOI] [PubMed] [Google Scholar]
- Tjaden, K. (1999). “Can a model of overlapping gestures account for scanning speech patterns?,” J. Speech Lang. Hear. Res. 42, 604–617. [DOI] [PubMed] [Google Scholar]
- The Mathworks, MATLAB, Version 7.6.0.324 (R2008a).
- Westbury, J. R. (1994). X-Ray Microbeam Speech Production Database User’s Handbook, (version 1.0)(UW-Madison).


