Abstract
We describe an approach for acquiring high quality x-ray absorption fine structure (XAFS) spectroscopy spectra with wide energy range at high pressure using diamond anvil cell (DAC). Overcoming the serious interference of diamond Bragg peaks is essential for combining XAFS and DAC techniques in high pressure research, yet an effective method to obtain accurate XAFS spectrum free from DAC induced glitches has been lacking. It was found that these glitches, whose energy positions are very sensitive to the relative orientation between DAC and incident x-ray beam, can be effectively eliminated using an iterative algorithm based on repeated measurements over a small angular range of DAC orientation, e.g., within ±3° relative to the x-ray beam direction. Demonstration XAFS spectra are reported for rutile-type GeO2 recorded by traditional ambient pressure and high pressure DAC methods, showing similar quality at 440 eV above the absorption edge. Accurate XAFS spectra of GeO2 glass were obtained at high pressure up to 53 GPa, providing important insight into the structural polymorphism of GeO2 glass at high pressure. This method is expected be applicable for in situ XAFS measurements using a diamond anvil cell up to ultrahigh pressures.
INTRODUCTION
Diamond anvil cells (DACs) are commonly used to introduce the fundamental thermodynamic variable of pressure to investigate the high pressure phase behavior of condensed matter. X-ray absorption fine structure (XAFS) spectroscopy, including the x-ray absorption near edge spectrum (XANES) and extended x-ray absorption fine structure (EXAFS) spectra, has proven to be a powerful tool for critically characterizing the local atomic configuration as well as electronic state of absorbing atoms in materials of crystalline, amorphous, and liquid phases at ambient or high pressure environment1, 2, 3 (for review, see Refs. 4, 5, 6).
The coupling of a DAC and the XAFS technique is of general importance in physics, chemistry, materials and earth sciences, and has long been regarded as potentially extremely important for understanding the behavior and evolution of the local and electronic structure of matter under extreme conditions.3, 7, 8, 9 For crystalline materials at high pressure, local information obtained by XAFS about interatomic distances, types, and number of atoms around the absorbing atom complements the long-range periodic structure provided by x-ray diffraction experiments because the local compressibility of a single bond in complex materials usually differs from the bulk compressibility.10, 11 For disordered systems at extreme conditions, e.g., high pressure liquids12, 13, 14, 15, 16, 17, 18, 19, 20 and supercritical fluids,21, 22, 23, 24 high pressure XAFS offers unique information to track changes in the local and electronic structures of absorber atoms in the fields of materials science, chemistry, and biophysics.
However, the use of DAC for high pressure XAFS is complicated by DAC produced distortions of XAFS spectra, restricted sample thickness, and high x-ray absorption by the diamond at low energy. The spectral distortions arise from the Bragg reflection of the diamond anvils, which suddenly reduces the transmitted intensity and makes a strong contribution to the measured attenuation of x-ray photons at certain x-ray energies and orientations of the diamonds.3, 7, 8 Because of these DAC induced, Bragg glitches, which are often more intensive than EXAFS and XANES oscillations and spoil the high quality XAFS necessary for deriving precise structural information, diamond anvils have long been regarded as poorly suited for conventional energy scan XAFS measurements at high pressure.3
Currently, the energy dispersive mode is regarded as a good alternative XAFS technique for studies of materials under high pressure using DAC (Refs. 25, 26, 27, 28) because the transmitted beam from the DAC can be visualized in real time without the need of scanning the monochromator. For high pressure research with the DAC, energy dispersive XAFS (ED-XAFS) has many advantages over the conventional scanning XAFS technique, such as position stability of the focal spot (no mechanical movement of the optics during data collection) and improved time resolution for high speed data acquisition, which allows the optimum orientation of the DAC with respect to the x-ray beam to be determined in a relatively short time.29, 30, 31, 32 With the whole spectrum observed simultaneously, ED-XAFS facilitates the rapid screening of cell orientations to find an optimal one and therefore have the largest possible glitch-free energy range.33, 32 The remaining glitches at the optimal DAC orientation can be removed by rotating the cell a few degrees with respect to the polychromatic x-ray beam.27
At low energies (<10 keV), the number of Bragg reflections in the absorption spectrum is rather low. By performing measurements at different orientations of the DAC, it is in some cases possible to obtain “reflection-free” spectra with wide energy range,27, 34, 35 e.g., the K-edges of Ni (Refs. 7, 8) (8.333 keV), Zn (Ref. 36) (9.659 keV), and Ga (10.367 keV).37, 38 The combination of ED-XAFS and indented DAC (Ref. 39) has succeeded in extending usable x-ray energy down to 5 keV and thereby allow XAFS spectra of low-Z atoms to be acquired at pressures up to 30 GPa,27 leading to numerous successful applications, e.g., Refs. 40, 41, 42, 43, 27. Due to the strong focusing properties of the polychromator crystal, improvements in dispersive optics, use of a low divergence undulator source, and upstream horizontal focusing mirror, the size of focused x-ray beam has been significantly reduced in ED-XAFS spectrometers32 and a beam size of 5×5 μm2 (full width at half maximum) has been achieved28 opening up the possibility of performing studies which couple spectroscopy and microscopy.44 It has been reported that the use of standard diamond anvils (typically 2 mm thickness for each anvil) and small x-ray beam has successfully pushed the pressure limit to the megabar range, e.g., Br at 110 GPa,45 hematite at 100 GPa,32 and InAs at 80 GPa.46
At higher energies, where the number of glitches in a given energy range increases approximately with the square of the edge energy, it is in general not possible to eliminate all diamond reflections in the whole energy range of an XAFS spectrum.32 The approach of performing measurements at different DAC orientations in some cases succeeds in eliminating all glitches,34, 35 but it is almost impossible to reject all glitches far from the threshold energy, for example, at Ge K-edge (11 103 eV), as pointed out in Ref. 27
The classical energy scanning XAFS is a well recognized method and widely applied to structural studies at ambient pressure, but the situation of overcoming DAC glitches in XAFS spectra by searching for an optimum orientation is more time consuming than for the energy dispersive mode because of poorer time resolution. Nevertheless, classical energy scan XAFS has some remarkable advantages, such as relatively simple monochromator and focusing optics, and wide availability at virtually every synchrotron radiation facility, including applications to diverse subjects of interest and availability of the microbeams which are needed for ultrahigh pressure research at megabar region.
For XAFS measurements at high pressure using the classic energy scan mode, there are several methods to avoid DAC glitches, such as measuring multiple spectra at several different orientations of the cell, using polycrystalline boron carbide anvils, recording spectra through the gasket, and using a multianvil apparatus. As an effective approach for overcoming the Bragg glitches, the use of polycrystalline B4C for one or both anvil(s)3 has demonstrated that high quality Cu K-edge EXAFS spectra can be obtained and copper can serve as a pressure calibrant with an accuracy of 0.5 GPa in the range of 0–10 GPa.47 However, the use of polycrystalline B4C anvil(s) limits the maximum achievable pressure. XAFS data can be taken using a DAC by employing a low atomic number gasket and recording spectra through the gasket rather than the diamonds,48, 49 but uncertainties in sample thickness under high pressure limit its application to XANES spectra. Another method to avoid the DAC glitches is the use of large volume pressure cell (multianvil apparatus), which is very useful for studies of noncrystalline materials at relatively low pressures (typically, <20 GPa).50, 11 Wide spectral energy range can be achieved in this method, e.g., 1200 eV above the threshold energy for white-tin-type germanium at pressures up to 12.8 GPa,11 and 1000 eV above the edge for liquid GeO2 up to 9 GPa.51
However, for many cases, such as the studies of phase transitions at pressures above 20 GPa, single-crystal diamond anvils must be employed. Effects of coupling the DAC with conventional energy scanning mode were reported more than 20 years ago.7, 8 It was reported that if XAFS was recorded through the diamonds, the glitches can, in principle, be eliminated by measuring spectra at several different orientations of the cell so that the glitches appear at different energies, and then producing a glitch-free, composite spectrum.7, 8, 52 Nevertheless, practical use of this method seems to be quite tricky and complicated, e.g., incomplete spectra of W LIII edge (10.207 keV) were reported at low pressures of 3.6 and 7.6 GPa even though spectra were collected at several different DAC orientations.53 The classical energy scan mode is not widely used for high pressure XAFS measurements, a situation that is partially responsible for the paucity of publications in the pressure range of 30–100 GPa. For example, no Ge K-edge XAFS spectrum in energy scan mode at pressure above 10 GPa has been reported so far.
The occurrence of DAC Bragg peaks typically limits the k-range of the XAFS spectra to a maximum of 7–8 Å−1,54, 55, 56 resulting in insufficient information in the spectra57 and the reduction in the number of independent parameters on which the ambiguity of EXAFS results are strongly dependent.58 This is particularly critical in the case of complex structures where high coordination shells and multiple-scattering effects have to be taken into account to refine the experimental XAFS spectra,59 and strongly penalizes the exploitation of high pressure EXAFS.
The interference of x-ray DAC Bragg reflections with the absorption signal has proved to be a challenging problem. We tackle this problem by repeatedly measuring XAFS spectra within a small angular range of DAC orientation, e.g., ±3° relative to the incident x-ray beam. In this paper, we describe the method for acquiring high quality Ge K-edge XAFS spectra of GeO2 glass at high pressure in a standard classical energy scan station with DACs. The structure of classical network-forming GeO2 glass has important implications in earth sciences as a SiO2 analog and the pressure induced amorphous polymorphism of GeO2 glass has been intensively investigated.25, 51, 60, 61, 62, 63
We designed three sets of x-ray absorption experiments in traditional energy scan mode with standard symmetrical DACs to investigate the changes in DAC induced glitches in XAFS spectra upon reorientation of the DAC relative to the incident x-ray beam. The first comprised a detailed comparison of Ge K-edge XAFS spectra for rutile-type GeO2 collected with and without the DAC environment (1 GPa and ambient pressure, respectively) to see if high quality XAFS spectra with the DAC could be extracted. The second was to carry out XAFS measurements with different DAC orientations on amorphous GeO2 glass at high pressure so as to investigate the effect of high pressure on DAC glitches, removal of DAC glitches, and whether spectral quality can be improved as redundancy increases at high pressure XAFS experiments. The last sets were to carry out two independent DAC experiments on GeO2 glass at pressures up to 50 GPa to demonstrate the capability of taking high quality XAFS data at a standard energy scan XAFS station.
Accurate XAFS spectra of GeO2 glass have obtained at high pressures up to 56 GPa, which provides important insight into the structural transformation process induced by high pressure, e.g., clear evidence of an amorphous-amorphous phase transition has been observed at a pressure of 25 GPa. This brings about new opportunities for high pressure EXAFS using DACs. Although the present example is focused on Ge K-edge XAFS of amorphous GeO2, the method should be applicable to structural studies at other edges as well, and with smaller beam size, in situ energy scan XAFS measurements in the megabar region would be feasible.
EXPERIMENT AND METHOD
The upper limit of pressure range covered by a DAC is defined by the size of the diamond culet. Typically, it requires a size of diamond culet between 300 and 150 μm to reach peak pressures of 70–150 GPa. In the present high pressure experiments, standard symmetrical DACs, 300 μm culet size, 2.1 mm thickness for each anvil, and about 56° cone opening were employed for XAFS measurements. Rhenium gaskets (250 μm thick) were preindented to 35–40 μm and a hole of approximately 80 μm in diameter was drilled in the center as the sample chamber for the loading of amorphous or rutile-type GeO2 powder. Details of GeO2 glass preparation were published elsewhere.61 To get a homogeneous sample along the x-ray beam path, no pressure transmitting medium was used in the XAFS experiments. Pressures were determined using the pressure-dependent fluorescence of small ruby balls (<5 μm) scattered at the corner of the sample chamber, while the sample was placed at the center.
XAFS spectra were acquired on the Ge K-edge (11 103 eV) of rutile GeO2 and GeO2 glass in transmission mode at the GeoSoilEnviroCARS bending magnet beamline 13-BM-D, Advanced Photon Source (APS), Argonne National Laboratory. The storage ring was operated at 7 GeV with ∼100 mA current. The x rays were monochromatized by using a Si(111) double-crystal monochromator. Higher harmonics were rejected with a Pt-coated, 1 m long, vertical focusing mirror pitched at 3 mrad and by detuning the second crystal of the monochromator to reduce the total intensity to ∼50% of the intensity at full tune.
The Pt-coated mirror was also used to focus the beam in the vertical to ∼0.05 mm, and slits were used to define the horizontal beam size to 2.5 mm. Details of the equipment and x-ray optics of this beamline are described elsewhere.64, 65 The x-ray beam was then focused down to a beam diameter of approximately 15 μm in horizontal direction at the sample position using a 200 mm Kirkpatrick–Baez mirror65 so the beam passed cleanly through the sample hole (80 μm) without grazing the ruby balls (<5 μm) and Re gasket. This is necessary for XAFS experiments to avoid any interaction between the x-ray beam and the gasket or ruby, which is detrimental to the data quality such as deformations in the spectrum shape and inconsistent spectra measured at different cell orientations. The incident and transmitted x-ray intensities were measured with a N2-filled ion chamber.
The cell mounted on DAC stages could be rotated and translated remotely in both the horizontal and the vertical direction (90° to beam). In this way the cell position was optimized to the rotation center prior to spectral collection so as to make sure that the x-ray pass through the same sample area at different angles, which is necessary for the elimination of sample inhomogeneity and thickness effect due to the uneven or curvature of DAC at high pressure.66, 62
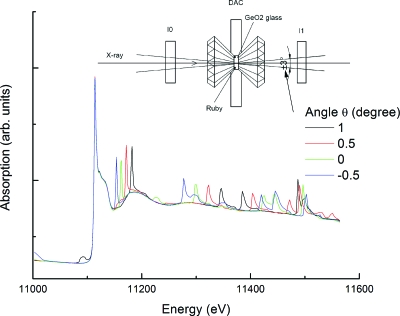
XAFS spectra were collected by scanning the monochromator energy from 11 003 to 11 564 eV with 5 eV steps before the main edge, 0.5 eV steps within ±25 eV of the main edge (11 103 eV), and 0.04 Å−1 steps in photoelectron wave number above the main edge. The signals from the ion chambers were recorded for 2 s at each energy point, and typically it took about 12 min to collect a full XAFS spectrum for amorphous GeO2. Several scans were collected at different DAC orientations with 0.5° or 1° step within an angle range of ±3°, and at most of the pressure points in this paper, usually seven spectra were collected with 1° step. The inset of Fig. 1 shows a schematic layout of the DAC experiment.
Figure 1.
X-ray absorption spectrum of GeO2 glass (Ge K-edge) at 1.0 GPa with the DAC orientation of 1°, 0.5°, 0°, and −0.5° with respect to the x-ray beam. The Inset shows a schematic layout of the DAC experiment.
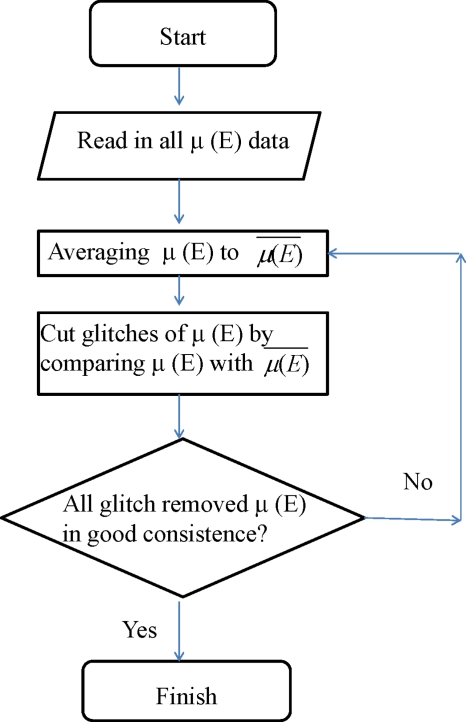
We propose an iterative method to identify and remove the glitches due to diamond diffraction in the raw absorption spectra. A flow chart of the method is shown in Fig. 2. A first trial XAFS spectrum, , was obtained by averaging all the spectra at different orientations. Glitches at each spectrum, μa(E), were ruled out by criteria in deviation to the target for 10%, 20%, and 5% in the pre-edge, edge, and postedge regions, respectively, to generate a new respective spectrum, μa′(E), with strong glitches removed. Aligning μa′(E) to by a constant, which is determined by subtracting from μa′(E), resulting in μa″(E) at each orientation. A new averaged XAFS spectrum, , is obtained by averaging over all the μa″(E) spectra. These data are then used as a standard for each spectrum for further glitch removal with tight criteria of 5%, 10%, and 2% in the pre-edge, edge, and postedge, respectively, to discern and remove the remainder of strong glitches in the first step as well as some very weak glitches that may be neglected. Several iterative circles of glitch removing and averaging can effectively remove all the strong and weak glitches imposed by DAC. Once no change in the resultant averaged spectrum and all the glitch-removed spectra at each orientations are consistent with each other, the iterative process is completed. No interpolation is needed to make up the removed part of glitches.
Figure 2.
A flow chart of the iteration algorithm method for DAC glitch removal.
In some case of low data redundancy, when only one or two spectra free of DAC glitch at some specific energy range is available, it may be needed to replace the corresponding part of average or using the glitch-free one for further iteration. The last average data are taken as the final XAFS spectrum at each pressure step.
Further XAFS data processing and analysis were then performed with the ATHENA and ARTEMIS programs67 of the IFEFFIT package.68 In addition, glitch-removed spectra at each orientation, e.g., μa″(E), can be directly averaged by using ATHENA to generate the composite spectrum. XAFS oscillation, χ(k), at each pressure was obtained by subtracting the slowly varying background using ATHENA. Theoretical models for the XAFS were constructed with FEFF (Refs. 69, 70) by using crystallographic atomic positions of GeO2. The models were fitted to the data by using ARTEMIS,67 which also performs an error analysis and calculates the goodness-of-fit parameters.
RESULTS AND DISCUSSION
Figure 1 shows the sensitivity of DAC induced glitches to the DAC orientation for Ge K-edge XAFS of GeO2 glass at 1.0 GPa, where the DAC angle relative to the x-ray beam is defined in the schematic layout of the DAC experiment (inset). As observed previously by classical energy scan method,7 there are many Bragg reflection glitches in each XAFS spectrum at the different orientations which are often more intense than EXAFS and XANES oscillations and seriously compromise the quality of each single XAFS spectrum. Considerable position shift of DAC glitches can be observed even when the DAC orientation with respect to x-ray beam was changed by as little as 0.5°. As shown in Fig. 1, the spectra measured at different angles are consistent except for variation in the glitches, which would make the extraction of precise XAFS spectrum from redundant orientation measurements possible.
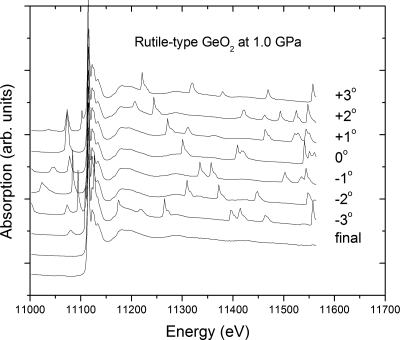
Figure 3 shows the multiple data sets of transmission Ge K-edge XAFS for rutile-type GeO2 at 1.0 GPa with the DAC at different angle settings of 0°, ±1°, ±2°, and ±3° with respect to the incident beam. Using the iterative algorithm, shown in Fig. 2 and described above, the overlap is excellent for all of the spectra. Typically, the difference between the glitch-removed raw spectra μa(E) and the average composite spectrum, , is within 3% for spectra recorded within the DAC orientation range of ±3°. After three iterations, the standard deviation of seven independent spectra to the average one is about 0.11% in the whole spectra. As a result of using spectra at seven DAC orientations, typically each composite point is based on at least three independent experimental results. The final XAFS spectrum is the bottom curve of Fig. 3. A similar data reduction method of using independent measurements at seven different angle settings in the energy dispersive x-ray diffraction method was successfully employed to overcome the Laue peaks from a single-crystal sapphire cell, by which high quality x-ray diffraction curves of fluid Hg in the supercritical region were obtained.23
Figure 3.
Ge K-edge XAFS of rutile-type GeO2 at 1.0 GPa obtained by classic energy scan transmission mode across the diamond anvils (300 μm culet) at different angle settings with an x-ray beam size of 15 μm in diameter. Pressure was determined by ruby chips at the corner of sample chamber. The x-ray absorption spectrum shows extra peaks due to Bragg diffraction by the diamond anvils. The bottom curve shows the spectrum obtained after application of the glitch removal algorithm.
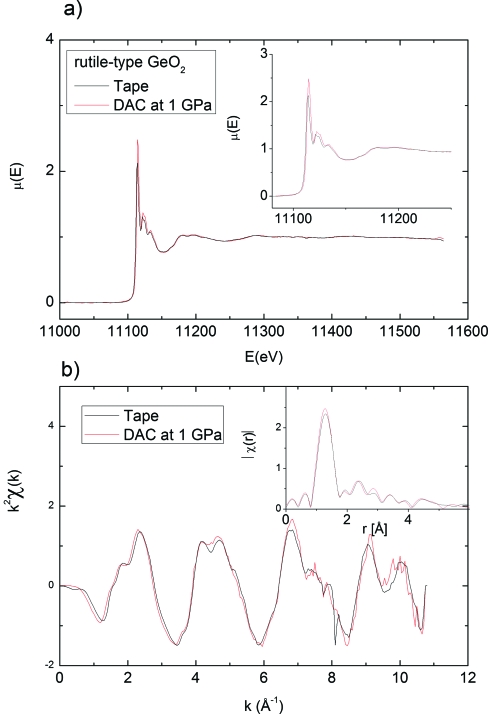
A comparison with the well established XAFS recording method at ambient pressure without the DAC environment would be a strict criterion for the proposed iterative process, as well as to ensure that the extraction of XAFS signal does not introduce any spurious features imposed by DAC holder. The raw Ge K-edge XAFS spectra of rutile-type GeO2 samples recorded with and without the DAC at 1 GPa and ambient pressure, respectively, were background subtracted, normalized, and plotted for comparison. The XAFS spectra [Fig. 4a] including XANES region (inset) are consistent with each other over the entire energy range to 440 eV above the absorption edge. The double oscillation (11 122 eV and 11 125 eV), which is evident in some of spectra recorded in the DAC (Fig. 3), was first smeared due to a small remainder (11 122 eV) of a neighboring glitch at 11 126.5 eV (the −3° curve in Fig. 3) with an automatically iteration and averaging process. To get a suitable bandpass (e.g., 5% in XANES region in this case), monitoring the iteration process and comparing all the resultant data in the same region is worthwhile for ruling out such a remainder of neighboring glitch or weak glitches. This illustrates that redundant measurements at DAC orientations are helpful in distinguishing the influence of DAC glitches and consequently improving the reliability of experimental data. It can be noted that there is a slight energy shift in the white line (strong first peak) between the two spectra which may come from the different conditions in pressure. The variation in the height of the white line is caused by the different sample thickness in these two experiments.
Figure 4.
(a) Comparison of Ge K-edge XAFS spectra obtained with and without the DAC environment after glitch removal of the DAC spectrum. The inset shows the XANES spectra. (b) The k2-weighted χ(k) XAFS spectra and the amplitude, ∣χ(R)∣, of the XAFS Fourier transform of k2χ(k) by using a k range from 1 up to 11 Å−1 for both spectra, and Hanning windows. The similar amplitudes and frequencies of oscillations in k2χ(k) and ∣χ(R)∣ indicate that influence of DAC diffraction is negligible.
Figure 4b shows the comparison of k2-weighted χ(k) XAFS spectra and the amplitude, ∣χ(R)∣, of the XAFS Fourier transform of k2χ(k) by using a k range from 1 up to 11 Å−1 for spectra with and without the DAC and a Hanning window. The oscillations both in k2χ(k) and ∣χ(R)∣ show similar amplitudes and frequencies with and without the DAC, indicating that the influence of DAC diffraction is negligible.
It was reported that the method of adjusting DAC orientation in energy scan XAFS is only effective in the case when the number of DAC diffractions is small, and was limited to the K-edges of Fe, Co, and Ni atoms.7 Here, the comparable quality XAFS spectra obtained by DAC to the conventional ambient method demonstrates that even for the tough Ge K-edge,27 we can obtain high quality spectra by redundant DAC orientation measurements over a small angular range with respect to the incident x-ray beam using the proposed iterative method. It should be noted that the derived Ge K-edge XAFS spectra are free of reflection-induced glitches up to 440 eV above the threshold energy, while that of reported Ge K-edge spectra in terms of ED-XAFS are 300 eV for crystalline and vitreous GeO2 (Ref. 25) and 350 eV for MgGeO3 enstatite and CaGeO3 wollastonite.55
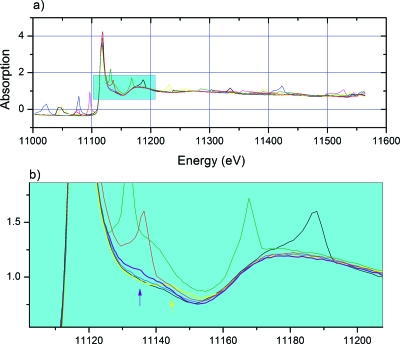
At high pressure, the problem of DAC glitches in classical energy scan mode is compounded by the influence of strains in the diamonds as the cell pressure increases. The strain gradient in the diamonds can increase the mosaic spread and broaden DAC glitches, causing noisy background or broken spectra.3, 53 Figure 5a shows the raw data of Ge K-edge XAFS of GeO2 glass at a pressure of 53.3 GPa measured at seven different orientations, 0°, ±1°, ±2°, and ±3° relative to the incident x-ray beam. High pressure does make the diamond-derived Bragg glitches broader in comparison with the data at low pressure (Fig. 3). The magnified plot of the XANES region shows the presence of weak DAC diffractions (shoulders indicated by purple and yellow arrows, respectively). These small diffraction peaks are hard to be recognized by screening with few scans or by low data redundancy, e.g., if the number of independent spectra is less than four. With higher data redundancy, when several curves overlap in the same energy region [Fig. 5b], these weak peaks could be identified and then eliminated from the final composite spectrum. The described method is useful to overcome such weak DAC diffractions and improve the reliability of XAFS data, although in some cases of single measurement (no redundancy), it may obtain glitch-free XANES spectra, as implied by the black, green, and blue lines of Fig. 5 and also reported in references of Br K-edge71 and Rb K-edge.72
Figure 5.
(a) Ge K-edge XAFS of GeO2 glass at 53.3 GPa measured at seven different orientations, 0°, ±1°, ±2°, and ±3° relative to the incident x-ray beam. (b) Magnified plot of the XANES region showing the presence of weak DAC diffraction features (shoulders indicated by purple and yellow arrows), which are difficult to identify by low data redundancy, e.g., when the number of independent spectra is less than 4.
XAFS using synchrotron radiation is a rapidly expanding field, in particular, the analysis of spectral features in XANES region. XANES spectra are very sensitive to the electronic states and three-dimensional (3D) atomic configuration around x-ray absorbing atoms, and widely employed as footprints to help identifying the structural phase changes at high pressure. Progress in quantitative analysis indicates that XANES is sensitive to bond angles, species of ligands, and geometries, and the full retrieval of the geometrical structure within a longer distance of 6–7 Å from the absorbing site is possible.73, 74, 75 Due to the narrow spectral range, acquiring accurate spectra free from any strong or weak DAC diffraction is essential for the quantitative ab initio simulation of XANES spectra70, 73, 74, 75 as well as the reliability of 3D geometrical retrieval around the absorbing atoms. Much exercise of caution would be required in the removal of the weak Bragg peaks shown in Fig. 5b if data redundancy is low. In addition, residual small DAC peaks in the EXAFS region may cause unphysical contributions to EXAFS oscillation and dramatic phase change.3
To obtain high quality XAFS spectra, the method of comparing an observed entire spectrum with the preceding one during the cell adjustment obviously makes it difficult to reject such weak spurious Bragg reflections at each pressure step,27 for example, when only two orientations of the DAC are used to produce a composite spectrum through the normalization process in ED-XAFS.76 Therefore, maximizing the data redundancy on DAC orientations holds true both for energy scan and energy dispersive modes in pursuit of high quality XAFS spectra with long energy range above the threshold.
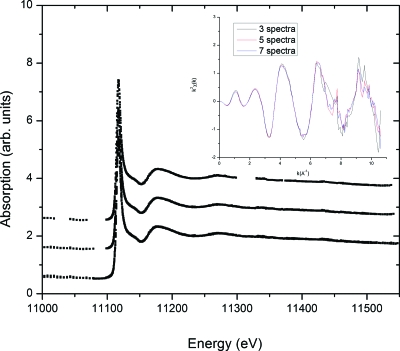
Figure 6 shows the effect of data redundancy on the quality of the composite Ge K-edge XAFS spectrum for GeO2 glass at 53.3 GPa. Merged spectra were based on the data sets of three (top), five (middle), and seven (bottom) independent spectra. As shown in Fig. 6, the composite spectrum is broken if only three orientation data were employed. No interpolation was made to replace the strong Bragg peaks because such an interpolation by straight or polynomial line may induce considerable uncertainties in the ∣χ(R)∣ data function. The composite spectrum becomes complete as five or seven orientation data were used. From the k2-weighted χ(k) XAFS spectra (inset, Fig. 6), it can be seen that higher redundancy can significantly improve the signal-to-noise ratio. No interpolation is needed for such a continuous spectrum, and typically at least three scans at different orientations contributed to each point in the composite χ(k). This result indicates that even at a pressure of 53.3 GPa, which is close to the upper pressure limit of a 300 μm culet size DAC and strain in the diamonds leads to a worse glitch problem, it is still possible to acquire high quality complete XAFS spectra free from glitches with the described method.
Figure 6.
Effect of data redundancy on the final composite Ge K-edge XAFS of GeO2 glass at 53.3 GPa. Merged spectra from data sets of three (top), five (middle), and seven (bottom) independent spectra. Inset: the k2-weighted χ(k) XAFS spectra obtained from these data sets.
Theoretically, if a Bragg peak occurs at the same energy in all the measured spectra, the composite XAFS spectrum may be broken. In this case, additional XAFS spectra at different orientations should be obtained. Fortunately, DAC Bragg peaks are very sensitive to DAC orientation, e.g., 0.5° in present studies (Fig. 1) and 0.31° reported earlier.7 By including a sample thickness correction,61, 62 XAFS measurements can be performed over a much wider angular range, e.g., ±20°. Valuable data available for the removal of DAC glitches would exist in the conical region defined by rotating DAC along x-ray beam direction. As shown in Fig. 6, high data redundancy can significantly improve the signal-to-noise ratio of XAFS spectrum, which is highly advantageous for EXAFS compared to XANES.
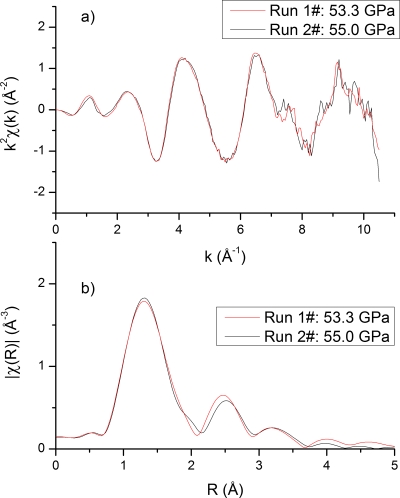
To test the reliability of the DAC glitch removal method at high pressure, Fig. 7 shows the reproducibility of deducing Ge K-edge XAFS of GeO2 glass from two independent DAC experiments above 50 GPa. Both amplitudes and frequencies of oscillations in k2χ(k) and ∣χ(R)∣ curves are nearly identical, indicating the validity of the proposed iterative algorithm for the removal of DAC glitches. Please note that no attempt for DAC orientation optimization was made prior to the measurement. Acquiring redundant data in a small DAC orientation region is sufficient and essential for a continuous, reproducible and glitch-free XAFS spectrum at high pressure (Fig. 6). To our best knowledge, no classical energy scan XAFS measurements in transmission mode have been carried out on GeO2 samples with a DAC at pressures above 10 GPa, whereas existing data at high pressures (<30 GPa) were collected by ED-XAFS.
Figure 7.
Reproducibility of determining Ge K-edge XAFS of GeO2 glass at high pressure from two independent DAC experiments.
To validate the derived XAFS data of GeO2 glass at high pressures above 30 GPa, it is necessary to compare the values of Ge–O distances determined by the energy dispersive and energy scan XAFS methods at the same low pressure range. To this end, a very simple one-shell model was chosen in all cases.
In EXAFS analyses, the values of photoelectron energy origin, E0, and Fourier windows were set the same in all of fits so as to alleviate the correlations between path lengths and E0, and Debye–Waller factors and the amplitude reduction factor. The apodization window is of the Hanning type between 1 and 10 Å−1. A quantitative analysis of the XAFS was performed on the first shell of ∣χ(R)∣ by using a back Fourier filtering has then been applied within the 1.0–2.2 Å R window. We used the automated first shell fit implemented in ARTEMIS programs67 of the IFEFFIT package68 where an input file was built and the first path was imported for the FEFF calculation69, 70 to determine the best match to the experimental data. All the experimental data have been processed using the same procedures and using the same set of parameters so as to minimize random errors.
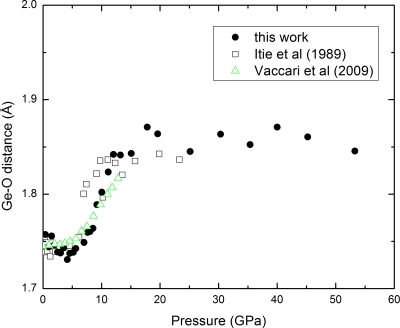
Figure 8 shows the evolution of Ge–O distances of GeO2 glass obtained from the ARTEMIS analysis in terms of the first scattering paths of Ge–O as a function of pressure up to 53.3 GPa. The derived Ge–O distances are basically in good agreement with the earlier published data at low pressure ranges of below 6 and 11–16 GPa,25 and the very recent results of Ge–O distance in GeO2 glass77 recorded using a Paris Edinburgh cell78, 79 in the range of 6–10 GPa where intermediate state exists.60, 61 The values of Ge–O distance show a V-shape minimum at 2.5–5 GPa and a kink at 7–9 GPa, confirming the existence of intermediate states at these pressure ranges.61, 60 After completion of the octahedral transition (15 GPa), the Ge–O distance does not show a simple compression behavior, indicating that a post-octahedral compression process is active.61 The high pressure variation in Ge–O distance appears at about 25 GPa. Detailed data analysis including higher shells and further details on spectral interpretation will be described elsewhere.80
Figure 8.
Evolution of the first shell Ge–O distance of GeO2 glass as a function of pressure (full circles) up to 53.3 GPa. For comparison, open squares are from Ref. 25, while open up triangle is from the recent results of Ref. 77.
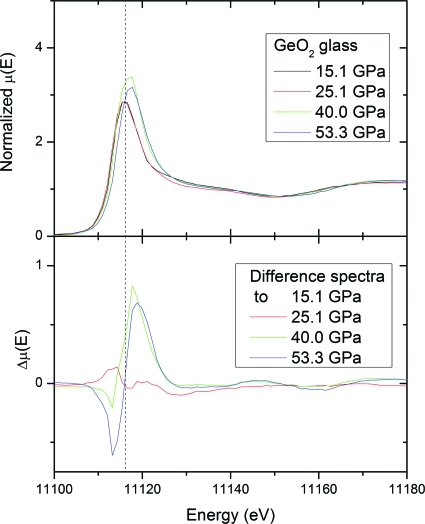
As an additional check on the possible amorphous-amorphous transition at 25 GPa in GeO2 glass, we examined the XANES spectra, which can provide information about the valence state and local symmetries of the Ge atom. Figure 9 shows the Ge K-edge XANES spectra of GeO2 glass obtained at pressures of 15.1, 25.1, 40.0, and 53.3 GPa, as well as the difference spectra compared to the spectrum at 15.1 GPa. The energy point of the white line maximum at 15.1 GPa is located at E=11.1161 keV, as indicated by the dashed line.
Figure 9.
(a) Ge K-edge XANES spectra of GeO2 glass obtained at pressures of 15.1, 25.1, 40.0, and 53.3 GPa; (b) the difference spectra compared to the spectrum at 15.1 GPa. The energy point of white line maximum at 15.1 GPa is at E=11.1161 keV, as indicated by the dashed line. Note the pressure induced energy shift and the emergence of a strong peak in the difference spectra (E=11.1182 keV) as pressure exceeds 25 GPa.
The XANES spectrum of GeO2 glass at 25.1 GPa shows fairly similar white line to that of 15.1 GPa and little change above the edge, while the XANES spectra above 25 GPa show dramatic changes in their relative intensities and positions with increasing pressure [Fig. 9b]. Note the pressure shift and the emergence of a strong peak at the difference spectra (E=11.1182 keV) as pressure exceeds 25 GPa. The position of the main absorption edge remarkably moves 2 eV to a higher energy, a sign of significant modification in Ge–O coordination (Fig. 8). The normalized white line height is a useful measure of phase transitions in GeO2 glass. Striking changes in the shape of the absorption edge (white line) and of the near edge region indicates further geometrical and∕or chemical modifications in the close environment of the absorber. This provides clear evidence for a transition at pressures above 25 GPa to a more compact arrangement of atoms.
Finally, it should be pointed out that XAFS measurements in the transmission energy scanning mode present their own challenges, including the presence of diffraction and absorption of DAC and uncertainties in sample thickness under high pressure. The sample thickness, which is restricted by DAC gasket, is hardly optimized at each pressure step. At high pressure deformation of diamond anvils occurs and sample thickness becomes considerable thinner as increasing pressure.62 Changes in sample thickness is not sensitive to the interatomic distance but has significant influence on the amplitude of EXAFS.81 Accurate measurement of the amplitude of EXAFS is required in determining the number of given atoms and the disorder at a distance.81 Therefore, correction on sample thickness, which can be determined using the method reported previously,62 is needed for EXAFS analysis at high pressure.
It is becoming increasingly apparent that structural information is critical in understanding the nature of matter under high pressure. Since the early 1970s DAC technology has enabled pressures of several hundreds of GPa to be applied to very small samples (a few tens of micrometers in diameter). The XAFS technique is especially important because of the unique electronic and structural information provided about the absorbing atom. With x-ray beam sizes readily achievable down to a few micrometers, the major concern for combining XAFS and DAC techniques is the DAC induced glitches. The data presented here indicate that with optimized hardware and software, the influence of DAC induced glitches can be minimized and high quality XAFS data can be acquired both at energy scan or dispersive XAFS stations. The future of the method looks very promising in the megabar region, especially if one considers that there are numerous data available for the removal of DAC induced glitches in the cone of DAC openings and improvements in x-ray focusing optics will be forthcoming.
CONCLUSION
In summary, we have introduced an effective method for precisely measuring x-ray absorption spectroscopy spectra at high pressure with DAC. It has been shown to markedly alleviate the problem of glitches induced by diamond anvils. The DAC induced glitches, which are very sensitive to the relative orientation between DAC and incident x-ray beam, can be effectively eliminated by redundant measurements at a small angle range, e.g., within 3°. Demonstration XAFS spectra recorded for rutile-type GeO2 with and without the DAC show similar quality up to 440 eV above the absorption edge. Accurate XAFS spectra of GeO2 glass have been obtained at high pressures up to 53.3 GPa, showing good agreement with the published data at low pressures. Clear evidence of an amorphous-amorphous phase transition has been observed at a pressure of 25 GPa. This method should be applicable for in situ XAFS measurements using DACs up to ultrahigh pressures.
ACKNOWLEDGMENTS
We would like to thank M. Szebenyi, X. M. Yu, and G. Shen for their support to this research. This work was supported by the NSF-EAR under Grant No. 0229987. The GSECARS sector was supported by the NSF (Earth Sciences Instrumentation and Facilities Program, EAR-0622171) and DOE (Geoscience Program, DE-FG02-94ER14466). Macromolecular Diffraction at CHESS (MacCHESS) facility was supported by Award No. RR-01646 from the National Institutes of Health through its National Center for Research Resources. CHESS is supported by NSF award DMR-0225180.
References
- Sayers D. E., Stern E. A., and Lytle F. W., Phys. Rev. Lett. 27, 1204 (1971). 10.1103/PhysRevLett.27.1204 [DOI] [Google Scholar]
- Ingalls R., Garcia G. A., and Stern E. A., Phys. Rev. Lett. 40, 334 (1978). 10.1103/PhysRevLett.40.334 [DOI] [Google Scholar]
- Ingalls R., Crozier E. D., Whitmore J. E., Seary A. J., and Tranquada J. M., J. Appl. Phys. 51, 3158 (1980). 10.1063/1.328064 [DOI] [Google Scholar]
- Chemical Analysis, edited by Koningsberger D. C. and Prins R. (Wiley-Interscience, New York, 1988), Vol. 92, p. 688. [Google Scholar]
- Rehr J. J. and Albers R. C., Rev. Mod. Phys. 72, 621 (2000). 10.1103/RevModPhys.72.621 [DOI] [Google Scholar]
- Filipponi A., J. Phys.: Condens. Matter 13, R23 (2001). 10.1088/0953-8984/13/7/201 [DOI] [Google Scholar]
- Ohsumi K., Sueno S., Nakai I., Imafuku M., Morikawa H., Kimata M., Nomura M., and Shimomura O., J. Phys. Colloq. 47, C8 (1986). 10.1051/jphyscol:1986835 [DOI] [Google Scholar]
- Sueno S., Nakai I., Imafuku M., Morikawa H., Kimata M., Ohsumi K., Nomura M., and Shimomura O., Chem. Lett. 15, 1663 (1986). 10.1246/cl.1986.1663 [DOI] [Google Scholar]
- Tranquada J. M. and Ingalls R., Phys. Rev. B 34, 4267 (1986). 10.1103/PhysRevB.34.4267 [DOI] [PubMed] [Google Scholar]
- Andrault D. and Poirier J. P., Phys. Chem. Miner. 18, 91 (1991). 10.1007/BF00216602 [DOI] [Google Scholar]
- Yoshiasa A., Nagai T., Ohtaka O., Kamishima O., and Shimomura O., J. Synchrotron Radiat. 6, 43 (1999). 10.1107/S0909049598011947 [DOI] [Google Scholar]
- Di Cicco A., Trapananti A., Faggioni S., and Filipponi A., Phys. Rev. Lett. 91, 135505 (2003). 10.1103/PhysRevLett.91.135505 [DOI] [PubMed] [Google Scholar]
- Filipponi A., Di Cicco A., and De Panfilis S., Phys. Rev. Lett. 83, 560 (1999). 10.1103/PhysRevLett.83.560 [DOI] [Google Scholar]
- Katayama Y., Mizutani T., Utsumi W., Shimomura O., Yamakata M., and Funakoshi K. -i., Nature (London) 403, 170 (2000). 10.1038/35003143 [DOI] [PubMed] [Google Scholar]
- Di Cicco A., Filipponi A., Itié J. P., and Polian A., Phys. Rev. B 54, 9086 (1996). 10.1103/PhysRevB.54.9086 [DOI] [PubMed] [Google Scholar]
- Comez L., Di Cicco A., Minicucci M., Tossici R., Itie J. P., and Polian A., J. Synchrotron Radiat. 8, 776 (2001). 10.1107/S0909049500015909 [DOI] [PubMed] [Google Scholar]
- Filipponi A., Di Cicco A., De Panfilis S., Trapananti A., Itie J. -P., Borowski M., and Ansell S., J. Synchrotron Radiat. 8, 81 (2001). 10.1107/S0909049500019300 [DOI] [PubMed] [Google Scholar]
- Poloni R., De Panfilis S., Di Cicco A., Pratesi G., Principi E., Trapananti A., and Filipponi A., Phys. Rev. B 71, 184111 (2005). 10.1103/PhysRevB.71.184111 [DOI] [Google Scholar]
- Buontempo U., Filipponi A., Martínez-García D., Postorino P., Mezouar M., and Itié J. P., Phys. Rev. Lett. 80, 1912 (1998). 10.1103/PhysRevLett.80.1912 [DOI] [Google Scholar]
- Soldo Y., Hazemann J. L., Aberdam D., Inui M., Tamura K., Raoux D., Pernot E., Jal J. F., and Dupuy-Philon J., Phys. Rev. B 57, 258 (1998). 10.1103/PhysRevB.57.258 [DOI] [Google Scholar]
- Wallen S. L., Pfund D. M., Fulton J. L., Yonker C. R., Newville M., and Ma Y., Rev. Sci. Instrum. 67, 2843 (1996). 10.1063/1.1147115 [DOI] [Google Scholar]
- Fulton J. L., Chen Y., Heald S. M., and Balasubramanian M., Rev. Sci. Instrum. 75, 5228 (2004). 10.1063/1.1813131 [DOI] [Google Scholar]
- Hong X., Inui M., Matsusaka T., Ishikawa D., Huq Kazi M., and Tamura K., J. Non-Cryst. Solids 312, 284 (2002). 10.1016/S0022-3093(02)01687-3 [DOI] [Google Scholar]
- Inui M., Hong X., and Tamura K., Phys. Rev. B 68, 094108 (2003). 10.1103/PhysRevB.68.094108 [DOI] [Google Scholar]
- Itie J. P., Polian A., Calas G., Petiau J., Fontaine A., and Tolentino H., Phys. Rev. Lett. 63, 398 (1989). 10.1103/PhysRevLett.63.398 [DOI] [PubMed] [Google Scholar]
- Sapelkin S. C. B. A. V., Lyapin A. G., Brazhkin V. V., Iitié J. P., Polian A., Clark S. M., and Dent A. J., Phys. Status Solidi B 198, 503 (1996). 10.1002/pssb.2221980166 [DOI] [Google Scholar]
- Itie J. P., Baudelet F., Congeduti A., Couzinet B., Farges F., and Polian A., J. Phys.: Condens. Matter 17, S883 (2005). 10.1088/0953-8984/17/11/018 [DOI] [Google Scholar]
- Pascarelli S., Mathon O., Munoz M., Mairs T., and Susini J., J. Synchrotron Radiat. 13, 351 (2006). 10.1107/S0909049506026938 [DOI] [PubMed] [Google Scholar]
- Dartyge E., Depautex C., Dubuisson J. M., Fontaine A., Jucha A., Leboucher P., and Tourillon G., Nucl. Instrum. Methods Phys. Res. A 246, 452 (1986). 10.1016/0168-9002(86)90131-2 [DOI] [Google Scholar]
- Tolentino H., Baudelet F., Dartyge E., Fontaine A., Lena A., and Tourillo G., Nucl. Instrum. Methods Phys. Res. A 289, 307 (1990). 10.1016/0168-9002(90)90274-A [DOI] [Google Scholar]
- Pascarelli S., Neisius T., De Panfilis S., Bonfim M., Pizzini S., Mackay K., David S., Fontaine A., San Miguel A., Itie J. P., Gauthier M., and Polian A., J. Synchrotron Radiat. 6, 146 (1999). 10.1107/S0909049599000096 [DOI] [PubMed] [Google Scholar]
- Pascarelli S., Mathon O., and Aquilanti G., J. Alloys Compd. 362, 33 (2004). 10.1016/S0925-8388(03)00559-0 [DOI] [Google Scholar]
- Tolentino H., Dartyge E., Fontaine A., and Tourillon G., J. Appl. Crystallogr. 21, 15 (1988). 10.1107/S0021889887008239 [DOI] [Google Scholar]
- Sapelkin A. V., Bayliss S. C., Russell D., Clark S. M., and Dent A. J., J. Synchrotron Radiat. 7, 257 (2000). 10.1107/S0909049500005252 [DOI] [PubMed] [Google Scholar]
- Vanpeteghem R. J. N. C. B., Allan D. R., McMahon M. I., Sapelkin A. V., and Bayliss S. C., Phys. Status Solidi B 223, 405 (2001). [DOI] [Google Scholar]
- Aquilanti G., Trapananti A., Minicucci M., Liscio F., Twarog A., Principi E., and Pascarelli S., Phys. Rev. B 76, 144102 (2007). 10.1103/PhysRevB.76.144102 [DOI] [Google Scholar]
- Comez L., Di Cicco A., Itié J. P., and Polian A., Phys. Rev. B 65, 014114 (2001). 10.1103/PhysRevB.65.014114 [DOI] [Google Scholar]
- Aquilanti G., Libotte H., Crichton W. A., Pascarelli S., Trapananti A., and Itie J. P., Phys. Rev. B 76, 064103 (2007). 10.1103/PhysRevB.76.064103 [DOI] [Google Scholar]
- Dadashev A., Pasternak M. P., Rozenberg G. K., and Taylor R. D., Rev. Sci. Instrum. 72, 2633 (2001). 10.1063/1.1370561 [DOI] [Google Scholar]
- Pascarelli S., Ruffoni M. P., Trapananti A., Mathon O., Aquilanti G., Ostanin S., Staunton J. B., and Pettifer R. F., Phys. Rev. Lett. 99, 237204 (2007). 10.1103/PhysRevLett.99.237204 [DOI] [PubMed] [Google Scholar]
- Flank A. M., Lagarde P., Itie J. P., Polian A., and Hearne G. R., Phys. Rev. B 77, 224112 (2008). 10.1103/PhysRevB.77.224112 [DOI] [Google Scholar]
- Pinsard-Gaudart L., Dragoe N., Lagarde P., Flank A. M., Itie J. P., Congeduti A., Roy P., Niitaka S., and Takagi H., Phys. Rev. B 76, 045119 (2007). 10.1103/PhysRevB.76.045119 [DOI] [Google Scholar]
- Pellicer-Porres J., Segura A., Sanchez-Royo J. F., Sans J. A., Itie J. P., Flank A. M., Lagarde P., and Polian A., Appl. Phys. Lett. 89, 231904 (2006). 10.1063/1.2400109 [DOI] [Google Scholar]
- Aquilanti G., Pascarelli S., Mathon O., Munoz M., Narygina O., and Dubrovinsky L., J. Synchrotron Radiat. 16, 376 (2009). 10.1107/S0909049509007134 [DOI] [PubMed] [Google Scholar]
- Miguel A. S., Libotte H., Gaspard J. P., Gauthier M., Itié J. P., and Polian A., Eur. Phys. J. B 17, 227 (2000). 10.1007/s100510070136 [DOI] [Google Scholar]
- Aquilanti G. and Aquilanti G. and Pascarelli S., J. Phys.: Condens. Matter 17, 1811 (2005). 10.1088/0953-8984/17/12/005 [DOI] [Google Scholar]
- Freund J., Ingalls R., and Crozier E. D., Phys. Rev. B 39, 12537 (1989). 10.1103/PhysRevB.39.12537 [DOI] [PubMed] [Google Scholar]
- Hu Z., Bertram S., and Kaindl G., Phys. Rev. B 49, 39 (1994). 10.1103/PhysRevB.49.39 [DOI] [PubMed] [Google Scholar]
- Kaindl G., Schmiester G., Sampathkumaran E. V., and Wachter P., Phys. Rev. B 38, 10174 (1988). 10.1103/PhysRevB.38.10174 [DOI] [PubMed] [Google Scholar]
- Katayama Y., Mezouar M., Itié J. P., Besson J. M., Syfosse G., Le Fèvre P. and Di Cicco A., J. Phys. IV 7, C2-1011 (1997). 10.1051/jp4:19972120 [DOI] [Google Scholar]
- Ohtaka O., Arima H., Fukui H., Utsumi W., Katayama Y., and Yoshiasa A., Phys. Rev. Lett. 92, 155506 (2004). 10.1103/PhysRevLett.92.155506 [DOI] [PubMed] [Google Scholar]
- Sapelkin A. V. and Bayliss S. C., High Press. Res. 21, 315 (2001). 10.1080/08957950108202590 [DOI] [Google Scholar]
- Varga T., Wilkinson A. P., Jupe A. C., Lind C., Bassett W. A., and Zha C. -S., Phys. Rev. B 72, 024117 (2005). 10.1103/PhysRevB.72.024117 [DOI] [Google Scholar]
- Polian A., Itie J. P., Dartyge E., Fontaine A., and Tourillon G., Phys. Rev. B 39, 3369 (1989). 10.1103/PhysRevB.39.3369 [DOI] [PubMed] [Google Scholar]
- Andrault D., Madon M., Itié J., and Fontaine A., Phys. Chem. Miner. 18, 506 (1992). 10.1007/BF00205265 [DOI] [Google Scholar]
- Cormier L., Ferlat G., Itie J. P., Galoisy L., Calas G., and Aquilanti G., Phys. Rev. B 76, 134204 (2007). 10.1103/PhysRevB.76.134204 [DOI] [Google Scholar]
- Stern E. A., Phys. Rev. B 48, 9825 (1993). 10.1103/PhysRevB.48.9825 [DOI] [PubMed] [Google Scholar]
- Filipponi A., J. Phys.: Condens. Matter 7, 9343 (1995). 10.1088/0953-8984/7/48/022 [DOI] [Google Scholar]
- Decremps F., Datchi F., Saitta A. M., Polian A., Pascarelli S., Di Cicco A., Itié J. P., and Baudelet F., Phys. Rev. B 68, 104101 (2003). 10.1103/PhysRevB.68.104101 [DOI] [Google Scholar]
- Guthrie M., Tulk C. A., Benmore C. J., Xu J., Yarger J. L., Klug D. D., Tse J. S., Mao H. k., and Hemley R. J., Phys. Rev. Lett. 93, 115502 (2004). 10.1103/PhysRevLett.93.115502 [DOI] [PubMed] [Google Scholar]
- Hong X., Shen G., Prakapenka V. B., Newville M., Rivers M. L., and Sutton S. R., Phys. Rev. B 75, 104201 (2007). 10.1103/PhysRevB.75.104201 [DOI] [Google Scholar]
- Hong X., Shen G., Prakapenka V. B., Rivers M. L., and Sutton S. R., Rev. Sci. Instrum. 78, 103905 (2007). 10.1063/1.2795662 [DOI] [PubMed] [Google Scholar]
- Shen G., Liermann H. -P., Sinogeikin S., Yang W., Hong X., Yoo C. -S., and Cynn H., Proc. Natl. Acad. Sci. U.S.A. 104, 14576 (2007). 10.1073/pnas.0703098104 [DOI] [PMC free article] [PubMed] [Google Scholar]
- Newville M., Sutton S. R., Rivers M. L., and Eng P., J. Synchrotron Radiat. 6, 353 (1999). 10.1107/S0909049598016185 [DOI] [PubMed] [Google Scholar]
- Shen G., Prakapenka V. B., Eng P. J., Rivers M. L., and Sutton S. R., J. Synchrotron Radiat. 12, 642 (2005). 10.1107/S0909049505022442 [DOI] [PubMed] [Google Scholar]
- Hemley R. J., Mao H. -k., Shen G., Badro J., Gillet P., Hanfland M., and Hausermann D., Science 276, 1242 (1997). 10.1126/science.276.5316.1242 [DOI] [Google Scholar]
- Ravel B. and Newville M., J. Synchrotron Radiat. 12, 537 (2005). 10.1107/S0909049505012719 [DOI] [PubMed] [Google Scholar]
- Newville M., J. Synchrotron Radiat. 8, 96 (2001). 10.1107/S0909049500016290 [DOI] [PubMed] [Google Scholar]
- Zabinsky S. I., Rehr J. J., Ankudinov A., Albers R. C., and Eller M. J., Phys. Rev. B 52, 2995 (1995). 10.1103/PhysRevB.52.2995 [DOI] [PubMed] [Google Scholar]
- Ankudinov A. L., Ravel B., Rehr J. J., and Conradson S. D., Phys. Rev. B 58, 7565 (1998). 10.1103/PhysRevB.58.7565 [DOI] [Google Scholar]
- San-Miguel A., Libotte H., Gauthier M., Aquilanti G., Pascarelli S., and Gaspard J. P., Phys. Rev. Lett. 99, 015501 (2007). 10.1103/PhysRevLett.99.015501 [DOI] [PubMed] [Google Scholar]
- Poloni R., Aquilanti G., Toulemonde P., Pascarelli S., Floch S. L., Machon D., Martinez-Blanco D., Morard G., and San-Miguel A., Phys. Rev. B 77, 205433 (2008). 10.1103/PhysRevB.77.205433 [DOI] [Google Scholar]
- Benfatto M., Congiu-Castellano A., Daniele A., and Della Longa S., J. Synchrotron Radiat. 8, 267 (2001). 10.1107/S0909049500015338 [DOI] [PubMed] [Google Scholar]
- Longa S. D., Arcovito A., Girasole M., Hazemann J. L., and Benfatto M., Phys. Rev. Lett. 87, 155501 (2001). 10.1103/PhysRevLett.87.155501 [DOI] [PubMed] [Google Scholar]
- Benfatto M., Della Longa S., and Natoli C. R., J. Synchrotron Radiat. 10, 51 (2003). 10.1107/S0909049502018137 [DOI] [PubMed] [Google Scholar]
- Pellicer-Porres J., Segura A., Ferrer C., Muñoz V., San Miguel A., Polian A., Itié J. P., Gauthier M., and Pascarelli S., Phys. Rev. B 65, 174103 (2002). 10.1103/PhysRevB.65.174103 [DOI] [Google Scholar]
- Vaccari M., Aquilanti G., Pascarelli S., and Mathon O., J. Phys.: Condens. Matter 21, 145403 (2009). 10.1088/0953-8984/21/14/145403 [DOI] [PubMed] [Google Scholar]
- Besson J. M., Nelmes R. J., Hamel G., Loveday J. S., Weill G., and Hull S., Physica B 180–181, 907 (1992). 10.1016/0921-4526(92)90505-M [DOI] [PubMed] [Google Scholar]
- Filipponi A., Borowski M., Bowron D. T., Ansell S., Di Cicco A., De Panfilis S., and Itie J. -P., Rev. Sci. Instrum. 71, 2422 (2000). 10.1063/1.1150631 [DOI] [Google Scholar]
- Hong X., Newville M., Sutton S., Shen G., Prakapenka V., and River M. (unpublished).
- Stern E. A. and Kim K., Phys. Rev. B 23, 3781 (1981). 10.1103/PhysRevB.23.3781 [DOI] [Google Scholar]


