Abstract
Reactive oxygen species (ROS) have been suggested to play a major role in aminoglycoside-induced hair cell (HC) loss, but are difficult to detect. Moreover, ROS can occur normally in cells where they have roles in metabolism, cell signaling and other processes. Two new probes, aminophenyl fluorescein (APF) and hydroxyphenyl fluorescein (HPF) are dyes which selectively detect highly-reactive oxygen species (hROS), those most associated with cellular damage. We assessed the presence of hROS in the neonatal rat organ of Corti during chronic exposure to 50 μM gentamicin in vitro, to examine the relationship between cell damage and hROS across HC type and across the three cochlear turns. hROS were initially detected at 48 hours (h), with an increase at 72 h and persistence until at least 96 h. At 48 h, hROS were restricted to outer HCs and occurred prior to loss of stereocilia. At 72 h, outer HCs showed both hROS and stereocilia loss, and hROS were noted in a few inner HCs. Basal turn HCs showed more hROS than middle turn HCs. Very little hROS accumulation or stereocilia loss was observed in the apical turn, even at 72 h. First row outer HCs were most vulnerable to gentamicin-induced hROS, followed by second and then third row outer HCs. Inner HCs behaved similarly to third row outer HCs. By 96 h stereocilia damage was extensive, but surviving HCs showed persisting fluorescence. APF consistently showed more fluorescence than HPF. The results suggest that hROS accumulation is an important initial step in gentamicin-induced HC damage, and that the differential sensitivity of HCs in the organ of Corti is closely related to differences in hROS accumulation.
Keywords: cochlea, inner ear, sensory cell, ototoxicity, free radical, APF
Gentamicin (GM) is a widely used aminoglycoside antibiotic. However the clinical utility of aminoglycosides is limited by the potential for ototoxicity and nephrotoxicity (Forge and Schacht, 2000). GM can induce hearing loss and balance disturbance due to the destruction of hair cells (HCs) (Theopold, 1977). In the cochlea, outer HCs (OHCs) are more sensitive to GM than inner HCs (IHCs), and some rows of OHCs are more sensitive than others (Aran et al., 1982). The mechanism of GM ototoxicity has not been identified with certainty. Research has implicated mixed apoptosis and necrosis of HCs in ototoxicity, related to reactive oxygen species (ROS) formation (Pierson and Møller, 1981; Hirose et al., 1997; Forge and Schacht, 2000). The basis for differential sensitivity of various HC populations is likewise unclear. However, differences in the uptake of GM into various cell types (e.g. Heil et al., 1993) and biochemical differences between HCs, including their ability to resist ROS damage (e.g. Sha et al., 2001), have been proposed.
ROS are ions or very small molecules with unpaired valence shell electrons. They are byproducts of the normal metabolism of oxygen, and some less reactive ROS such as nitric oxide (NO) and hydrogen peroxide (H2O2) have important rolls in cell signaling (e.g. Lee et al., 2007). However, excessive accumulation of these ROS can lead to damage through reaction with many critical cellular molecules (Warner et al., 2004). While high levels of less reactive ROS can be damaging, cellular toxins and stress, particularly mitochondrial stress (Kushnareva et al., 2002), can result in the production of highly-reactive oxygen species (hROS), including free hydroxyl radical (·OH), peroxynitrite (ONOO−) and hypochlorite (−OCl). hROS are more aggressive and are able to oxidize additional classes of molecules. They can be defined as ROS with oxidizing power sufficient to directly hydroxate aromate rings (Setsukinai et al., 2003). ·OH has been shown to directly peroxidize lipids (Warner et al., 2004), participate in apoptosis (Ren et al., 2001; Santos et al, 2008), severely damage DNA (Wiseman and Halliwell, 1996), and produce redox alteration of cell-membrane Ca2+ channels (Az-Ma et al., 1999). Similarly, ONOO− can alter many critical cellular molecules and induce apoptosis (Taylor et al., 2007; Natal et al., 2008).
Many studies have shown a protective effect of ROS-scavenging antioxidants such as glutathione, D-methionine, and superoxide dismutase in aminoglycoside-induced HC damage (Garetz et al., 1994; Ton and Parng, 2005; McFadden et al., 2003). However, relatively few studies have attempted to detect the formation of ROS in HCs exposed to GM (e.g. Hirose et al., 1997), since the detection of ROS requires living tissues and also because ROS are highly unstable. In a recent study, Heinrich et al. (2008) showed no significant change in NO recovered from the supernatants of organ of Corti (OC) cultures incubated in media for 6 hours (h) after removal from GM-treated guinea pigs.
Several methods, including electron spin resonance (Kuppusamy et al., 1994) and chemiluminescence (Yasui and Sakurai, 2000), have been developed to detect ROS in various cell types, but fluorescent detection appears to be superior in terms of high sensitivity, experimental convenience and cellular resolution. 2′,7′-dichlorodihydrofluorescein (DCFH) and hydrorhodamine 123 have frequently been used as fluorescence probes to detect ROS. Hirose et al. (1997) detected ROS in chick HCs after high-dose GM exposure at 37°C in vitro, using DCFH. They documented extremely rapid ROS accumulation, within 10 sec of exposure, reaching a maximum in approximately 100 seconds. However DCFH reacts to a wide variety of ROS, including NO and H2O2, in addition to the more damaging hROS.
Setsukinai et al. (2003) recently developed two dye probes, aminophenyl fluorescein (APF) and hydroxyphenyl fluorescein (HPF), which selectively detect hROS. APF and HPF differentiate hROS from less reactive species such as H2O2, NO, and superoxide (O2 −·). Moreover, used together, APF and HPF can be used to differentiate −OCl from other hROS, since only APF reacts with −OCl. These probes therefore allow the selective detection of forms of ROS more likely to be involved in cell damage. In order to assess the role of hROS in aminoglycoside damage to HCs, we used these probes to detect hROS in the cells of neonatal rat OC after GM exposure in vitro.
EXPERIMENTAL PROCEDURES
Organ of Corti explant culture
Explants consisting of the cochlear sensory epithelium of postnatal day 3 or 4 (p3 or p4) Sprague-Dawley rats were isolated using the methods of Van de Water and Sobkowicz (Van de Water and Ruben, 1974; Sobkowicz et al., 1993). The local animal subjects committee of the San Diego VA Healthcare System approved the surgical procedures in accordance with the guidelines laid down by the National Institutes of Health regarding the care and use of animals for experimental procedures. All efforts were made to minimize the number of animals used and their suffering.
OCs were divided into three portions consisting of the basal, middle and apical turns. The total length of the rat OC is two and one half turns, and we used three quarters of a turn for each apical or middle turn sample and one full turn for the basal turn, excluding the hook region. Explants were maintained in Dulbecco’s Modified Eagle’s medium with 10% fetal bovine serum, 25 mM HEPES, and 30 U/ml penicillin in 8-chamber slide culture plates (Lab-Tek II Chamber Slide, Nalge Nune International, Naperville, IL, USA) and were cultured in an incubator at 37 °C with 5% CO2 and 95% humidity. The cultures were maintained in the above-described initial medium for 18–24 h prior to each experiment.
Chronic exposure to gentamicin
After the initial culture period, explants were exposed to the same media containing 50 μM GM for 24 h, 48 h, or 72 h. At the end of the culture period, the explants were rinsed with modified Hanks’ balanced salt solution containing 10 mM HEPES, 1 mM MgCl2, 2 mM CaCl2, and 2.7 mM glucose. The explants were then loaded with APF (12.5 μM) or HPF (7.5 μM) (Cell Technology Inc., Mountain View, CA, USA) by incubation for 30 minutes (min) at 37 °C in humidified air with 5% CO2. APF and HPF are minimally fluorescent, however when reacted with hROS (·OH, ONOO−, and −OCl), they are converted to fluorescein and exhibit strong, dose-dependent fluorescence (Setsukinai et al., 2003). Before this procedure, we determined the highest concentration of each probe that produced low background fluorescence and optimal detection of hROS in cells.
The fluorescence of fluorescein is unaffected by fixation with aldehydes, and fluorescein is well retained in cells after fixation. We therefore fixed the tissue for additional cytochemical staining. The explants were rinsed with modified Hanks’ balanced salt solution 3X and then fixed with 4% paraformaldehyde in phosphate-buffered saline (PBS) for 20 min and washed with PBS twice. The explants were permeabilized with 5% Triton X-100 (Sigma, St. Louis, MO, USA) in PBS with 10% fetal bovine serum for 20 min. The specimens were co-labeled with a conjugated phalloidin-Texas Red probe (1:100, Texas Red X-phalloidin, Invitrogen, Carlsbad, CA, USA) at room temperature for 1 h. Phalloidin is a specific marker for cellular F-actin and labels stereociliary arrays and the cuticular plates of HCs. The explants were then stained with DAPI (1:500) at room temperature for 10 min to label nuclei. They were washed with PBS twice and visualized by a fluorescence microscopy to assess HPF and APF fluorescence, as well as phalloidin and DAPI labeling. Each experiment consisted of OC cultures from 2 rat pups, and experiments were repeated four to six times. Control cultures were maintained in media alone for 72h, and a total of three control experiments were run. Only one GM and one control experiment were performed for 96 h, using basal turn explants, due to extensive damage to the GM-exposed HCs.
Acute exposure to gentamicin
Explants were maintained and cultured in the initial media for 18–24 h. The media were then changed to modified Hanks’ balanced salt solution, and the explants were loaded with APF (12.5 μM) or HPF (7.5 μM) by incubation for 30 min at 37 °C in humidified air with 5% CO2. Explants were then maintained with PBS with GM at 50 μM, 500 μM, or 1000 μM. The presence of hROS was observed by fluorescence microscopy at 0, 2, 10, 20, 40, 60 and 80 min after application of GM. The explants were then fixed with 4% paraformaldehyde, and stained and visualized as above. Each experiment used OC samples from two rat pups, and four experiments were performed.
Data analysis
The formation of hROS and the loss of HC stereocilia were analyzed according to cochlear turn: basal, middle, and apical. The results were also analyzed by the row of OHCs and by OHCs versus IHCs. The row of OHCs was indicated as follows; the first row was the nearest to the IHCs, followed by the second and then the third rows (Fig. 1). Loss of stereocilia on HCs was recorded if no stereocilia were observed at the appropriate location. Quantitative analysis was obtained by evaluating 30 OHCs associated with 10 IHCs in a given microscope field. The sensitivity of the probes to detect GM-induced hROS was compared between APF and HPF by counting the number of cells that were clearly labeled by each probe in each condition. Three to four random microscope fields were counted for each explant, and these were averaged to obtain a value for that explant. Explant values were further averaged across the four to six replications of each experiment. Statistical analysis was performed with two-way ANOVA to determine the significance of main and interactive effects. For individual groups Fisher’s protected least-significant difference (PLSD) test, with correction for multiple tests, was employed and differences associated with P values of less than 0.05 were considered to be statistically significant. All data are presented as means and SDs.
Fig. 1.
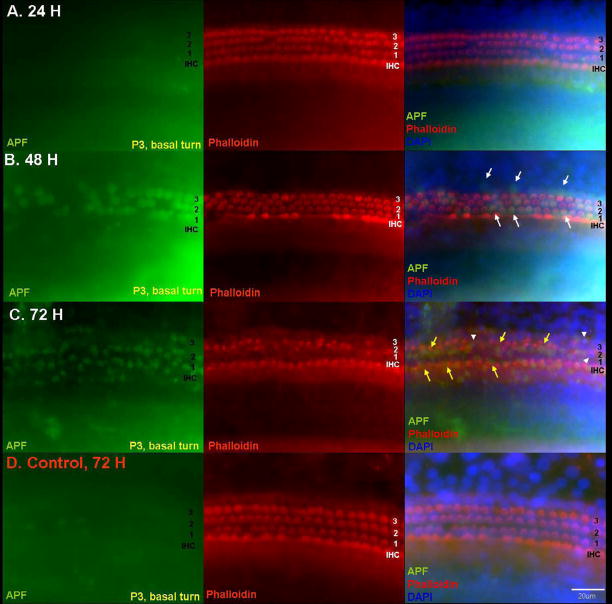
Detection of hROS after 50 μM GM exposure in p3 basal turn OC explants using the APF probe. Explants exposed to GM for 24 h (A), 48 h (B), or 72 h (C) are compared to an untreated normal control explant cultured for 72 h (D). APF fluorescence is shown in the left column, while stereociliary actin is labeled with Texas Red-phalloidin in the middle column. The right column shows merged images with APF fluorescence (green), actin (red), and DAPI (blue). Evidence of hROS formation was rarely observed at 24 h. APF fluorescence was initially detected at 48 h, and was restricted to OHCs (white arrows). At this time, normal phalloidin and DAPI staining of HC morphology was observed, which suggests that hROS formation occurred prior to stereocilia or cell body damage. At 72 h, the number of cells exhibiting APF fluorescence had increased. Many first row OHCs were missing. APF fluorescence (yellow arrows) was detected in the first and second rows of OHCs and in a few IHCs, and was associated with loss of stereocilia in OHCs. A few nuclei (white arrow-heads) showed a condensed or fragmented appearance at 72 h, suggesting apoptosis. Normal control explants showed no hROS and no loss of stereocilia at 72 h. Scale bar = 20 μm.
Intensity of HC fluorescence was also used to compare the sensitivity of APF and HPF probes to hROS formation in acute and chronic exposure to GM. The fluorescence intensity in HCs was analyzed with ImageJ® (National Institutes of Health, Bethesda, MD, USA) software, by outlining 20 individual HCs of each type in each explant, subtracting background fluorescence, averaging fluorescence intensity for the HCs from that explant, and then further averaging across the replications per condition. Intensities were in arbitrary units determined by the software. Fluorescence intensities between the two fluorophores were compared using Student’s t-test.
RESULTS
Effects of fixation and cytochemistry on APF and HPF labeling
As noted above, fluorescein fluorescence is unaffected by aldehyde fixation, and is well retained inside of cells. However, to verify whether the fluorescence observed in HCs was affected by processing for histochemistry, we compared APF and HPF fluorescence prior to and after fixation and histochemical staining. No change in either the intensity or pattern of fluorescent labeling was noted. An example is provided in panels A and B of Figure 8, which show APF labeling of cells in the same tissue sample, when the cells are alive and after processing for histochemistry.
Fig. 8.
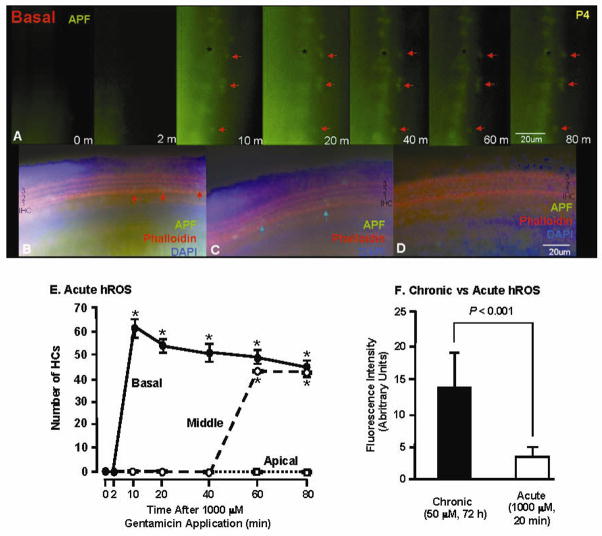
Detection of hROS in HCs exposed acutely to 1000 μM GM using the APF probe. Panel A illustrates the development of fluorescence in the living organ of Corti over time, while Panel B shows the same tissue after fixation and cytochemical processing. The fluorescently labeled HCs in A and B are indicated by red arrows. GM-induced HC fluorescence was initially detected at 10 min, primarily in the first row of OHCs but also in occasional IHCs (A, B, E), and remained relatively constant for 80 min, after which the tissue was fixed for histochemistry. No stereocilia loss was observed at 80 min (B). Fluorescence is also visible in cells immediately inside the HC region (* in A), but unlike HC fluorescence this was also seen in tissue not treated with GM, and may represent cells damaged during tissue dissection or tectorial membrane removal. In the middle turn (C, E), fluorescence (blue arrows) was first observed at 60 min, also primarily in the first row of OHCs and a few IHCs. In the apical turn (D, E), no evidence of hROS formation was detected. (E) The intensity (= intensity of cells minus background intensity) change of fluorescence in labeled HCs during the acute response to high-dose GM exposure. * = significantly different than time 0 and control (P < .05). (F) The intensity of APF fluorescence was higher in HCs exposed chronically to low-dose GM (72 h) than in HCs exposed acutely (20 min) to high-dose GM, suggesting less formation of hROS during acute than in chronic GM exposure.
Detection of hROS with APF or HPF across cochlear turns
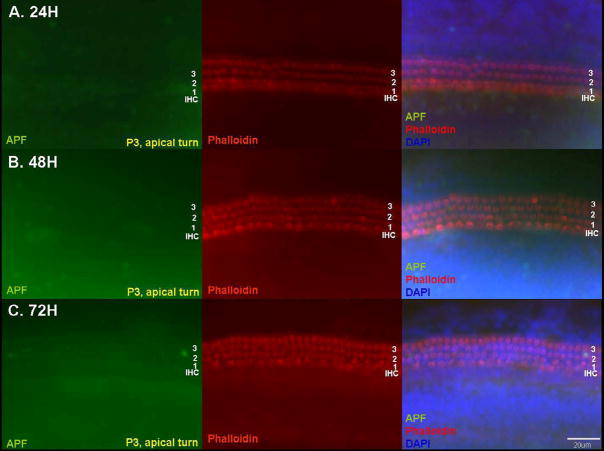
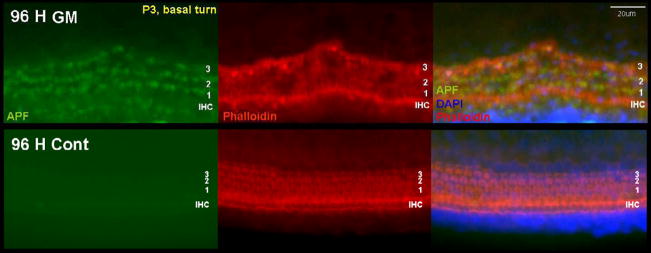
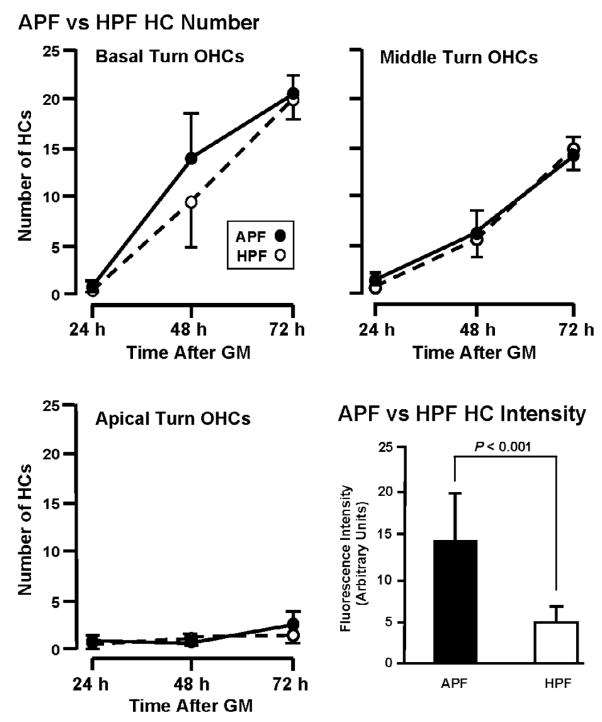
The presence of hROS in HCs varied significantly across time (P < 0.0001, two-way ANOVA) and cochlear turn (P < 0.0001), and each turn differed from the others (P < .001, Fisher’s PLSD). Figure 1 shows fluorescence of the APF probe and loss of HC stereocilia associated with GM exposure in the basal turn. APF fluorescence in OC explants was very modest at 24 h. The average number of OHCs showing APF fluorescence that was obviously above background at 24 h was 1.1 ±1.5 cells per 30 OHCs. No positive cells were observed in the middle or apical turns, and no IHCs were labeled. Substantially more APF fluorescence was observed in the OHCs of basal and middle turn OCs at 48 h. At this time, fluorescence was observed in 14.2 ± 9.3 cells per 30 OHCs in the basal turn. This increased to 20.6 ± 4.3 OHCs at 72 h, and at this time the cell bodies of the fluorescent OHCs had obviously shrunken in diameter and become more irregular. Only a few IHCs showed fluorescence at 48 h (0.33 ± 0.49 cells) and 72 h (1.73 ± 0.94 cells). In the middle turn, APF fluorescence was detected in 6.4 ± 5.6 OHCs at 48 h and 14.2 ± 3.6 OHCs at 72 h. However, the contraction and irregular shape of the fluorescent OHC bodies seen in the basal turn was less apparent in the middle turn at 72 h (data not shown). Again, only a few IHCs showed fluorescence at 48 h and 72 h (0.25± 0.45 cells and 1.13 ± 0.83 cells, respectively). In the apical turn (Fig. 2), only 0.9 ± 1.1 cells and 3.1 ± 3.4 cells per 30 OHCs showed fluorescence at 48 h and 72 h, respectively, with no change in OHC shape. In the few basal turn explants exposed to GM for 96 h, most of the HCs had lost their stereocilia, but were still present. At this point, almost all OHCs and IHCs showed APF fluorescence (Fig. 3). In control cultures maintained without GM, very few HCs showed noticeable hROS accumulation (Figs. 1 and 3).
Fig. 2.
Detection of hROS after 50 μM GM exposure in p3 apical turn OC explants using the APF probe. Apical turn explants showed very little fluorescence and stereociliary damage, even at 72 h. Scale bar = 20 μm.
Fig. 3.
Detection of hROS formation after 50 μM GM exposure for 96 h of p3 rat OC basal turn explants using the APF probe. Most of the GM-exposed HCs had lost their stereocilia, but showed APF fluorescence. Control HCs showed normal stereociliary morphology and no hROS.
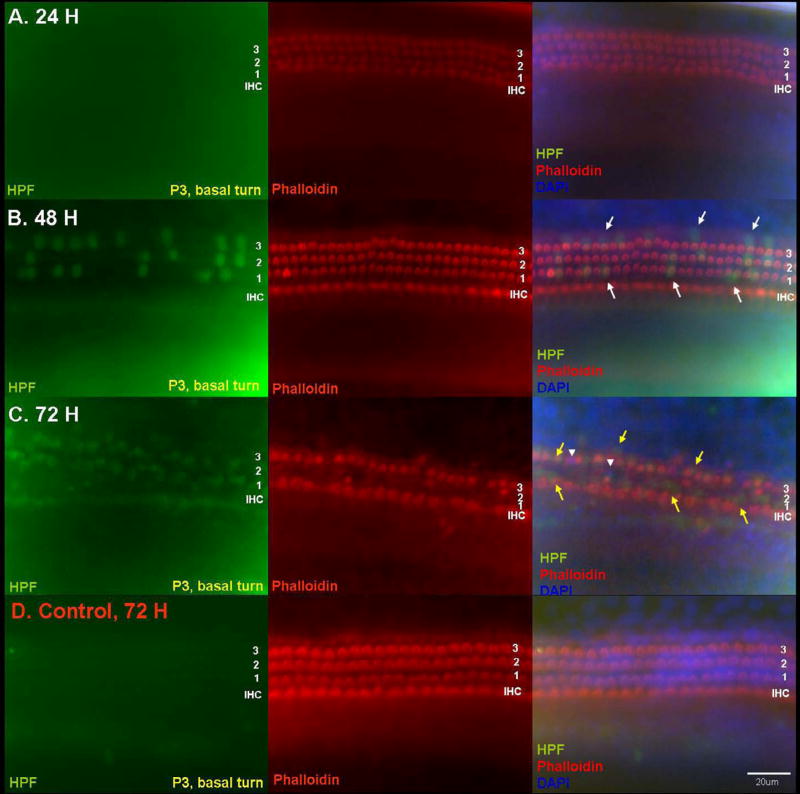
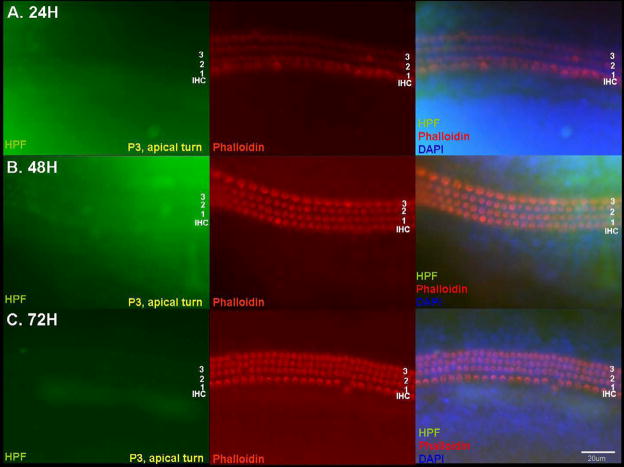
With the HPF probe, the pattern of fluorescence was very similar to that seen using the APF probe (Fig. 4 and 5). Most of the fluorescence was initially detected in HCs of the basal and middle turn OCs at 48 h, with an increase at 72 h. Very little fluorescence was observed in apical turn explants, even at 72 h (Fig. 5). As with APF, very few HCs showed hROS in control cultures (Fig. 4).
Fig. 4.
Detection of hROS after 50 μM GM exposure in p3 basal turn OC explants using the HPF probe. The findings of HPF fluorescence and loss of stereocilia were very similar to those seen with APF, as illustrated in Fig. 1.
Fig. 5.
Detection of hROS in the apical turn with the HPF probe. Little HPF fluorescence and almost no loss of stereocilia was observed in apical turn HCs, even at 72 h. Scale bar = 20 μm.
As noted above, the cell bodies of hROS-positive cells at 24 h and 48 h were normal in appearance, with a round cross-section, round nuclei and normal chromatin. In contrast, at 72 h, hROS-positive cells exhibited morphology distorted compared with that observed at 48 h. These cells showed irregular and shrunken cross-sections, and some hROS-positive OHCs showed condensed or fragmented nuclei suggesting cell apoptosis (Fig. 1 and 4).
Relationship between hROS and loss of stereocilia in various cochlear turns
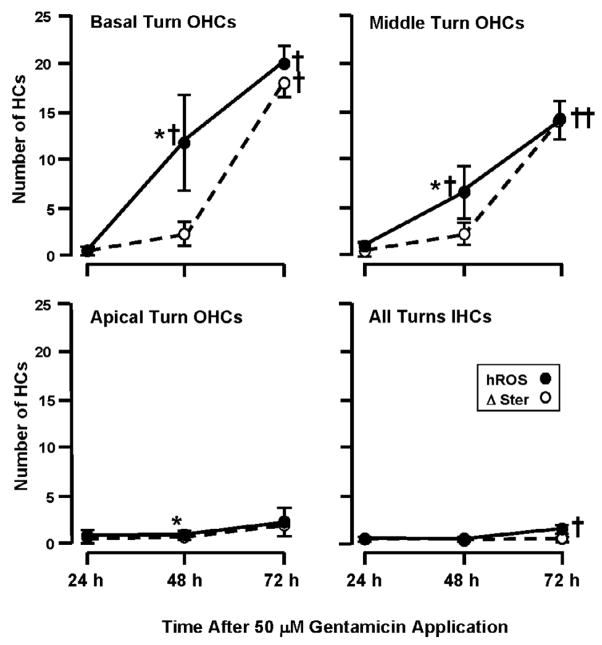
The presence of hROS was compared with loss of stereocilia across cochlear turns, by co-labeling with hROS probes, phalloidin, and DAPI (Fig. 1 to 5). While both HC hROS and stereocilia loss varied significantly across time (P < 0.0001, two-way ANOVA), the pattern of stereocilia loss on basal and middle turn HCs across time showed a significant difference (P < 0.01, two-way ANOVA) from that of hROS (Fig. 6). APF and HPF fluorescence exhibited relatively linear increases over time, with significant differences between 24, 48, and 72 h (p < .05). In contrast, the loss of stereocilia was clearly non-linear. There was little difference between 24 h and 48 h cultures (P > 0.05), although the loss of a few stereociliary arrays was usually detected in basal and middle turns at 48 h. At this time, the number of cells exhibiting stereocilia loss was, 2.3 ± 5.0 per 30 OHCs in the basal turn, and 1.8 ± 3.3 in the middle turn, which is significantly less (P < .005) than cells exhibiting APF or HPF fluorescence (Fig. 6B). The loss of stereocilia increased to 18.2 ± 5.3 cells in the basal turn and 13.9 ± 3.9 cells in the middle turn at 72 h, not significantly (P = 0.2 basal turn, 0.5 middle turn) lower than the number of hROS positive cells (Fig. 6C). Most of the intact stereociliary arrays were observed on third row OHCs and IHCs. Most of the OHCs that had lost their stereocilia still showed evidence of hROS formation. Apical turn explants showed few HCs with loss of stereocilia, even at 72 h. Basal turn explants exposed to GM for 96 h showed loss of stereocilia as well as hROS formation on almost all OHCs and many IHCs.
Fig. 6.
The relationship between the number of cells showing hROS versus those showing loss of stereocilia in chronic, 50 μM GM-treated OHCs of the basal, middle and apical turns, and in the IHCs of all turns combined. Data from APF and HPF have been combined for this and the following figure, thus the numbers differ slightly from those presented in the text. In basal turn OHCs, probe fluorescence (hROS) showed a linear increase over time, while loss of stereocilia (Δ Ster) was delayed, with no significant difference between 24 h and 48 h but an abrupt rise at 72 h. Middle turn OHCs showed a similar pattern, although the levels of hROS and damage were less than in the base. Apical turn OHCs showed little hROS or stereociliary damage (although a slight difference between hROS and damage at 48 h was significant due to extremely low variability). IHCs also showed little HC hROS or damage. † = significant difference (P < .05) from 24 h and control values. * = significant difference (P < .05) between hROS and stereocilia loss.
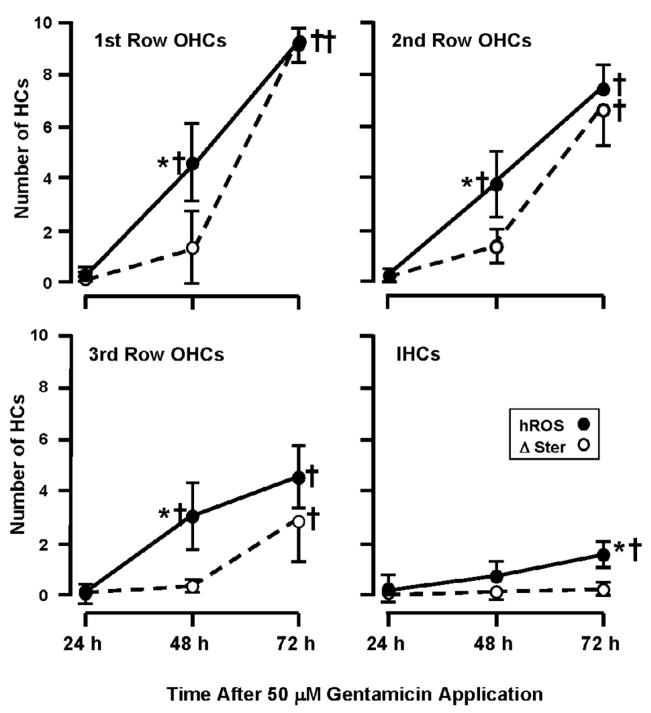
hROS in different types of hair cells
HC types showed differential sensitivity to GM depending upon the row of OHCs and the difference between OHCs and IHCs (p < .0001, two-way ANOVA). Regarding number of cells labeled in the basal turn (Fig. 7), there was a significant difference when all three rows of OHCs were compared to each other, and to IHCs across time (P < 0.001). The first row of OHCs was most sensitive, followed by the second and third rows, and IHCs were the most resistant. Regarding the loss of stereocilia in the basal turn, GM toxicity was also different across the three rows of OHCs and IHCs. As noted above, there was little stereocilia loss at 24 h. At 48 h losses were modest, but the differences between OHC row and between OHC and IHCs were similar to those seen in the presence of hROS. In the middle turn, hROS also showed significant differences (P < 0.05) among the various rows of HCs, except between the third row OHCs and the IHCs (P = 0.128). Similarly, loss of stereocilia showed differences among the various HC rows and over time, except between the third row OHCs and IHC (P = 0.396) and between 24 h and 48 h (P = 0.644).
Fig. 7.
The relationship between hROS and loss of stereocilia in 50 μM GM-treated HCs, according to HC row, in the basal turn. As in Figure 6, APF and HPF data have been combined. All three rows of OHCs showed a roughly linear rise in hROS overtime, with significant increases in hROS formation at 48 h and 72 h (P < 0.001). The first row OHCs showed the highest levels, with progressively less in higher OHC rows. Significant numbers of IHCs with hROS were observed only at 72 h. As noted in Figure 6, there was no significant loss of stereocilia (Δ Ster) at 48 h in any OHC row, but a significant loss at 72 h that was also graded across the rows of OHC. There was significantly more hROS than stereociliary damage in all OHC rows, at 48 h. At 72 h, the relationship between hROS and stereociliary damage differed between the rows of OHCs. There were progressively fewer cells showing stereociliary damage than hROS across OHC row, and no significant damage in IHCs. That is, stereocilia loss was significantly lower than hROS formation in the third row of OHCs and in IHCs (P < .05). † = significant difference (P < .05) from 24 h and control values. * = significant difference (P < .05) between hROS and stereocilia loss.
Apical turns generally showed little evidence of toxicity and little difference in GM sensitivity among HC rows. However, hROS as well as loss of stereocilia did show a significant difference between the first row OHCs and both the third row OHCs (P < 0.01) and the IHCs (P < 0.01).
Immediate production of hROS in response to acute gentamicin exposure
Hirose et al. (1997) observed an extremely rapid appearance of ROS in HCs with the probe DCFH, within seconds after the cells were exposed to 100, 500 or 1000 μM GM. To determine whether hROS are produced under these circumstances, we applied 50, 500, or 1000 μM GM to OC explants loaded with APF or HPF. APF probe fluorescence was observed only in HCs of explants treated with 1000 μM (Fig. 8), but not with 50 or 500 μM. Using the APF probe, moderate fluorescence was first detected after 10 min of GM exposure, (P < 0.01), and primarily in the first row of OHCs of the basal turn explants. This observation remained constant for 80 min. No HC loss was observed. In the middle turn, APF fluorescence was observed at 60 min primarily in first row OHCs, lasting until 80 min. Apical turn explants did not show any labeling. The HPF probe did not show any labeling of OHCs or IHCs at any time in this acute study.
Figure 8F shows a comparison of the fluorescence observed during acute (20 min) exposure to GM at 1000 μM, and fluorescence intensity observed during chronic exposure (72 h) to 50 μM GM, in basal turn explants using the APF probe. The intensity of fluorescence was determined from the average intensity of individual hROS-positive cells, with background intensity subtracted from the measurement for each cell. Fluorescence intensity of hROS was significantly (P < .001) higher during chronic than during acute GM exposure.
Comparison of sensitivity of APF and HPF to detect gentamicin-induced hROS formation
Figure 9A shows the relative sensitivity of the APF and HPF probes to detect hROS in HCs. When the number of HCs labeled by APF versus HPF was compared across turns and time, no significant difference was observed (P = 0.358, two-way ANOVA), as illustrated for OHCs in each cochlear turn. In terms of the intensity of fluorescence, however, APF was more sensitive to hROS than HPF, as illustrated for HCs in basal turn explants exposed to GM for 72 h. Fluorescence intensity was consistently and significantly higher when using the APF compared to the HPF probe (P < 0.001), with HPF producing only about 40% of the fluorescence level observed with APF.
Fig. 9.
Comparison APF and HPF fluorescence in OHCs during chronic exposure to 50 μM GM. The two probes identify similar numbers of cells containing hROS (P = .036). In contrast, the intensity of fluorescence observed with APF was significantly greater than that seen with the HPF probe (P < 0.001), as shown for positive cells in basal turns exposed to GM for 72 h.
DISCUSSION
Gentamicin damage involves ROS
GM is an iron chelator (Priuska et al., 1998) that enhances iron-mediated lipid peroxidation (Priuska and Schacht, 1995). GM is thought to stimulate ROS formation following bioactivation in cells (Sha and Schacht, 1999), and GM-induced HC death is hypothesized to involve the generation of ROS. This is supported by several studies demonstrating a protective effect of antioxidants, including superoxide dismutase (Pierson and Møller, 1981; McFadden et al., 2003; Kawamoto et al., 2004), glutathione (Hoffman et al., 1988; Garetz et al., 1994), catalase (Kawamoto et al., 2004) and alpha-tocopherol (which specifically suppresses membrane lipid peroxidation; Fetoni et al., 2004). These have all been shown to inhibit aminoglycoside-induced HC death. However, documenting the production of ROS in HCs and relating that production to cell damage has been difficult.
ROS versus hROS detection
As discussed above, Hirose et al. (1997) observed ROS formation in chick HCs using DCFH, within seconds after applying high concentrations of GM (100, 500, 1000 μM). No difference was observed between basal and apical regions of the cochlea, and no evidence of ROS formation was observed at GM dosages comparable to those seen in perilymph during HC damage in vivo (20–50 μM; Tran Ba Huy et al., 1986). Using chronic exposure to low-dose GM, we obtained the first evidence detailing the relationship between hROS formation and damage in individual HCs. Based on the fluorescence of APF and HPF, the formation of hROS in cochlear HCs exposed to GM was detected at least one day prior to the loss of stereocilia, and was maintained well after this loss (Figs. 1 to 5), indicating that generation of hROS is both an initial step and an ongoing process in GM-induced HC death. Moreover, hROS were observed in basal turn HCs and to a lesser extent in middle turn HCs, but not in apical turn HCs.
The differences between the results of the Hirose et al. (1997) and the present study may reflect the nature of the probes used in each set of experiments. DCFH responds to less reactive species of ROS than APF and HPF, species that may be involved in normal cellular processes. Indeed, DCFH has frequently been employed to document NO formation related to cell signaling (Cassidy et al., 2000). In contrast, as discussed above, APF and HPF show fluorescence only upon reaction with much more reactive hROS species such as ·OH, ONOO−, and/or −OCl, and not with less reactive ROS such as singlet molecular oxygen (1O2), O2−·, H2O2, NO, and peroxyl radical (ROO·) (Setsukinai et al., 2003). They may thus be more likely to identify the pathologic process of GM-induced ROS formation, by excluding reaction with less toxic ROS species. Our results presumably reflect the production in GM-exposed HCs of the more energetic and damaging hROS species.
Of course, another possibility is a species difference in ROS accumulation between chicken and rat, or between neonatal and mature HCs. There are many similarities between chicken and mammalian HCs, including greater basal (proximal in the chicken) and OHC (short HCs in the chicken) sensitivity to aminoglycosides both in vivo (Hashino et al., 1995) and in vitro (Frenz et al., 1998). However, chick HCs are also different both structurally and functionally from mammalian HCs, especially OHCs. (e.g. Tanaka and Smith, 1978; Patuzzi and Bull, 1991) Similarly, while neonatal rodent HCs share functional mechanoelectrical transduction (MET) channels (e.g. Kros et al., 1992) and other specializations with more mature HCs such as those present in the chick, they remain incompletely developed and immature HCs are more sensitive to many damaging agents than adult HCs (Henley and Rybak, 1995). However, neonatal rats have been shown to exhibit similar in vivo cochlear turn and HC row sensitivities to GM as are seen in adults (Lenoir et al., 1983).
hROS and hair cell damage sensitivity
Even with the use of neonatal HCs, in our chronic experiment we observed fluorescence consistent with hROS formation that was most prominent in OHCs, was graded from base to apex, and was furthermore graded from the first to the third row of OHCs and IHCs. All of these features reflect the sensitivity of HCs to GM in the in vivo cochlea (e.g. Fausti et al., 1984; Hinojosa et al., 2001). Our studies confirm previous in vitro findings (Richardson and Russell, 1991; Forge and Richardson, 1993; Battaglia et al., 2003) of differential HC sensitivity to aminoglycoside damage. Moreover, in the present study the observed patterns of stereocilia loss were well correlated with the accumulation pattern of hROS (as reflected by APF and HPF fluorescence) in the chronic, low-dose experiment (Fig. 6). This implicates differential hROS accumulation as a major determinant of differential HC damage. The fact that HC hROS accumulation preceded morphological damage by approximately 24 h in most cases is also consistent with a causative role for hROS in HC damage.
The initial presence of hROS in HCs was observed at 48 h. From this, we conclude that hROS accumulation requires hours or days, not minutes, of low-dose GM exposure in vitro. The timing of hROS accumulation could be explained by a delay in the entry of GM into the HC. Hashino and Shero (1995) reported that fluorescently-labeled GM required 12–24 h to enter HCs. Thus one might not expect hROS formation to begin until at least this time. Additional delay could result from the action of endogenous antioxidant enzymes or ROS scavengers, which must be overcome before hROS accumulation begins.
However, other data suggest that GM enters HCs more rapidly than indicated by Hashino and Shero (1995). Marcotti et al. (2005) evaluated blockage of the transduction channel of OHCs by GM using single cell electrophysiology. They concluded, based on the voltage and current dependencies of the observed block, that it occurs via a “punch-through” mechanism in which GM enters the OHC through the transduction channel at a rapid rate, and that this rate is proportional to not only concentration but also the transducer current through the channel.
While the above studies suggest GM entry into HCs either immediately or after 12–24 h of exposure, we first noted HC hROS at 48 h. In either case, entry kinetics would not account for the observed delay in hROS accumulation. The most likely explanation is the action of endogenous antioxidants. Supporting the concept of delay due to endogenous antioxidants, the guinea pig cochlea has been shown to have very high specific activity of endogenous superoxide dismutase (Pierson and Gray, 1982), and antioxidant gene therapy using over-expression of dismutase inhibits both aminoglycoside-induced HC death and hearing loss (Kawamoto et al., 2004). Thus the detection of hROS and HC death may occur when endogenous ROS scavenger can no longer compensate for the amount of hROS produced by GM.
The reasons for differential sensitivity of HCs to hROS and damage remains obscure. However, the GM entry model proposed by Marcotti et al. (2005) has a potentially relevant feature. If the rate of GM entry into HCs is determined in part by transducer current, this could explain why basal turn OHCs show more hROS than apical turn OHCs and IHCs, since these cells are known to have lower transducer currents than basal turn OHCs (He et al. 2004). A perhaps more likely possibility is differential antioxidant protection. It has been noted that the level of the antioxidant glutathione in basal OHCs is low when compared to that of apical OHCs or basal turn IHCs (Lautermann et al., 1995; Usami et al., 1996; Sha et al., 2001). Sha et al. (2001) showed that glutathione was 25% higher in apical cells than basal cells in the guinea pig OC in vitro culture. It is thus possible that hROS accumulation in apical HCs is more effectively reduced by endogenous antioxidants or scavengers. Of course, our data do not distinguish between differences in the formation or reduction of hROS, but only detect the final hROS level. In contrast to cochlear turns, we are aware of no evidence that first row OHCs have reduced levels of antioxidants or higher transduction currents when compared to second and third row OHCs.
The role of hypochlorite in hair cell damage
Finally, we compared the sensitivity of APF and HPF to detect hROS formation under GM (Fig. 9). Under the same conditions of in vitro explant cultures, APF was consistently more fluorescent than HPF in this study, similar to the results of Setsukinai et al. (2003) on a human hepatocellular carcinoma cell line. A primary difference between APF and HPF is that APF is extremely sensitive to −OCl, while HPF is completely insensitive to this hROS (Setsukinai et al., 2003). Differential fluorescence between these probes is thus used as an assay system for OCl− (Sumitomo et al., 2007). However, even in response to other hROS, HPF produces on 56–60% of the fluorescence generated by APF (Setsukinai et al., 2003). Since we found that HPF produced only about 40% of the fluorescence of APF, it is possible that some of this difference is related to differential −OCl sensitivity. However, because HPF fluorescence was similar to APF fluorescence in most respects, −OCl cannot be the only or even the major hROS produced in HCs by exposure to GM. Hypochlorite is produced by the reaction of H2O2 and Cl−, catalyzed by myeloperoxidase. Interestingly, Watanabe and Yagi (2000) documented the production of myeloperoxidase in the OC, including in the HCs, of animals treated with cisplatin. However, the majority of this enzyme was observed in supporting cells, not HCs.
Conclusions
The accumulation of hROS is both an early step and an ongoing process in GM-induced HC death due to low-dose GM exposure in vitro. Differential GM sensitivity of HC types appears to be directly related to variation in their hROS accumulation. In addition, because HPF fluorescence was observed in HCs after GM treatment, the hROS produced by this ototoxin cannot consist entirely of −OCl, implicating other hROS such as ·OH and ONOO−. Finally, the in vitro hROS system developed here can be used in the future to compare and evaluate strategies to protect HCs from damage by reducing destructive hROS formation.
Acknowledgments
This research was supported by the Research Service of the VA, NIH grant DC00139, the National Organization for Hearing Research, and the Korea Research Foundation Grant funded by the Korean Government (MOEHRD, Basic Research Promotion Fund) (KRF-2006-E00081).
List of Abbreviations
- APF
aminophenyl fluorescein
- DCFH
dichlorodihydrofluorescein
- GM
Gentamicin
- h
hours
- H2O2
hydrogen peroxide
- HC
hair cells
- HPF
hydroxyphenyl fluorescein
- hROS
highly-reactive oxygen species
- IHC
inner hair cells
- min
minutes
- NO
nitric oxide
- 1O2
singlet molecular oxygen
- OC
organ of Corti
- OHC
outer hair cell
- −OCl
hypochlorite
- ·OH
hydroxyl radical
- PBS
phosphate-buffered saline
- PLSD
protected least-significant difference
- ROO·
peroxyl radical
Footnotes
Publisher's Disclaimer: This is a PDF file of an unedited manuscript that has been accepted for publication. As a service to our customers we are providing this early version of the manuscript. The manuscript will undergo copyediting, typesetting, and review of the resulting proof before it is published in its final citable form. Please note that during the production process errors may be discovered which could affect the content, and all legal disclaimers that apply to the journal pertain.
References
- Aran JM, Erre JP, Guilhaume A, Aurousseau C. The comparative ototoxicities of gentamicin, tobramycin and dibekacin in the guinea pig. A functional and morphological cochlear and vestibular study. Acta Otolaryngol Suppl. 1982;390:1–30. doi: 10.3109/00016488209108895. [DOI] [PubMed] [Google Scholar]
- Az-ma T, Saeki N, Yuge O. Cytosolic Ca2+ movements of endothelial cells exposed to reactive oxygen intermediates: role of hydroxyl radical-mediated redox alteration of cell-membrane Ca2+ channels. Br J Pharmacol. 1999;126:1462–1470. doi: 10.1038/sj.bjp.0702438. [DOI] [PMC free article] [PubMed] [Google Scholar]
- Battaglia A, Bodmer D, Brors D, Pak K, Frangos JA, Ryan AF. Involvement of Ras activation in toxic hair cell damage of the mammalian cochlea. Neuroscience. 2003;122:1025–1035. doi: 10.1016/j.neuroscience.2003.08.041. [DOI] [PubMed] [Google Scholar]
- Cassidy RA, Burleson DG, Delgado AV, Kohler DJ, Salin ML, Pruitt BA., Jr Effects of heme proteins on nitric oxide levels and cell viability in isolated PMNs: a mechanism of toxicity. J Leukoc Biol. 2000;67:357–368. doi: 10.1002/jlb.67.3.357. [DOI] [PubMed] [Google Scholar]
- Fausti SA, Rappaport BZ, Schechter MA, Frey RH, Ward TT, Brummette RE. Detection of aminoglycoside ototoxicity by high-frequency auditory evaluation:selected case studies. Am J Otolaryngol. 1984;5:177–182. doi: 10.1016/s0196-0709(84)80009-5. [DOI] [PubMed] [Google Scholar]
- Fetoni AR, Sergi B, Ferraresi A, Paludetti G, Troiani D. Alpha-tocopherol protective effects on gentamicin ototoxicity: an experimental study. Int J Audiol. 2004;43:166–171. doi: 10.1080/14992020400050023. [DOI] [PubMed] [Google Scholar]
- Forge A, Richardson G. Freeze-fracture analysis of apical membranes in cochlear cultures: differences between basal and apical-coil outer hair cells and effects of neomycin. J Neurocytol. 1993;22:854–867. doi: 10.1007/BF01186357. [DOI] [PubMed] [Google Scholar]
- Forge A, Schacht J. Aminoglycoside antibiotics. Audiol Neurootol. 2000;5:3–22. doi: 10.1159/000013861. [DOI] [PubMed] [Google Scholar]
- Frenz DA, Yoo H, Liu W. Basilar papilla explants: a model to study hair cell regeneration-repair and protection. Acta Otolaryngol. 1998;118:651–659. doi: 10.1080/00016489850183133. [DOI] [PubMed] [Google Scholar]
- Garetz SL, Altschuler RA, Schacht J. Attenuation of gentamicin ototoxicity by glutathione in the guinea pig in vivo. Hear Res. 1994;77:81–87. doi: 10.1016/0378-5955(94)90255-0. [DOI] [PubMed] [Google Scholar]
- Hashino E, Shero M. Endocytosis of aminoglycoside antibiotics in sensory hair cells. Brain Res. 1995;704:135–140. doi: 10.1016/0006-8993(95)01198-6. [DOI] [PubMed] [Google Scholar]
- Hashino E, TinHan EK, Salvi RJ. Base-to-apex gradient of cell proliferation in the chick cochlea following kanamycin-induced hair cell loss. Hear Res. 1995;88:156–168. doi: 10.1016/0378-5955(95)00109-h. [DOI] [PubMed] [Google Scholar]
- He DZ, Jia S, Dallos P. Mechanoelectrical transduction of adult outer hair cells studied in a gerbil hemicochlea. Nature. 2004;429:766–770. doi: 10.1038/nature02591. [DOI] [PubMed] [Google Scholar]
- Heinrich UR, Helling K, Sifferath M, Brieger J, Li H, Schmidtmann I, Mann WJ. Gentamicin increases nitric oxide production and induces hearing loss in guinea pigs. Laryngoscope. 2008;118:1438–1442. doi: 10.1097/MLG.0b013e3181739bd9. [DOI] [PubMed] [Google Scholar]
- Henley CM, Rybak LP. Ototoxicity in developing mammals. Brain Res Brain Res Rev. 1995;20:68–90. doi: 10.1016/0165-0173(94)00006-b. [DOI] [PubMed] [Google Scholar]
- Hiel H, Erre JP, Aurousseau C, Bouali R, Dulon D, Aran JM. Gentamicin uptake by cochlear hair cells precedes hearing impairment during chronic treatment. Audiology. 1993;32:78–87. doi: 10.3109/00206099309072930. [DOI] [PubMed] [Google Scholar]
- Hinojosa R, Nelson EG, Lerner SA, Redleaf MI, Schramm DR. Aminoglycoside ototoxicity: a human temporal bone study. Laryngoscope. 2001;111:1797–1805. doi: 10.1097/00005537-200110000-00025. [DOI] [PubMed] [Google Scholar]
- Hirose K, Hockenbery DM, Rubel EW. Reactive oxygen species in chick hair cells after gentamicin exposure in vitro. Hear Res. 1997;104:1–14. doi: 10.1016/s0378-5955(96)00169-4. [DOI] [PubMed] [Google Scholar]
- Hoffman D, Jones-King KL, Whitworth C, Rybak L. Potentiation of ototoxicity by glutathione depletion. Ann Otol Rhinol Laryngol. 1988;97:36–41. doi: 10.1177/000348948809700107. [DOI] [PubMed] [Google Scholar]
- Kawamoto K, Sha SH, Minoda R, Izumikawa M, Kuriyama H, Schacht J, Raphael Y. Antioxidant gene therapy can protect hearing and hair cells from ototoxicity. Mol Ther. 2004;9:173–181. doi: 10.1016/j.ymthe.2003.11.020. [DOI] [PubMed] [Google Scholar]
- Kuppusamy P, Chzhan M, Vij K, Shteynbuk M, Lefer DJ, Giannella E, Zweier JL. Three-dimensional spectral-spatial EPR imaging of free radicals in the heart: a technique for imaging tissue metabolism and oxygenation. Proc Natl Acad SCI USA. 1994;91:3388–3392. doi: 10.1073/pnas.91.8.3388. [DOI] [PMC free article] [PubMed] [Google Scholar]
- Kushnareva Y, Murphy AN, Andreyev A. Complex I-mediated reactive oxygen species generation: modulation by cytochrome c and NAD(P)+ oxidation-reduction state. Biochem J. 2002;368:545–553. doi: 10.1042/BJ20021121. [DOI] [PMC free article] [PubMed] [Google Scholar]
- Lautermann J, McLaren J, Schacht J. Glutathione protection against gentamicin ototoxicity depends on nutritional status. Hear Res. 1995;86:15–24. doi: 10.1016/0378-5955(95)00049-a. [DOI] [PubMed] [Google Scholar]
- Lee RL, Westendorf J, Gold MR. Differential role of reactive oxygen species in the activation of mitogen-activated protein kinases and Akt by key receptors on B-lymphocytes: CD40, the B cell antigen receptor, and CXCR4. J Cell Commun Signal. 2007;1:33–43. doi: 10.1007/s12079-007-0006-y. [DOI] [PMC free article] [PubMed] [Google Scholar]
- Lenoir M, Marot M, Uziel A. Comparative ototoxicity of four aminoglycosidic antibiotics during the critical period of cochlear development in the rat. A functional and structural study. Acta Otolaryngol Suppl. 1983;405:1–16. doi: 10.3109/00016488309105593. [DOI] [PubMed] [Google Scholar]
- Marcotti W, van Netten SM, Kros CJ. The aminoglycoside antibiotic dihydrostreptomycin rapidly enters mouse outer hair cells through the mechano-electrical transducer channels. J Physiol. 2005;567:505–521. doi: 10.1113/jphysiol.2005.085951. [DOI] [PMC free article] [PubMed] [Google Scholar]
- McFadden SL, Ding D, Savemini D, Salvi RJ. M40403 a superoxide dismutase mimetics protects cochlear hair cells from gentamicin, but not Cisplatin toxicity. Toxicol Appl Pharmacol. 2003;186:46–54. doi: 10.1016/s0041-008x(02)00017-0. [DOI] [PubMed] [Google Scholar]
- Natal C, Modol T, Osés-Prieto JA, López-Moratalla N, Iraburu MJ, López-Zabalza MJ. Specific protein nitration in nitric oxide-induced apoptosis of human monocytes. Apoptosis. 2008;13:1356–1367. doi: 10.1007/s10495-008-0263-0. [DOI] [PubMed] [Google Scholar]
- Patuzzi RB, Bull CL. Electrical responses from the chicken basilar papilla. Hear Res. 1991;53:57–77. doi: 10.1016/0378-5955(91)90214-t. [DOI] [PubMed] [Google Scholar]
- Pierson MG, Gray BH. Superoxide dismutase activity in the cochlea. Hear Res. 1982;6:141–151. doi: 10.1016/0378-5955(82)90050-8. [DOI] [PubMed] [Google Scholar]
- Pierson MG, Møller AR. Prophylaxis of kanamicin-induced ototoxicity by a radioprotectant. Hear Res. 1981;4:79–87. doi: 10.1016/0378-5955(81)90037-x. [DOI] [PubMed] [Google Scholar]
- Priuska EM, Clark K, Pecoraro V, Schacht J. NMR spectra of iron-gentamicin complexes and the implications for aminoglycoside toxicity. Inorg Chim Acta. 1998;273:85–91. [Google Scholar]
- Priuska EM, Schacht J. Formation of free radicals by gentamicin and iron and evidence for an iron/gentamicin complex. Biochem Pharmacol. 1995;50:1749–1752. doi: 10.1016/0006-2952(95)02160-4. [DOI] [PubMed] [Google Scholar]
- Ren JG, Xia HL, Just T, Dai YR. Hydroxyl radical-induced apoptosis in human tumor cells is associated with telomere shortening but not telomerase inhibition and caspase activation. FEBS Lett. 2001;488:123–132. doi: 10.1016/s0014-5793(00)02377-2. [DOI] [PubMed] [Google Scholar]
- Richardson GP, Russell IJ. Cochlear cultures as a model system for studying aminoglycoside induced ototoxicity. Hear Res. 1991;53:293–311. doi: 10.1016/0378-5955(91)90062-e. [DOI] [PubMed] [Google Scholar]
- Santos NA, Bezerra CS, Martins NM, Curti C, Bianchi ML, Santos AC. Hydroxyl radical scavenger ameliorates cisplatin-induced nephrotoxicity by preventing oxidative stress, redox state unbalance, impairment of energetic metabolism and apoptosis in rat kidney mitochondria. Cancer Chemother Pharmacol. 2008;61:145–155. doi: 10.1007/s00280-007-0459-y. [DOI] [PubMed] [Google Scholar]
- Setsukinai KI, Urano Y, Kakinuma K, Majima HJ, Nagano T. Development of novel fluorescence probes that can reliably detect reactive oxygen species and distinguish specific species. J Biol Chem. 2003;278:3170–3175. doi: 10.1074/jbc.M209264200. [DOI] [PubMed] [Google Scholar]
- Sha SH, Schacht J. Stimulation of free radical formation by aminoglycoside antibiotics. Hear Res. 1999;128:112–118. doi: 10.1016/s0378-5955(98)00200-7. [DOI] [PubMed] [Google Scholar]
- Sha SH, Taylor R, Forge A, Schacht J. Differential vulnerability of basal and apical hair cells is based on intrinsic susceptibility to free radicals. Hear Res. 2001;155:1–8. doi: 10.1016/s0378-5955(01)00224-6. [DOI] [PubMed] [Google Scholar]
- Sobkowicz HM, Loftus JM, Slapnick SM. Tissue culture of the organ of Corti. Acta Otolaryngol Suppl. 1993;502:3–36. [PubMed] [Google Scholar]
- Sumitomo K, Shishido N, Aizawa H, Hasebe N, Kikuchi K, Nakamura M. Effects of MCI-186 upon neutrophil-derived active oxygens. Redox Rep. 2007;12:189–194. doi: 10.1179/135100007X200317. [DOI] [PubMed] [Google Scholar]
- Tanaka K, Smith CA. Structure of the chicken’s inner ear: SEM and TEM study. Am Anat. 1978;153:251–271. doi: 10.1002/aja.1001530206. [DOI] [PubMed] [Google Scholar]
- Taylor EL, Li JT, Tupper JC, Rossi AG, Winn RK, Harlan JM. GEA 3162, a peroxynitrite donor, induces Bcl-2-sensitive, p53-independent apoptosis in murine bone marrow cells. Biochem Pharmacol. 2007;74:1039–1049. doi: 10.1016/j.bcp.2007.06.028. [DOI] [PMC free article] [PubMed] [Google Scholar]
- Theopold HM. Comparative surface studies of ototoxic effects of various aminoglycoside antibiotics on the organ of Corti in the guinea pig. A scanning electron microscopic study. Acta Otolaryngol. 1997;84:57–64. doi: 10.3109/00016487709123942. [DOI] [PubMed] [Google Scholar]
- Ton C, Parng C. The use of zebrafish for assessing ototoxic and otoprotective agents. Hear Res. 2005;208:79–88. doi: 10.1016/j.heares.2005.05.005. [DOI] [PubMed] [Google Scholar]
- Tran Ba Huy P, Bernard P, Schacht J. Kinetics of gentamicin uptake and release in the rat. J Clin Invest. 1986;77:1492–1500. doi: 10.1172/JCI112463. [DOI] [PMC free article] [PubMed] [Google Scholar]
- Usami S, Hjelle OP, Ottersen OP. Differential cellular distribution of glutathione, an endogenous antioxidant, in the guinea pig inner ear. Brain Res. 1996;743:337–340. doi: 10.1016/s0006-8993(96)01090-6. [DOI] [PubMed] [Google Scholar]
- Van de Water T, Ruben RJ. Growth of the inner ear in organ culture. Ann Otol Rhinol Laryngol. 1974;83:1–16. doi: 10.1177/0003489474083S1401. [DOI] [PubMed] [Google Scholar]
- Warner DS, Sheng H, Batinić-Haberle I. Oxidants, antioxidants and the ischemic brain. J Exp Biol. 2004;207:3221–3231. doi: 10.1242/jeb.01022. [DOI] [PubMed] [Google Scholar]
- Watanabe K, Yagi T. Expression of myeloperoxidase in the inner ear of cisplatin-treated guinea pigs. Anticancer Drugs. 2000;11:727–30. doi: 10.1097/00001813-200010000-00009. [DOI] [PubMed] [Google Scholar]
- Wiseman H, Halliwell B. Damage to DNA by reactive oxygen and nitrogen species role in inflammatory disease and progression to cancer. Biochem J. 1996;313:17–29. doi: 10.1042/bj3130017. [DOI] [PMC free article] [PubMed] [Google Scholar]
- Yasui H, Sakurai H. Chemiluminescent detection and imaging of reactive oxygen species in live mouse skin exposed to UVA. Biochem Biophys Res Commun. 2000;269:131–136. doi: 10.1006/bbrc.2000.2254. [DOI] [PubMed] [Google Scholar]


