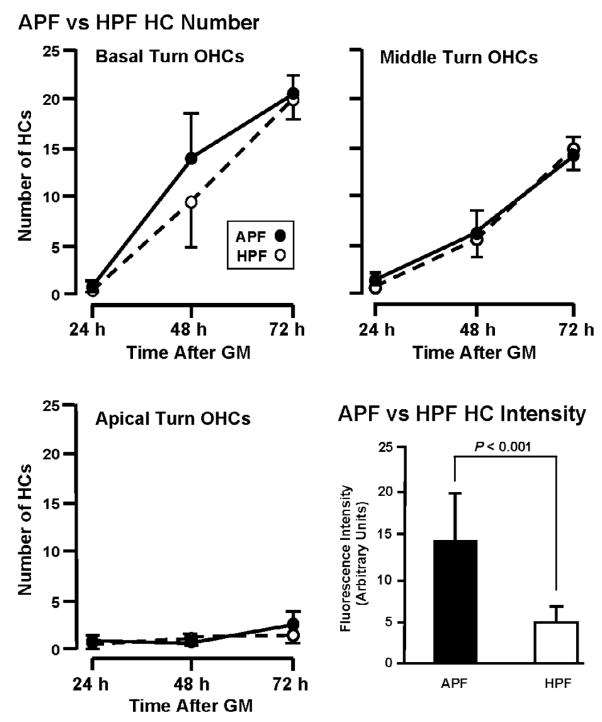
Fig. 9.
Comparison APF and HPF fluorescence in OHCs during chronic exposure to 50 μM GM. The two probes identify similar numbers of cells containing hROS (P = .036). In contrast, the intensity of fluorescence observed with APF was significantly greater than that seen with the HPF probe (P < 0.001), as shown for positive cells in basal turns exposed to GM for 72 h.

