Abstract
This article, adapted from our acceptance speech of the Avanti Award in Lipids at the 47th Biophysical Society meeting in San Antonio, 2003, summarizes over 30 years of research in the area of lipid bilayers. Beginning with a theoretical model of the phase transition (J.F.N.), we have proceeded experimentally using dilatometry and density centrifugation to study volume, differential scanning calorimetry to study heat capacity, and X-ray scattering techniques to study structure of lipid bilayers as a function of temperature. Electron density profiles of the gel and ripple phases have been obtained as well as profiles from several fluid phase lipids, which lead to many structural results that compliment molecular dynamics simulations from other groups. Using the theory of liquid crystallography plus oriented lipid samples, we are the first group to obtain both material parameters (KC and B) associated with the fluctuations in fluid phase lipids. This allows us to use fully hydrated lipid samples, as in vivo, to obtain the structure.
The following text is adapted from the acceptance speech given for the Avanti Award in Lipids at the 47th Biophysical Society Meeting in San Antonio, Texas, March, 2003. Since the award was given jointly, a joint talk was given at the meeting.
We are delighted to receive the Avanti Award, and humble when we realize how many of our colleagues also deserve such recognition for work on lipids and membranes. J.F.N. began working in this area as a theorist in 1970. S.T.-N. joined the laboratory in the early 1980s. Although both of us have worked on proteins, our major focus is lipid bilayers and we hope to convey why we find lipids such an interesting research area.
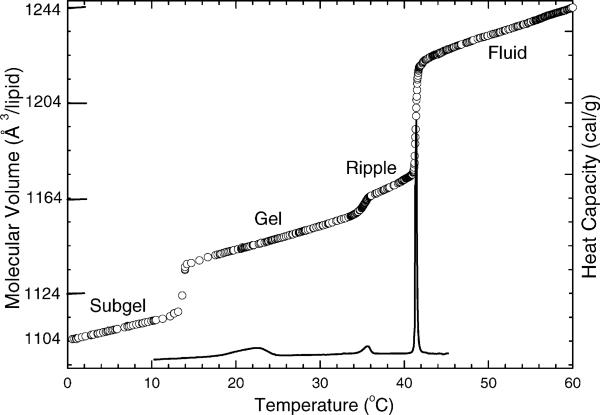
Our work has several flavors, indicated in the title. The first flavor, thermodynamics, is treated in Fig. 1 which shows our measurements, using a differential dilatometer especially constructed in our lab for lipids (Wilkinson and Nagle, 1978), of the molecular volume of the DPPC molecule in bilayers as a function of temperature. Fig. 1 also shows the heat capacity of DPPC obtained using a Microcal (Amherst, MA) differential scanning calorimeter.
Fig. 1.
Molecular volume (open circles) and heat capacity (solid line) vs. temperature for DPPC bilayers in excess water (Nagle and Wilkinson, 1982; Tristram-Nagle et al., 1987).
When J.F.N. got into biophysics, he was a theoretician working in the statistical mechanics of phase transitions, so it was a natural personal transition to try to understand the physics of these transitions. The most important one is the main transition, between the ripple and fluid phases in Fig. 1. The theory involved two levels of modeling. The first level was to understand which energies were important to account for the large calorimetric enthalpy of the transition (ΔHcal ∼ 8 kcal/mol), with some possibilities listed in the following equation:
| (1) |
It was well understood that rotameric disordering of the hydrocarbon chains occurred during the transition into the fluid phase, but this ΔUrot accounted for less than half the measured enthalpy ΔHcal. Another possible source of transition enthalpy is the work required to expand the hydrocarbon chain region against attractive van der Waals interactions, ΔUvdW. Pure theory is inadequate to test this hypothesis in such complicated systems, so this led to begin experimental work to measure volumes (Nagle, 1973b). Together with a simple calculation, the data shown in Fig. 1 confirmed that over half of the enthalpy comes from volume expansion (Nagle and Wilkinson, 1978). This is still not a completely finished story. Another smaller, but still significant enthalpy contribution should come from the hydrophobic free energy required to increase bilayer area; this should be revisited in view of our current structural work which measures these area changes.
The second level of theory involved building a statistical mechanical model of the transition. Although most biophysicists may think lipid bilayers are simple systems, for statistical mechanical modeling they are rather complex and present quite a challenge. The chain model that is isomorphic to the dimer lattice model (Nagle, 1973a, 1980, 1986) is clearly oversimplified, but like a good cartoon, it has the specific properties of hydrocarbon chains that reside in the anisotropic environment of membranes that is brought about by hydrophobicity and the self-assembly of lipid molecules into lipid bilayers. It is often supposed in the statistical mechanics of phase transitions that the Ising lattice model is the ultimate paradigm and there is a tendency for theorists to suppose that similar models should be applied to biomembranes. However, the dimer model is equally profound and it has quite different thermal behavior than the Ising model. In particular, unlike the Ising model, the dimer model respects the frozen-in order of hydrocarbon chains in the gel phase while allowing continuous disordering in the fluid Lα phase. Nagle et al. (1989) give a fuller discussion of these deep theoretical differences, their implications for membranes, as well as connections of these dimer models to other areas of physics.
Fig. 1 also shows two other phase transitions. The subtransition (Chen et al., 1980) has generated much study and some controversy, which is rooted in the difficulty of obtaining and maintaining thermal equilibrium. When the temperature is decreased from the gel phase, formation of the subgel only occurs below 7 °C, but after the subgel is formed, DSC scans show it melting at higher temperature. This is shown by our data in Fig. 1, and it also occurred in the slowest DSC scan rates employed by Sturtevant (Chen et al., 1980). However, despite this hysteresis, there is a true transition temperature that is really 14 °C, as we showed by our much slower volume experiments (Nagle and Wilkinson, 1982), and this lower transition temperature was also obtained by adiabatic calorimetry (Kodama et al., 1985). We also showed which was the equilibrium phase at set temperatures by starting with gel and subgel phases in temporary coexistence and then jumping to the set temperature and observing which phase ate the other (Tristram-Nagle et al., 1987, 1994). We believe that we have explained most of the unusual behavior of this transition in terms of the Kolmogorov–Avrami theory of nucleation and growth of domains (Yang and Nagle, 1988). However, there is still a puzzle as to why the dimensionality of the domains is anomalously low (Nagle et al., 1998).
Although it was not part of the original rationale, volume measurements provide a key datum for structure and this took us into the second flavor of our work. A major structural quantity of interest is the thickness of the membrane. However, there are at least four different thicknesses that have been considered, so we prefer to focus on the unique quantity, the average lipid area A, in the plane of the bilayer. Of course, volume is the connection between area and thickness, so our volume measurements and the determination of A provide thickness information. It was a shock to us that there was so much disagreement among prominent researchers for the benchmark lipid DPPC under the same conditions in the biologically relevant fluid phase. This disagreement is documented in a review (Nagle and Tristram-Nagle, 2000). This disagreement precluded doing better theory and it was impossible to test or guide MD simulations. In the late 1980s, our lab began a transition to research on bilayer structure.
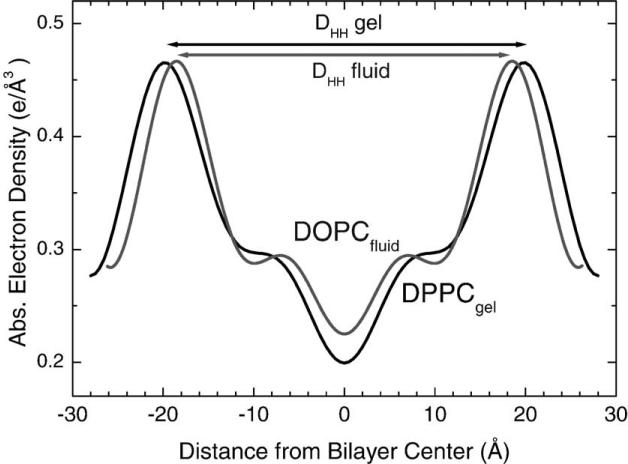
Because direct approaches to the biologically relevant fluid phase had so much uncertainty, we decided to adopt a strategy that had been introduced by McIntosh and Simon (1986) and carried out by them for the lipid DLPE. This strategy is to obtain the detailed structure of the gel phase of a particular lipid and then to bootstrap from the gel phase structure to obtain A for a fluid phase lipid with the same headgroup. The only data that are needed from the fluid phase (indicated by superscript F) are the volume and the head–head spacing () in the electron density profile (EDP) in Fig. 2. Then we use the quantities indicated with a G superscript in Eq. (2) from the structure of the gel phase (Nagle et al., 1996; Nagle and Tristram-Nagle, 2000).
| (2) |
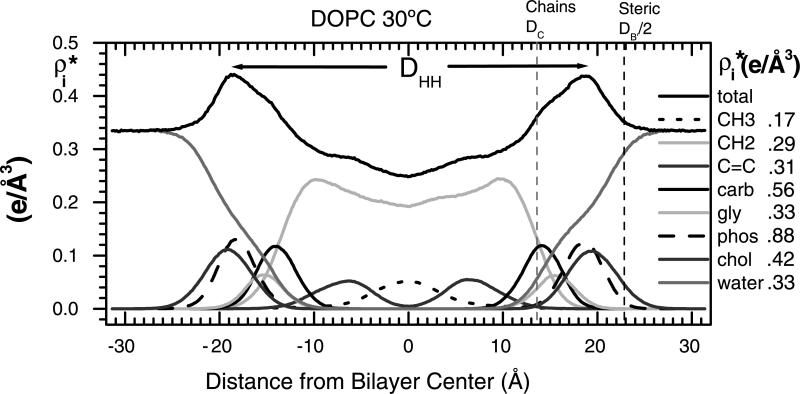
Fig. 2.
Electron density profiles (EDPs) of gel phase (DPPC) and fluid phase (DOPC) bilayers (Tristram-Nagle et al., 1998).
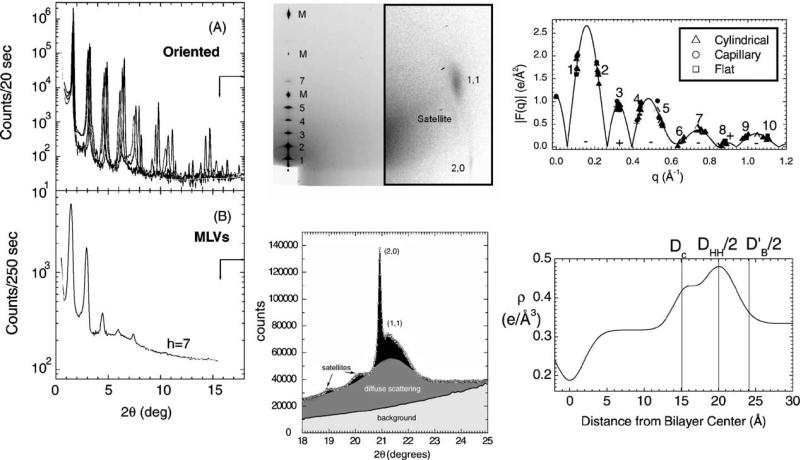
The DPPC gel phase is somewhat more difficult than the DLPE gel phase because the hydrocarbon chains are tilted. We will desist going through a blow-by-blow review of all our gel phase work, except to emphasize that it has taken several iterations. Our former graduate student Michael Wiener undertook our first X-ray study (Wiener et al., 1989) and our first use of oriented samples was published in 1993 (Tristram-Nagle et al., 1993). Another talented graduate student, Wen-Jun Sun did a quantitative fitting of wide-angle powder diffraction data (Sun et al., 1994). Recently, we have published a study for gel phase DMPC (Tristram-Nagle et al., 2002). It involves global fitting of wide-angle chain-packing data, our volume data and many low-angle X-ray data sets for both oriented and MLV samples to obtain F(q) which is the Fourier transform of the electron density profile. The resulting EDP in Fig. 3 shows the Gibbs dividing surface for the hydrocarbon thickness (DC), the steric thickness (DB′) as well as the head-to-head spacing (DHH), which locates the phosphate group.
Fig. 3.
Summary of gel phase work showing low-angle data (left), wide-angle data from oriented sample (upper center), wide-angle data from unoriented MLVS (lower center), continuous Fourier transform (upper right), and electron density profile (lower right) showing three measures of bilayer thickness.
In passing, it is interesting to address the question, why bootstrap from the gel phase? Why not use the subgel phase? It should be even better ordered and therefore more completely characterizable than the gel phase. Despite significant contributions (Ruocco and Shipley, 1982; Blaurock and McIntosh, 1986; Raghunathan and Katsaras, 1996), and despite our thermal protocol for forming the subgel phase with the fewest defects, the structure of the subgel phase is still not as well characterized as the gel phase. This is an outstanding structural problem in lipid physics and chemistry. Why not bootstrap from the ripple phase? The answer to this question is that even with our 2-D electron density map (Sun et al., 1996) we still do not know how the molecules are arranged in the rippled bilayers, whether they are tilted or whether some are melted. This is also an outstanding structural problem in lipid biophysics.
Let us return to our primary goal, which is the fluid phase structure of lipid bilayers. This is the most relevant phase for biophysics because the lipids in most cell membranes have disordered chains. Determining the structure of this phase also presents the most interesting challenge to physics because of fluctuations, which is the third flavor in the title of this talk.
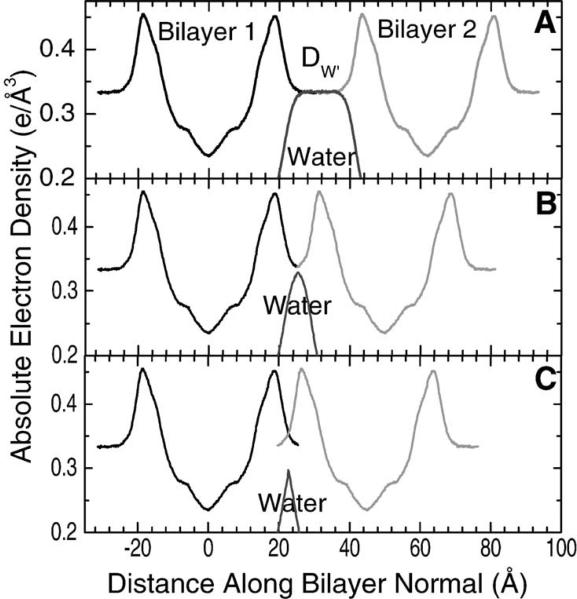
First, why is full hydration important? We address this question in Fig. 4. In Fig. 4A, we have taken an electron density profile from a simulation that Scott Feller did for DOPC in which he used A = 72.2 Å2 and nW = 33, parameters that we had obtained from our X-ray studies (Tristram-Nagle et al., 1998). The EDP is repeated here with the appropriate spacing to show two adjacent bilayers in a fully hydrated array. There is an adequate amount of water, with the water spacing between bilayers, DW′ = 18 Å, so that the interactions between bilayers do not alter the bilayer structure. However, there is a big problem with obtaining nW and A from fully hydrated samples, because there are too few orders of diffraction to obtain EDPs that look like these simulated profiles. To obtain our results, we also had to obtain data from systems like those in Fig. 4B. We mildly dried the sample down to 96−98% RH to be able to see four orders. There is now a much smaller but still non-zero water layer between the bilayers (nW = 14.5, DW′ = 3.6 Å). A is smaller and calculable using Parsegian's osmotic compressibility formula (Rand and Parsegian, 1989):
| (3) |
But the diffracted intensities cannot be trusted. If the system is dried further (Fig. 4C), the intensities can be trusted, but the bilayers are now so close together that the headgroups overlap and there is no space between that is completely water. Not surprisingly, the structure begins to change in ways that are not calculable from the linear compressibility formula. From experimental work (Hristova and White, 1998), this occurs near nW = 12 and this is consistent with MD simulations (Mashl et al., 2001; Perera et al., 1997). Indeed, Fig. 4C assumes that the bilayer thickness does not change, whereas it should become thicker by Eq. (3) and then the crowding of the headgroups would become even worse; this is consistent with the experimental D = 50 Å for nW = 9 (Hristova and White, 1998). Fig. 4C emphasizes an additional problem for future studies with samples that are this dried out. There is no wholly aqueous region to compete for hydrophilic parts of any additive peptides and even the part that is mostly water is too narrow to accommodate alpha helices which have a diameter of about 10 Å. This compromises structural studies of peptide/bilayer mixtures.
Fig. 4.
Simulated EDPs of DOPC and the water contribution from Feller (unpublished). (A) Lamellar repeat spacing D = 63.1 Å corresponds to the fully hydrated DOPC bilayer structure from X-ray diffraction. Water spacing is DW′ = 18.0 Å and water content is nW = 32.8 water molecules per DOPC. (B) Lamellar repeat spacing D = 49.8 Å corresponds to 97% relative humidity (RH), water spacing DW′ = 3.6 Å, and water content nW = 14.5 (Tristram-Nagle et al., 1998). (C) Assuming no change in area from panel (B) gives a lamellar repeat spacing D = 45 Å for nW = 9 with water spacing DW′ < 0.
Returning to our primary goal, the fully hydrated fluid phase structure, why are there so few orders of diffraction for fully hydrated samples and why can not the intensities be trusted? Fig. 5 shows more details of Feller's simulation. Simulations have the advantage over experiment in that they obtain the probability distributions for each atom or molecular component. All simulations indicate that the atoms in lipid bilayers are quite disordered—for example, the phosphate headgroup is distributed with a width of about 5 Å. In passing, it is very encouraging that the thicknesses DC and DB′ that we obtained from our studies and these simulation results agree very well, although this would not have been the case if the A used in the simulation had not been chosen to be the area we found in our experiments. However, let us return to the main question—this kind of disorder is NOT the answer to the problem of too few orders that is encountered in diffraction studies.
Fig. 5.
EDPs obtained by MD simulation by Scott Feller (unpublished). Contributions from the various bilayer molecular components (Armen et al., 1998) are shown at right.
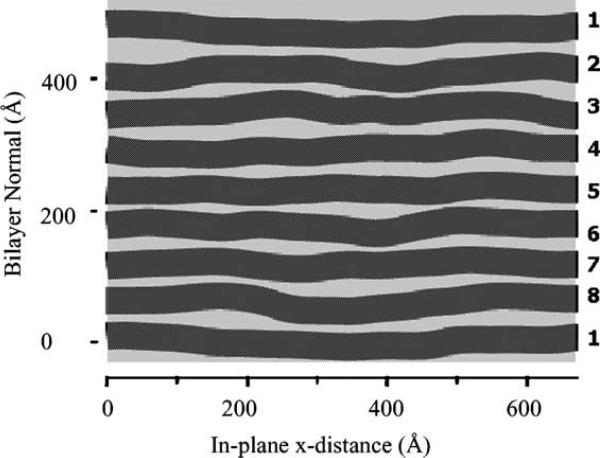
The answer to the question IS disorder, but of a different kind, namely fluctuations between the bilayers. Fig. 6 is a snapshot from a Monte Carlo simulation in which each bilayer is a flexible sheet. The interactions between the bilayers are those that are thought to be present for neutrally charged, zwitterionic lipids, namely an attractive van der Waals interaction and a repulsive hydration force (Rand and Parsegian, 1989). We have found such simulations to be invaluable for studying the interactions between bilayers, which is the last flavor of our work noted in the title of this talk. Our purpose in showing it here is that the simulation shows the disorder of the second kind that is responsible for the difficulties with diffraction data.
Fig. 6.
Monte Carlo (MC) simulation of a stack of bilayers (Gouliaev and Nagle, 1998).
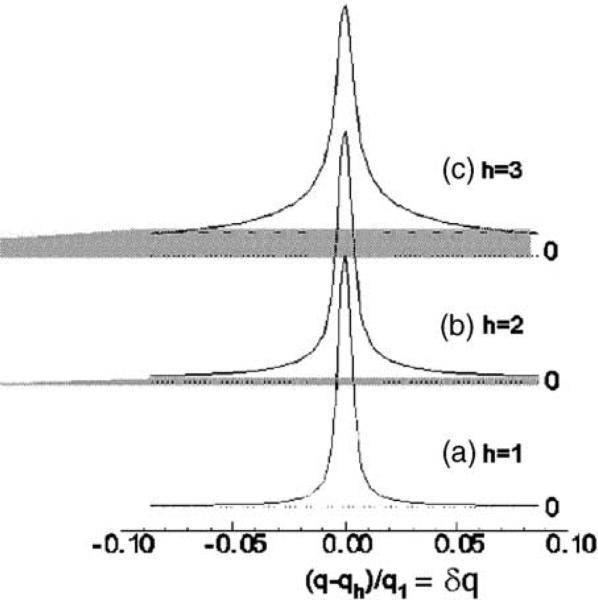
There is a well-developed theory for the statistical mechanics of such systems. The well-known free energy involves a bending modulus (KC) for the membrane, and a compression modulus (B) that accounts for the interactions between membranes. This thermodynamic theory was extended to treat X-ray scattering of such liquid crystal systems by Caillé (1972) and others (Als-Nielsen et al., 1980; Zhang et al., 1994). Fig. 7 shows what happens to the X-ray scattering data. The first order diffraction peak looks fairly normal. But as the order increases, the peaks become lower (we have normalized the peak heights here for easy comparison) and the tails become larger and difficult to distinguish from the general background. In this figure, the intensity that would be lost by assuming that the background was given by the dashed lines includes not only the gray part under the peak but also the entire tail that extends to −0.5 and to +0.5. In order to recover the lost intensity, our student Ruitian Zhang elegantly developed the theory to fit the peaks and the shoulders and that enabled him to extrapolate the considerable lost intensity in the tails (Zhang et al., 1994, 1996). Without this intensity correction, it seemed that the bilayer structure had to change dramatically when full hydration was approached; this spectre was laid to rest by adding back the missing intensity (Nagle et al., 1996). This work on the DPPC fluid phase was done with MLVs that give isotropic or so-called powder diffraction. Very high instrumental resolution is required to resolve the peak shapes, and the intensities are small. In order to even detect fourth order peaks, the samples had to be dried to about 97% RH. Nevertheless, by using the compressibility correction due to osmotic stress, we believe that reliable structural results have been produced that are recorded in a review article (Nagle and Tristram-Nagle, 2000).
Fig. 7.
High-resolution X-ray scattering data from MLVs, peak height normalized to the first order. Lost intensity is partially shown in gray.
We had planned to use this method to study many more lipid bilayers, but then a new opportunity serendipitously arose. Recall that we had to partially dehydrate (Fig. 4B) to get enough corrected orders of diffraction for bilayer structure. There is still about 4 Å of water between the bilayers, so the compressibility correction (Eq. (3)) can still be used if the four orders of diffraction are corrected. But there is not as much water as we would like for future peptide studies. We can now do better.
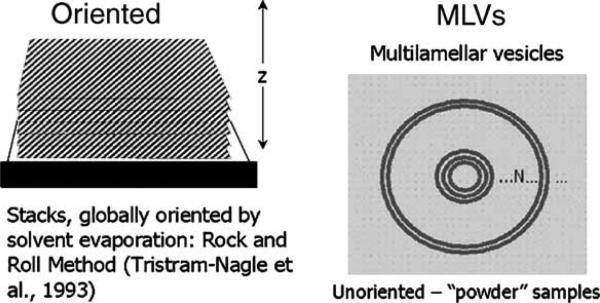
We now think we can obtain structure for fully hydrated systems directly. How? We believe we have a new breakthrough (Lyatskaya et al., 2001). In our previous work, the samples are MLVs (see Fig. 8). In our new approach, the samples are oriented stacks of bilayers. There are obvious advantages because orientation preserves spatial information and it gives more intensity for higher orders. However, for many years, no one was able to fully hydrate oriented stacks of lipids in the fluid phase—this came to be known as the Vapor Pressure Paradox (VPP). But Katsaras (1998) showed that the VPP for the fluid phase is only an artifact of the technical difficulty of achieving 100% RH in X-ray chambers; that was not a problem for John's neutron diffraction chambers. With some consultation from us, Katsaras constructed an X-ray chamber (Katsaras and Watson, 2000) and Horia Petrache in Adrian Parsegian's group has constructed a different one—both achieve full hydration in all phases.
Fig. 8.
Two types of samples for X-ray diffraction: oriented samples of lipids on a solid substrate (left) and unoriented, “powder” samples of lipids in excess water in glass X-ray capillaries (right).
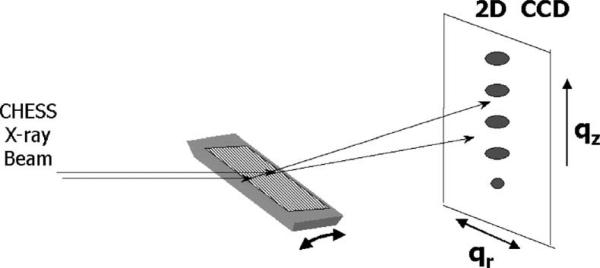
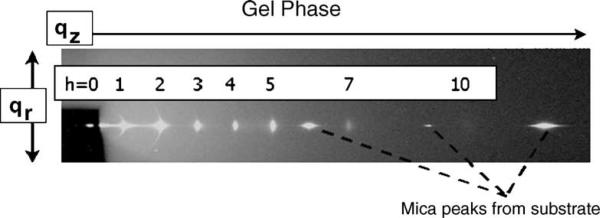
Fig. 9 shows the X-ray geometry using a flat silicon wafer as the sample substrate which is rotated during the data collection. The diffraction orders occur along the qz direction, but the data in the qr direction are equally significant. Fig. 10 shows the physical setup at the D1 station at CHESS. The X-rays enter through the flight path, and impinge upon our hydrated sample inside of the NIH chamber. The diffracted X-rays are collected on the CCD detector constructed by Sol Gruner's group (Tate et al., 1995). Before going to our main goal of fluid phase, Fig. 11 shows the typical kind of pattern one sees from a gel phase sample that does not fluctuate appreciably.
Fig. 9.
Experimental geometry at CHESS using a flat silicon substrate and rotation motor.
Fig. 10.
Physical setup at D1 station at CHESS.
Fig. 11.
X-ray scattering data from a gel phase sample prepared on a mica substrate (DMPC at 10 °C). The beam is seen through a semi-transparent beam stop at the left.
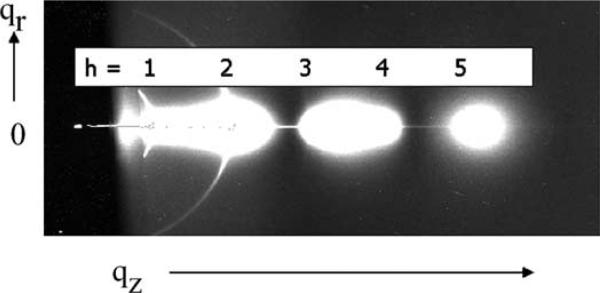
Fig. 12 shows fluid phase data that are much different. This grayscale image emphasizes three ‘blobs’ of diffuse scattering. The data are much stronger than the background which is shown in dark gray. Peaks develop as qr approaches 0 near the Bragg orders in qz. In addition to the observation that fluctuations cause diffuse scattering, the diffuse scattering actually contains more information than in the peaks!
Fig. 12.
Diffuse scattering from fully hydrated, oriented DOPC. Positions of Bragg peaks are indicated by orders h.
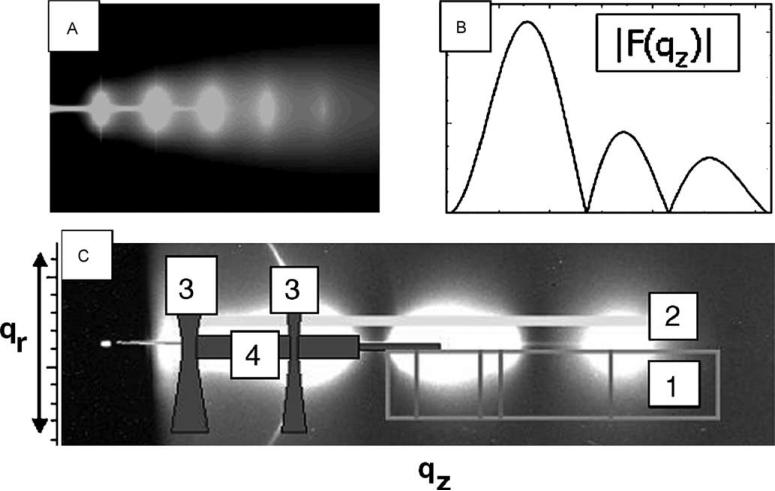
Fig. 13 shows how we are analyzing the data. The intensity in the fluid phase is the product of a structure factor S(q) that comes from the disorder of the second kind as shown in Fig. 13A, and of the form factor F(qz) shown in Fig. 13B which is just the Fourier transform of the electron density profile.
| (4) |
Fig. 13.
(A) The calculated structure factor S(q). (B) The form factor |F(qz)|. (C) The intensity data. See text for labeled regions 1−4.
Of course, our problem is to obtain these factors from their product, namely the measured intensity I(q). The key is the intensity in the qr direction (no. 1 in Fig. 13C). By fitting the data in the lower rectangle along qr, we obtain the parameters KC and B that determine S(q). The B parameter contains information about the interactions between bilayers (Petrache et al., 1998a,b). Notice that we do not use the data in the dark gray region (no. 3 in Fig. 13C), because that is corrupted by mosaic spread from the strong low-angle peaks on data on the meridian and by reflectivity from the substrate (no. 4). Once we have S(q), we then divide it into I(q) along the light gray band (no. 2 in Fig. 13C); this gives |F(qz)|2/qz, which then leads to electron density profiles. We would like to emphasize that this method uses the diffuse scattering that comes from fluctuations to our advantage rather than just trying to overcome the effects of fluctuations. It is quite different from traditional biophysical diffraction methods that focus on the integrated intensity in peaks.
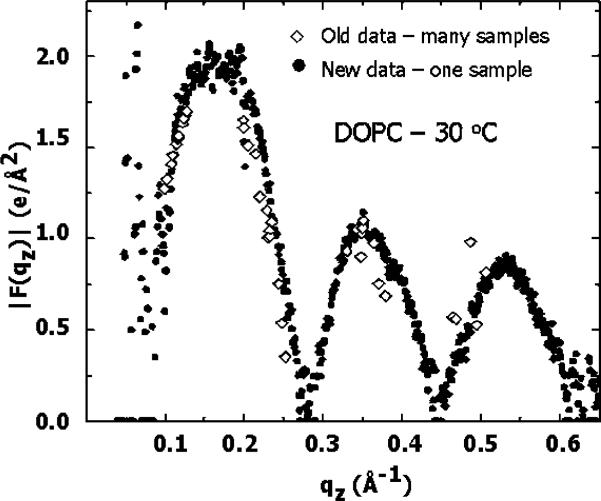
The diamonds in Fig. 14 show our old data for |F(qz)| that came from extrapolating peak intensities. The diamonds came from the intensities under the peaks of many different samples at various degrees of mild dehydration. In contrast, the solid circles show our new results which give many more data points, and they are all from just one sample. This is a major advantage of using the diffuse scattering that occurs at all qz values instead of the peaks that occur only at isolated qz values for each sample.
Fig. 14.
|F(qz)| of DOPC at 30 °C obtained from several samples at different hydration levels (diamonds) and from one fully hydrated sample (solid circles) (Lyatskaya et al., 2001).
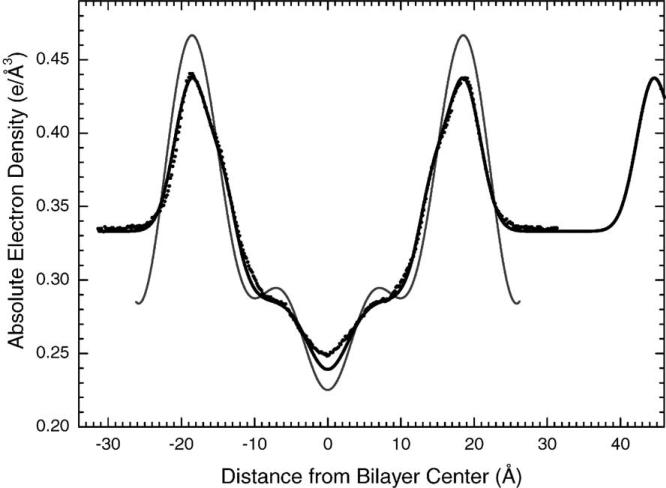
We are obtaining EDPs (Fig. 15) from the continuous transform data. The profiles obtained in this way are similar to those obtained from the older, partially dehydrated method, but more detail in the profile is seen because the data go to higher values of qz. There is some neat analysis, similar to what we recently published for the gel phase of DMPC (Tristram-Nagle et al., 2002) that globally encompasses other data such as our volumetric data. Fig. 15 shows a new EDP of DOPC (Liu, 2003) and the figure emphasizes the wide water spacing for this fully hydrated sample. It is also interesting to see that the new experimental electron density profile avoids the obvious effects of Fourier truncation errors. Nevertheless, the area A obtained from both experimental methods is very nearly the same (72 Å2). Therefore, the simulation, which was done at that area should also be compared to the new EDP; this comparison is very good indeed.
Fig. 15.
Electron density profile of DOPC at 30 °C constructed using the model fitting method and the X-ray intensity data from a fully hydrated, oriented sample (black line). For comparison is the DOPC profile constructed by Fourier construction using data from an unoriented sample (Tristram-Nagle et al., 1998) (gray). Also shown is the DOPC profile obtained by MD simulations by Scott Feller (black dots).
Let us return briefly to the last flavor of the title, namely, interactions between bilayers. The first breakthrough in this topic was the osmotic pressure technique reviewed by Rand and Parsegian (1989) that provides experimental force–distance data. Even with such data, however, it is not possible to evaluate the individual contributions from the many kinds of interactions (van der Waals, hydration, and fluctuation) that contribute to the total osmotic pressure. Our contribution has been to open a second experimental window by providing fluctuation data. From unoriented samples, we obtained the mean square fluctuations in the water spacing and that allowed us to obtain the fluctuation interaction (Petrache et al., 1998b), although we had to assume a value for KC. Fitting theory to the data is also a challenge because quantitative calculations require non-trivial statistical mechanics. We believe that the use of Monte Carlo simulations of the type shown in Fig. 6 is the best way to proceed. Such simulations are quite feasible and illuminating, and provide a way to test theoretical approximations (Gouliaev and Nagle, 1998). Future work will combine the Monte Carlo simulations with the new B and KC data from oriented samples to further elucidate interactions between bilayers.
Acknowledgements
We have been very fortunate to have had outstanding students. Several have been named in the text. In particular, we would like to acknowledge Yufeng Liu who is primarily responsible for our current work on oriented samples and who has developed marvelous software that reminds us of the development of Origin by our former student C.-P. Yang. We wish to thank the Cornell High Energy Synchrotron Source (CHESS, supported by NSF Grant DMR-9311772) for granting us a good deal of beam time so that we could run in an experimental mode, not just in data collection mode. We specifically acknowledge NIH (Grant GM44976) for sticking with us in this high risk, developmental project that involves innovative basic physics, and the American Chemical Society Petroleum Research Fund for responding during a funding hiatus. Lastly, we wish to thank Walt Shaw and Avanti Polar Lipids, not only for sponsoring this Award, but even more for providing lipids of consistently high quality.
References
- Als-Nielsen J, Litster JD, Birgeneau RJ, Kaplan M, Safinya CR, Lindegaad-Anderson A, Mathiesen S. Observation of algebraic decay of positional order in a smectic liquid crystal. Phys. Rev. B. 1980;22:312–320. [Google Scholar]
- Armen RS, Uitto OD, Feller SE. Phospholipid component volumes: determination and application to bilayer structure calculations. Biophys. J. 1998;75:734–744. doi: 10.1016/S0006-3495(98)77563-0. [DOI] [PMC free article] [PubMed] [Google Scholar]
- Blaurock AE, McIntosh TJ. Structure of the crystalline bilayer in the subgel phase of dipalmitoylphosphatidylglycerol. Biochemistry. 1986;25:299–305. doi: 10.1021/bi00350a003. [DOI] [PubMed] [Google Scholar]
- Caillé A. Crystalline physics. remarks on the X-ray scattering of smectic A phases. C.R. Acad. Sci. Paris Ser. B. 1972;274:891–893. [Google Scholar]
- Chen SC, Sturtevant JM, Gaffney BJ. Scanning calorimetric evidence for a third phase transition in phosphatidylcholine bilayers. Proc. Natl. Acad. Sci. U.S.A. 1980;77:5060–5063. doi: 10.1073/pnas.77.9.5060. [DOI] [PMC free article] [PubMed] [Google Scholar]
- Gouliaev N, Nagle JF. Simulations of interacting membranes in the soft confinement regime. Phys. Rev. Lett. 1998;81:2610–2614. doi: 10.1103/PhysRevLett.81.2610. [DOI] [PMC free article] [PubMed] [Google Scholar]
- Hristova K, White SH. Determination of the hydrocarbon core structure of fluid dioleoylphosphocholine (DOPC) bilayers by X-ray diffraciton using specific bromination of the double bonds: effect of hydration. Biophys. J. 1998;74:2419–2433. doi: 10.1016/S0006-3495(98)77950-0. [DOI] [PMC free article] [PubMed] [Google Scholar]
- Katsaras J. Adsorbed to a rigid substrate, dimyristoylphosphatidylcholine multibilayers attain full hydration in all mesophases. Biophys. J. 1998;75:2157–2162. doi: 10.1016/S0006-3495(98)77658-1. [DOI] [PMC free article] [PubMed] [Google Scholar]
- Katsaras J, Watson MJ. Sample cell capable of 100% relative humidity suitable for X-ray diffraction of aligned lipid multibilayers. Rev. Sci. Instrum. 2000;71:1737–1739. [Google Scholar]
- Kodama M, Hashigami H, Seki H. Static and dynamic calorimetric studies on the three kinds of phase transition in the systems of l-and dl-dipalmitoylphosphtidylcholine/water. Biochim. Biophys. Acta. 1985;814:300–306. [Google Scholar]
- Liu Y. Ph.D. dissertation. Carnegie Mellon University; 2003. New method to obtain structure of biomembranes using diffuse X-ray scattering: application to fluid phase DOPC lipid bilayers. Available: http://lipid.phys.cmu.edu. [Google Scholar]
- Lyatskaya Y, Tristram-Nagle S, Katsaras J, Nagle JF. Method for obtaining structure and interactions from oriented lipid bilayers. Phys. Rev. E. 2001;63 doi: 10.1103/PhysRevE.63.011907. [DOI] [PMC free article] [PubMed] [Google Scholar]
- Mashl RJ, Scott HL, Subramaniam S, Jakobsson E. Molecular simulation of dioleoylphosphatidylcholine lipid bilayers at differing levels of hydration. Biophys. J. 2001;81:3005–3015. doi: 10.1016/S0006-3495(01)75941-3. [DOI] [PMC free article] [PubMed] [Google Scholar]
- McIntosh TJ, Simon S. Area per molecule and distribution of water in fully hydrated dilauroylphosphatidylethanolamine bilayers. Biochem. 1986;25:4948–4952, 8474. doi: 10.1021/bi00365a034. [DOI] [PubMed] [Google Scholar]
- Nagle JF. Theory of biomembrane phase transitions. J. Chem. Phys. 1973a;58:252–264. [Google Scholar]
- Nagle JF. Lipid bilayer phase transition: dilatometry and theory. Proc. Natl. Acad. Sci. U.S.A. 1973b;70:3443–3444. doi: 10.1073/pnas.70.12.3443. [DOI] [PMC free article] [PubMed] [Google Scholar]
- Nagle JF. Theory of the main lipid bilayer phase transition. Ann. Rev. Phys. Chem. 1980;31:157–195. [Google Scholar]
- Nagle JF. Theory of lipid monolayer and bilayer chain melting phase transitions. Faraday Discuss. Chem. Soc. 1986;81:151–162. doi: 10.1039/dc9868100151. [DOI] [PubMed] [Google Scholar]
- Nagle JF, Tristram-Nagle S. Structure of lipid bilayers. Biochim. Biophys. Acta Rev. Biomembr. 2000;1469:159–195. doi: 10.1016/s0304-4157(00)00016-2. [DOI] [PMC free article] [PubMed] [Google Scholar]
- Nagle JF, Wilkinson DA. Lecithin bilayers: density measurements and molecular interactions. Biophys. J. 1978;23:159–175. doi: 10.1016/S0006-3495(78)85441-1. [DOI] [PMC free article] [PubMed] [Google Scholar]
- Nagle JF, Wilkinson DA. Dilatometric studies of the subtransition in DPPC. Biochemistry. 1982;21:3817–3821. doi: 10.1021/bi00259a015. [DOI] [PubMed] [Google Scholar]
- Nagle JF, Yokoi CSO, Bhattachrajee SM. Dimer models on anisotropic lattices. In: Domb C, Lebowitz JL, editors. Phase Transitions and Critical Phenomena. Vol. 13. Academic Press; London: 1989. pp. 235–304. [Google Scholar]
- Nagle JF, Zhang R, Tristram-Nagle S, Sun W, Petrache H, Suter RM. X-ray structure determination of Lα phase DPPC bilayers. Biophys. J. 1996;70:1419–1431. doi: 10.1016/S0006-3495(96)79701-1. [DOI] [PMC free article] [PubMed] [Google Scholar]
- Nagle JF, Tristram-Nagle S, Takahashi H, Hatta I. Comment on growth of molecular superlattice in fully hydrated DPPC during subgel phase formation. Eur. Phys. J. B. 1998;1:399–400. [Google Scholar]
- Perera L, Essman U, Berkowitz ML. Prog. Colloid Polym. Sci. 1997;103:107–113. [Google Scholar]
- Petrache HI, Tristram-Nagle S, Nagle JF. Fluid phase structure of EPC and DMPC bilayers. Chem. Phys. Lipids. 1998a;95:83–94. doi: 10.1016/s0009-3084(98)00068-1. [DOI] [PMC free article] [PubMed] [Google Scholar]
- Petrache HI, Gouliaev N, Tristram-Nagle S, Zhang R, Suter RM, Nagle JF. Interbilayer interactions from high-resolution X-ray scattering. Phys. Rev. E. 1998b;57:7014–7024. [Google Scholar]
- Rand RP, Parsegian VA. Hydration forces between phospholipid bilayers. Biochim. Biophys. Acta. 1989;988:351–376. [Google Scholar]
- Raghunathan VA, Katsaras J. LB′ → LC′ phase transition in phosphatidylcholine lipid bilayers: a disorder-order transition in two dimensions. Phys. Rev. E. 1996;54:4446–4449. doi: 10.1103/physreve.54.4446. [DOI] [PubMed] [Google Scholar]
- Ruocco MJ, Shipley GG. Characterization of the subtransition of hydrated dipalmitoylphosphatidylcholine bilayers. X-ray diffraction study. Biochim. Biophys. Acta. 1982;684:59–66. [Google Scholar]
- Sun W-J, Suter RM, Knewtson MA, Worthington CR, Tristram-Nagle S, Zhang R, Nagle JF. Order and disorder in fully hydrated unoriented bilayers of gel phase DPPC. Phys. Rev. E. 1994;49:4665–4676. doi: 10.1103/physreve.49.4665. [DOI] [PubMed] [Google Scholar]
- Sun W-J, Tristram-Nagle S, Suter RM, Nagle JF. Structure of the ripple phase in lecithin bilayers. Proc. Natl. Acad. Sci. U.S.A. 1996;93:7008–7012. doi: 10.1073/pnas.93.14.7008. [DOI] [PMC free article] [PubMed] [Google Scholar]
- Tate MW, Eikenberry EF, Barna SL, Wall ME, Lowrance JL, Gruner SM. A large-format high-resolution area X-ray detector based on a fiber-optically bonded charge-coupled device (CCD). J. Appl. Cryst. 1995;28:196–205. [Google Scholar]
- Tristram-Nagle S, Wiener MC, Yang C-P, Nagle JF. Kinetics of the subtransition in dipalmitoylphosphatidylcholine dispersions. Biochemistry. 1987;26:4288–4294. doi: 10.1021/bi00388a016. [DOI] [PubMed] [Google Scholar]
- Tristram-Nagle S, Zhang R, Suter RM, Worthington CR, Sun W-J, Nagle JF. Measurements of chain tilt angle in fully hydrated bilayers of gel phase lecithins. Biophys. J. 1993;64:1097–1109. doi: 10.1016/S0006-3495(93)81475-9. [DOI] [PMC free article] [PubMed] [Google Scholar]
- Tristram-Nagle S, Suter RM, Sun W-J, Nagle JF. Kinetics of subgel formation in DPPC: X-ray diffraction proves nucleation-growth hypothesis. Biochim. Biophys. Acta. 1994;1191:14–20. doi: 10.1016/0005-2736(94)90227-5. [DOI] [PubMed] [Google Scholar]
- Tristram-Nagle S, Petrache HI, Nagle JF. Structure and interactions of fully hydrated dioleoylphosphatidylcholine bilayers. Biophys. J. 1998;75:917–925. doi: 10.1016/S0006-3495(98)77580-0. [DOI] [PMC free article] [PubMed] [Google Scholar]
- Tristram-Nagle S, Liu Y, Legleiter J, Nagle JF. Structure of gel phase DMPC determined by X-ray diffraction. Biophys. J. 2002;83:3324–3335. doi: 10.1016/S0006-3495(02)75333-2. [DOI] [PMC free article] [PubMed] [Google Scholar]
- Wiener MC, Suter RM, Nagle JF. Structure of the fully hydrated gel phase of dipalmitoylphosphatidylcholine. Biophys. J. 1989;53:315–325. doi: 10.1016/S0006-3495(89)82807-3. [DOI] [PMC free article] [PubMed] [Google Scholar]
- Wilkinson DA, Nagle JF. A differential dilatometer. Anal. Biochem. 1978;84:263–271. doi: 10.1016/0003-2697(78)90509-2. [DOI] [PubMed] [Google Scholar]
- Yang C-P, Nagle JF. Phase transformation in lipids follow classical kinetics with small fractional dimensionalities. Phys. Rev. A. 1988;37:3993–4000. doi: 10.1103/physreva.37.3993. [DOI] [PubMed] [Google Scholar]
- Zhang R, Suter RM, Nagle JF. Theory of the structure factor of lipid bilayers. Phys. Rev. E. 1994;50:5047–5060. doi: 10.1103/physreve.50.5047. [DOI] [PubMed] [Google Scholar]
- Zhang R, Tristram-Nagle S, Sun W, Headrick RL, Irving TC, Suter RM, agle JF. Small angle X-ray scattering from lipid bilayers is well described by modified Caillé theory, but not by paracrystalline theory. Biophys. J. 1996;70:349–357. doi: 10.1016/S0006-3495(96)79576-0. [DOI] [PMC free article] [PubMed] [Google Scholar]


