

Abstract
A mutated form of truncated proplasmepsin 1 (proPfPM1) from the human malaria parasite Plasmodium falciparum, proPfPM1 K110pN, was generated and overexpressed in E. coli. The auto-maturation process was carried out at pH 4.0 and 4.5, and the optimal catalytic pH of the resulting mature PfPM1 was determined to be pH 5.5. This mature PfPM1 showed comparable binding affinity to peptide substrates and inhibitors with the naturally-occurring form isolated from parasites. The S3-S3’ subsite preferences of the recombinant mature PfPM1 were explored using combinatorial chemistry based peptide libraries. Based on the results, a peptidomimetic inhibitor (compound 1) was designed and yielded 5-fold selectivity for binding to PfPM1 versus the homologous human cathepsin D (hcatD). The 2.8 Å structure of the PfPMP2-compound 1 complex is reported. Modeling studies were conducted using a series of peptidomimetic inhibitors (compounds 1–6, Table 3) and three plasmepsins: the crystal structure of PfPM2, and homology derived models of PfPM1 and PfPM4.
Introduction
In the digestive vacuole (DV) of the human malaria parasite Plasmodium falciparum, four plasmepsins have been identified, known as plasmepsin 1, 2, 4 (PfPM1, PfPM2, PfPM4) and Histo-Aspartic Proteinase (PfHAP) (2). The functions of these DV plasmepsins are mainly involved in hemoglobin degradation, which was originally detected from the initiation of hydrolysis of hemoglobin by a purified naturally-occurring enzyme (3). This enzyme is plasmepsin 1, previously designated as aspartic hemoglobinase I (4) or PFAPG (5).
PfPM1 shares a 53–70% amino acid sequence identity and a similar expression pattern with its DV plasmepsin paralogs (6, 7). The PfPM1 gene encodes a polypeptide composed of a 123 amino acid long prosegment plus a mature portion of 329 amino acids with a potential transmembrane motif residing in the N-terminus of the prosegment (Figure 1). The mature portion of the PfPM1 polypeptide is expected to fold to a pepsin-like bilobal tertiary structure similar to those of PfPM2 and PfPM4 (8–11) based on their sequence similarity.
Figure 1.

Amino acid sequence of the full length proPfPM1 (GenBank Accession No. NC_004317). The full length plasmepsin 1 gene encodes a single polypeptide. The potential transmembrane motif in the N-terminal prosegment is highlighted with a striate box. The expression construct comprises the truncated prosegment (highlighted with a cross box) plus the mature enzyme (bold sequence). The pair of active site motifs is underlined.
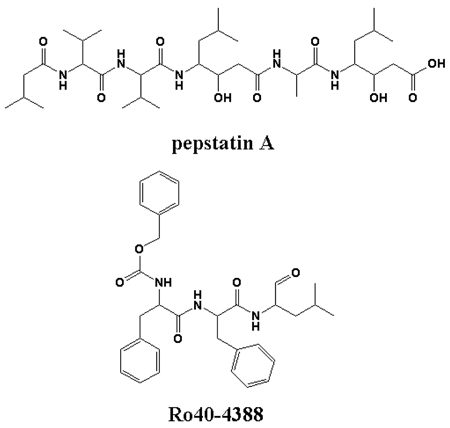
Immunolocalization studies of intraerythrocytic trophozoites suggest that PfPM1, once expressed, is delivered to the parasite surface double membrane, where it is transported, along with ingested hemoglobin, to the digestive vacuole with the conversion of zymogen to mature enzyme enroute (12). Pepstatin A, a general tight binding inhibitor of the aspartic proteinase superfamily, and SC-50083, a strong inhibitor of PfPM1, kill cultured P. falciparum parasites by presumably blocking hemoglobin degradation(4, 13). Other inhibitors highly selective for PfPM1, such as Ro40–4388 and Ro40–5576, bear a similar anti-parasitic activity (14). These pieces of evidence indicate that PfPM1 may serve as one of the key targets for novel antimalarial drug design.
In the first part of this study, we describe expression, in vitro refolding, purification, conversion to the mature form, and enzymatic characterization of a recombinant proPfPM1 K110pN mutant, from which mature PfPM1 was isolated and characterized.
Secondly, we investigated the S3–S3’ subsite preferences of PfPM1, using two sets of combinatorial chemistry based peptide libraries (15). The primary substrate specificities of PfPM1 at P1 and P1’ were determined from initial hydrolysis rates on these peptide library pools by spectroscopic assays; in what followed, the secondary substrate specificities at P3, P2, P2’ and P3’ were analyzed by measuring the relative abundances of cleavage products using in-line liquid chromatography—mass spectrometry (LC-MS) techniques. From the resulting data, a selective peptidomimetic inhibitor of PfPM1 (compound 1) was designed. Compound 1, binding PfPM1 with high affinity, revealed a 5-fold selectivity to PfPM1 versus human cathepsin D (hcatD). Cathepsin D is widely distributed in the human body and shares a ~35% sequence identity with the plasmepsins of the malaria parasite. Thus, antimalarial drugs targeting the plasmepsins should have reduced binding to hcatD.
In the third part of this study we crystallized the complex between compound 1 and the closely related enzyme PfPM2, and determined the three dimensional structure by X-ray diffraction. In the final part of this investigation we utilized the resulting structure to model interactions in the active sites of three plasmepsins with the set of peptidomimetic inhibitors (Table 3) we have prepared.
Table 3.
Inhibition analysis of combinatorial chemistry derived inhibitors against DV plasmepsins and human cathepsin D
| Compound | Sequencea | Dissociation Constant (Ki) (nM) | ||||||
|---|---|---|---|---|---|---|---|---|
| PfPM1 | PfPM2 | PfPM4 | PvPM4b | PoPM4b | PmPM4b | hcatD | ||
| 1 | KPFSLΨLQF | 43 ± 5 | 271 ± 26 | 209 ± 18 | 101 ± 11 | 767 ± 81 | 272 ± 20 | 232 ± 14 |
| 2 | KPnLSnLΨLQI | 73 ± 9 | 14 ± 2c | 22 ± 3c | 97 ± 14c | 187 ± 29c | 160 ± 26c | 219 ± 21c |
| 3 | KPVEFΨRQT | 31,000 ± 5,000 |
> 20,000c | 2.4 ± 0.3c | 14 ± 2c | 39 ± 5c | 10 ± 1c | 30 ± 2c |
| 4 | KPLEFΨFRV | 5,500 ± 700 | 4,300 ± 800c | 0.09 ± 0.01c | 0.6 ± 0.08c | 3.2 ± 0.5c | 3.7 ± 0.6c | 4.7 ± 0.4c |
| 5 | KPLEFΨYRV | 38,000 ± 6,000 |
19,500 ± 4,000c |
0.5 ± 0.09c | 0.7 ± 0.09c | 3.2 ± 0.5c | 0.3 ± 0.05c | 8.5 ± 0.6c |
| 6 | KPFELΨAWT | 42,000 ± 7,000 |
16,600 ± 3,100c |
12,700 ± 1,600c |
9,800 ± 1,800c |
> 20,000c |
9,000 ± 200c |
12,700 ± 1,200c |
Ψ = -CH2-NH-, nL = norleucine
PvPM4 represents plasmepsin 4 from Plasmodium vivax, PoPM4 represents plasmepsin 4 from Plasmodium ovalae, and PmPM4 represents plasmepsin 4 from Plasmodium malariae
These dissociation constants were reported in (15).
The dissociation constants of these compounds on the respective enzymes that they were designed against are given in bold font.
Materials and methods
1. Cloning of the ProPfPM1 Gene and Construction of the K110pN Mutation
In order to provide a truncated version of the proenzyme as has been done for PfPM2 and PfPM4 (16, 17), the gene encoding the C-terminal 48 residues of the prosegment and the mature PfPM1 was amplified from the Plasmodium falciparum (Dd2) intraerythrocytic stage cDNA library. The prosegment portion was amplified using the polymerase chain reaction with the primers, 5’– CCGGAATTCCGAGGATCCTCAAAACATGTAATAA TTGGA-3’ (#1), and 5’-TGTAAGTCCTGTTTTGAAAAAgTTCAAGGATTC-3’ (#2). The mature enzyme portion was amplified with the primers, 5’-GAATCCTTGAAcTTT TTCAAAACAGGACTTACA-3’ (#3), and 5’-CCGGAATTCGGATCCCGTGATTTAC AATTTTTTTTTGGC -3’ (#4). The mutagenic substitutions are presented in lower case. The two amplified sub-fragments were denatured, annealed and further amplified using primers #1 and #4. The product was digested and ligated into the BamH I site of pET-3a (Novagen) using T4 DNA ligase (New England Biolabs). The K110pN mutation was verified by DNA sequencing analysis and the mutated proPfPM1-pET 3a construct was transformed into BL21 Star™(DE3)pLysS E. coli cells (Invitrogen).
2. Expression, in vitro refolding and Purification
One liter of Luria Broth media containing 50 µg/mL ampicillin and 34 µg/mL chloramphenicol was inoculated with 20 mL of overnight culture of BL21 Star™(DE3)pLysS E. coli cells harboring the proPfPM1-pET-3a K110pN construct. Cells were grown at 37 °C with shaking speed of 250 rpm until A600 reached 0.6. A final concentration of 1 mM IPTG was subsequently utilized to induce gene expression and protein production.
After 3 h induction, the cell culture was harvested by centrifugation at 13,000 × g, 4 °C, for 15 min. The cell pellet was resuspended in ice cold buffer A (0.01 M Tris-HCl, pH 8.0, 0.02 M MgCl2, 0.005 M CaCl2, 4.2 mL/g) and lysed via a French Pressure cell under 1000 psi. Inclusion bodies were purified from the lysed suspension with the methods previously described (18). The purified inclusion body fraction was resuspended in 10 mM Tris-HCl, pH 8.0, 1 mM EDTA to the final concentration 100 mg/mL and stored at −80 °C until ready for in vitro refolding.
The inclusion body material was thawed on ice and resuspended in 10 mM Tris-HCl, pH 8.0, 1 mM EDTA to the final concentration 40 mg/mL. An equal volume of glacial acetic acid (Fisher Scientific) was added to the resuspension. The acetic acid treatment was essential to dissolve the inclusion bodies. The inclusion body was dissolved by gently mixing and incubating at room temperature for 10 min. The resulting material was centrifuged at 3,000 g at room temperature for 10 min. The supernatant was added drop by drop to the freshly prepared denaturation buffer (6 M urea, 50 mM sodium phosphate, pH 8.5, 500 mM sodium chloride). The pH value of the solution was adjusted immediately back to pH 8.5 by slowly adding of 10 M sodium hydroxide to the protein solution while stirring. The protein samples were allowed to denature while stirring slowly at room temperature for 2 h. Any undissolved material was removed by centrifugation at 13,000 × g, 4 °C for 30 min. The supernatant was dialyzed against 20 mM Tris-HCl, pH 8.0 at 4 °C. The dialysis buffer was changed every 6 h three more times. The resulting dialysate was centrifuged at 13,000 × g, 4 °C for 30 min and filtered through a 0.22 µm membrane to remove any precipitate.
The soluble dialysate was purified using a FPLC LCC 500 system (Amersham). At each purification step, the concentration (A280) and catalytic activity of every fraction on a chromogenic substrate A: Lys-Pro-Ile-Leu-Phe*Nph-Arg-Leu (where * represents the cleavage site, Nph = para-nitrophenylalanine) were tested by monitoring the decrease of the average absorbance from 284 to 324 nm (16, 19) using a Cary 50 Bio UV-Visible spectrophotometer (Varian).
The soluble dialysate was primarily purified using a HiTrap HP 5 mL anion exchange column (Amersham). A gradient of 0–0.5 M NaCl in 20 mM Tris-HCl, pH 8.0 was used for protein elution. The peak fractions were pooled and concentrated with a Vivaspin 15R concentrator (MWCO = 5 kDa, VIVASCIENCE) until A280 reached 2.5. The concentrated sample was centrifuged at 24,000 × g, 4 °C for 10 min to remove any precipitates. The supernatant was further purified by gel filtration chromatography using a Superdex 75 HR10/30 column (Amersham). A single peak was detected corresponding to the eluted position of the monomeric molecule.
3. Auto-maturation and optimization of the catalytic properties of ProPfPM1
Aliquots of the purified zymogen were incubated at 37 °C with one fifth volume of a series of 0.5 M acidic buffers: sodium formate, pH 3.5, sodium formate, pH 4.0, sodium acetate, pH 4.5, sodium citrate, pH 5.0, M sodium citrate, pH 5.5, and sodium phosphate, pH 6.0. An equal amount (3 µg) of enzyme was withdrawn after 0, 5, 10, 15, 20, 25, 30, 60, and 120 min incubation. The reactions were stopped by addition of 5 × Laemmli sample buffer and boiling for 10 min. The conversion from proPfPM1 to the mature enzyme was detected by SDS-PAGE based upon a time-dependent 5 kDa molecular weight reduction under acidic conditions.
In addition, the optimal conditions for the catalysis of proPfPM1 were determined. As zymogen required conversion to the mature form to show catalytic activity, the best conditions for the combined events of self-processing and mature enzyme catalysis were screened. The purified proPfPM1 was treated in similar conditions aforementioned. At each pre-incubation time point, samples were withdrawn and mixed with 100 µM of peptide substrate A. The initial cleavage velocities were measured on a Cary 50 Bio UV-Visible spectrophotometer. The resulting initial rates were normalized with overall the highest velocity set to 100 percent. For each specific condition, three individual assays were performed, from which the average normalized velocities and standard errors were calculated. The condition allowing proPfPM1 to show the highest catalytic activity was defined as its optimal catalysis condition.
4. Mature PfPM1 preparation and optimization of the catalytic properties
The proPfPM1 zymogen was incubated at 37 °C, in 0.1 M sodium formate, pH 4.0 for 1 h. The conversion was quenched by diluting the resulting material into 20 mM Tris-HCl, pH 8.0, 8-fold volume in excess. The active mature enzyme was further purified using a HiTrap HP 5 mL anion exchange column. The enzyme was eluted with a gradient of 0–0.5 M NaCl in 20 mM Tris-HCl, pH 8.0.
The optimal pH for the catalysis of mature PfPM1 was subsequently determined. The purified mature enzyme was pre-incubated at 37 °C, for 3 min with the acidic buffer series mentioned above. The initial cleavage velocities on the chromogenic peptide substrate A were measured and the optimal catalytic pH was defined as the one rendering the highest initial velocity.
5. N-terminal protein sequencing analysis
The proPfPM1 zymogen was converted to the mature enzyme by incubating in 0.1 M sodium formate, pH 4.0, at 37 °C for 1 h. The activated enzyme was purified, run on SDS-PAGE and blotted onto a polyvinylidene difluoride (PVDF) membrane. The N-terminal residue sequence of the activated PfPM1 was determined using an Applied Biosystems 470A protein sequencer at Protein Chemistry Core Facility, University of Florida.
Kinetic parameter determination
6a. Active site titration, kcat and Km
Chromogenic peptide substrates were dissolved in 20 % DMSO, 10 % formic acid, 70 % distilled deionized water. Inhibitor stock solutions were prepared in 100 % DMSO. The concentrations of the stock solutions were determined by amino acid analysis at the Protein Chemistry Core Facility, University of Florida. Assays were set up in the optimal catalysis conditions of purified mature PfPM1. The total active enzyme concentration ([E]tot), Vm, kcat, Km, and kcat/Km were determined as previously described (18), except that the initial cleavage velocity values were measured using a Cary 50 Bio UV-Visible spectrophotometer.
6b. Dissociation constant (Ki) measurement
Preparation of enzymes (DV plasmepsins and hcatD) and assay conditions were described previously (15, 16, 18, 20–24) and in this report.
For a tight binding (Ki = 50 pM–10 nM) competitive inhibitor, the initial rates (AU/sec) of enzymatic cleavage of a chromogenic peptide substrate of known concentration (µM) in the presence of different concentrations (nM) of inhibitors were measured as described above. The Ki value was determined by fitting the initial cleavage velocities and related inhibitor concentrations into the competitive tight binding inhibitor equation (25): v = [(0.5 Vmax /[E])/(Km/[S] + 1)}*{([E]-[I]-Kiap) + sqrt(([E]-[I]-Kiap)2 + (4[E]Kiap))], where Kiap = (Ki*([S]/Km + 1)), of the Enzfitter1.05 program (BioSoft, Cambridge, UK).
For a non-tight binding (Ki = 50 nM–10 µM) competitive inhibitor, the initial rates (AU/sec) of enzymatic cleavage of at least six different concentrations of a chromogenic peptide substrate in the presence of at least two different concentrations of inhibitors were measured and the Ki value was determined by fitting the initial hydrolysis rates and related substrate and inhibitor concentrations into the equation: v = ([S]*Vmax)/([S] + (Km * (1+ [I]/Ki)) of the single substrate – single inhibitor (competitive) program in the Enzyme Kinetic Module 1.0 of SigmaPlot 2000 (Version 6.10) (Systat Software Inc.).
7. Subsite Preference Exploration
The synthesis of the P1 and P1’ combinatorial libraries were described previously {Beyer, 2005 #415}. Synthesized single penta- and tripeptides were used to determine the retention time of isomeric peptides (Xaa = Ile, Leu or norLeu) or peptides of similar masses (Xaa = Gln or Lys).
7a. Primary Subsite Preferences – Spectroscopic Assays
The primary substrate specificities of PfPM1 at the P1 and P1’ positions were determined from the initial hydrolysis rate of an aliquot of each peptide pool.
For the assays, 800 nM of the mature PfPM1 was pre-incubated in 0.1 M sodium citrate, pH 5.5, at 37 °C for 3 min before hydrolysis reactions. For the peptide library preparation, each lyophilized substrate pool was dissolved in filtered distilled deionized water making the stock concentration approximately 1.25 mM. The solutions were filtered through a 0.45 µm Costar cellulose acetate tube filter by centrifugation at 20,000 × g for 5 min to remove any undissolved material.
The initial rates of cleavage on 100 µM peptide pools were measured at 37 °C using a Cary 50 Bio UV-Visible spectrophotometer. Due to the different locations of the chromophore (Nph), a decrease or an increase of the average absorbance from 284–324 nm was observed during enzymatic digestion of the P1 or P1’ library pools, respectively (21). An average of three independent measurements of the initial cleavage velocities were then normalized with the maximal rate set to 100 percent and the normalized rates were plotted against P1 or P1’ amino acid substitutions.
7b. Secondary subsite preferences – LC-MS
The best peptide pool of each library set were subjected to secondary substrate specificity studies on the P3, P2, P2’ and P3’ position.
The enzyme and peptide pool preparation was described above. The complete process of enzyme-catalyzed hydrolysis was monitored on the Cary 50 Bio UV-Visible spectrophotometer. Complete digestion of P1 library pools required approximately 2 h; while hydrolysis of the P1’ library pools finished in about 1 h. The total change of the average absorbance from 284–324 nm was calculated from these observations. The enzymatic digestion time allowing only a 5–10% of substrate hydrolysis, i.e., the linear phase of the kinetic reaction, was determined. Such time periods were allowed for enzymatic digestions on 100 µM peptide pools. The reactions were stopped by addition of 1% (v/v) of 14 M ammonium hydroxide to raise the pH above 8.0. The resulting materials were frozen in −80 °C until LC-MS analyses were performed.
The cleaved peptide products were subjected to separation via capillary reverse phase high performance liquid chromatography (rpHPLC). Digested peptide pools were thawed on ice and diluted 20-fold with solvent A (5% acetonitrile, 94.9% distilled deionized water and 0.1% glacial acetic acid), and 10 µL of the diluted sample was subsequently loaded onto a C18 capillary trap (5 mm × 300 µm i.d., packed with C18 PepMap 100, 5 µm particle size, LC packings, San Francisco, CA). The sample was desalted with the loading buffer (3% acetonitrile, 96.9% distilled deinoized water, 0.1% glacial acetic acid and 0.01% TFA) for 5 min and backflushed onto the analytical column. Capillary rpHPLC separation of cleavage products was performed on a self-packed 20 cm × 75 µm i.d. Alltima C18 reverse phase column (particle size: 5 µm) (Alltech Associates, Deerfield, IL) in combination with an Ultimate Capillary HPLC system (LC Packings, San Diego). The peptide isolation procedure was as follows:
| Elution Time (min) |
0 | 5 | 40 | 41 | 51 | 52 | 72 |
| Solvent A/B (%/%) |
95/5 | 95/5 | 40/60 | 10/90 | 10/90 | 95/5 | 95/5 |
In-line mass spectrometry analyses of the column eluate were accomplished using a Thermo-Finnigan LCQ Deca quadrupole ion trap mass spectrometer (Thermo Electron Corp, San Jose, CA). The analyses were implemented in the electrospray ionization mode (ESI) with the following technical parameters: sheath gas (N2) = 0; aux gas (N2) = 0; spray voltage = 2 kV, capillary temperature = 175 °C, capillary voltage = 33 V and tube lens offset = 20 V.
Peptide products were identified by their masses and retention time. Peptide quantities were determined by integrating the area under the curve (AUC) for [M+H]+ and [M+2H]2+ ions of the pentapeptides and [M+H]+ ions of the tripeptides via the Qual Browser program of the X-Calibur 1.3 software package (Applied Biosystems, Foster City, CA).
During the synthesis of peptide library pools, the abilities of amino acids to be incorporated in the studied P3, P2, P2’ and P3’ position were varied. For this reason, combinatorial octapeptides with mixtures at each position were synthesized and subjected to LC-MS analyses. A semi-quantitated profile for the relative abundances of these octapeptides was obtained, from which the normalization factors for the pentapeptide and tripeptide products were determined.
The original relative abundances of peptide products were subsequently calibrated by the normalization factors and further normalized with the greatest quantities set to 100 percent. For each pool, the LC-MS analysis was repeated 3–4 times, from which the mean and standard deviation were calculated. The optimal residues preferred by each subsite were subsequently determined.
8. Design of Peptidomimetic Inhibitors
The results from substrate specificity studies of PfPM1 were compared with those obtained for human cathepsin D (data not shown). The most selective amino acid substitutions of PfPM1 against human cathepsin D at each position were incorporated. Specific peptidomimetic inhibitors of PfPM1 were developed by modifying the cleavage peptide bonds between P1 and P1’ as the reduced methyleneamino [-CH2-NH-].
9. Crystallization of the PfPM2-Compound 1 complex and structure solution
9a. Purification and Crystallization of PfPM2 with Compound 1
Wild-type proPfPM2 was expressed in E. coli BL21pLysS cells, purified and converted to the mature enzyme as described previously (18, 24). The purified protein was concentrated to ~ 7.2 mg/mL using Vivaspin 15R concentrators with a molecular weight cutoff of 10,000 Daltons. Compound 1 was then added to the protein solution to give a final molar ratio of inhibitor to protein of 5:1. The sample was then filtered using 0.20 µm PES syringe filter (Corning) to remove precipitate. This purified sample was used to set up crystallization trials.
Crystals were grown at room temperature with the hanging drop vapor diffusion method using 2 µL of protein sample and 2 µL of precipitant with a reservoir volume of 500 µL. Two precipitants (0.1 M sodium acetate trihydrate pH 4.6 with 8% (w/v) PEG 4000 and 0.1 M sodium acetate trihydrate pH 4.6 with 0.2 M ammonium sulfate and 12.5% (w/v) PEG 4000) produced diffraction quality crystals within 2 days. The crystals were allowed to grow for ~ 2 weeks prior to data collection.
9b. X-ray Data Collection and Processing
Crystals were cryoprotected prior to data collection by quick-dipping them into a 30% glycerol solution for one second. In house X-ray data was collected at 100 K with a Rigaku RU-H3R Cu rotating-anode generator and an R-AXIS IV++ image-plate system. Three different crystals were used for data collection with a 1.0° oscillation angle and an exposure time of 12 min at 150 mm crystal to detector distance. Data processing was performed using DENZO and data were scaled using SCALEPACK (26). The crystals belong to the monoclinic space group C2, with unit cell parameters a=219.5, b=69.03, c=53.58 Å, and β = 102.9°, with two molecules in the asymmetric unit. No other instance of this unit cell has been reported in the literature for PfPM2.
The structure was solved by molecular replacement using the plasmepsin 2 coordinates from the Protein Data Bank 1XDH (DOI 10.2210/pdb1xdl/pdb), with inhibitor and waters removed, as the molecular probe. The CNS package was used at a resolution of 4.0 Å to locate the two molecules (27). They were refined in CNS as independent rigid bodies at 3.5 Å resolution, and a |Fo|-|Fc| difference electron density map showed positive density at 3.0 σ in the active sites. Using program O (28), models of the two inhibitors were fit into this electron density. The complete model was iteratively improved by cycles of refinement, including non-crystallographic restraints, followed by manual adjustment in program O. The final model, refined at 2.8 Å resolution, contains two complete PfPM2 chains, two inhibitor 1 molecules, and 47 water molecules. Four isotropic temperature factors, one for each of the two domains of the two molecules, had values of 23.8, 30.3 Å2, (molecule A), and 23.4, 31.4 Å2 (molecule B). The final Rcryst value was 0.238 and the Rfree was 0.286. Coordinates and structure factors have been deposited in the Protein Data Bank with accession code 2R9B.
10. Molecular Modeling
We have used the structure of PfPM2 reported herein as the basis for molecular modeling of the interactions between the peptidic inhibitors in Table 3 to two additional plasmepsins. Homology models for PfPMI and PfPM4 were generated with the automated server SWISS-MODEL (29) with the aid of the associated front-end tool DeepView. Protons were added with the software Reduce (30), and the correct orientation for Asn/Gln sidechains was assessed with the NQ-Flipper web server (31). The initial structures of inhibitors 2–6 (Table 3) were obtained starting from the crystallographic structure of compound 1 by mutation of the corresponding sidechains in Maestro (Schrödinger, Inc).
Automated docking exploration was performed with GOLD version 3.2. (32). Each ligand was docked 20 times with default GA search parameters, using the scoring function Chemscore as implemented in GOLD (33) and allowing full flexibility for the ligand, including flipping of planar and pyramidal nitrogens. The crystallographic water molecule, located between the methyleneamino transition state mimic and the catalytic aspartates, was considered for the docking (water “on” flag) and a hydrogen bond constraint to this waster was imposed in GOLD. On the basis of preliminary re-docking calculations (compound 1 into PfPM2), the docking setup was completed by modeling aspartate 214 as protonated in its most buried oxygen, aspartate 34 negatively charged and the methylenamino group of the inhibitor was modeled in its neutral form (only for automated docking purposes, see below). Selection of reliable docking poses was based upon a combination of three main criteria: i) only solutions within the first quartile were taken into account, ii) degree of conservation for the interactions concerning the backbone of the peptides (taking into account other crystal structures of plasmepsins) and iii) a proper protein sidechain accomodation in the different protein subsites.
Manual docking procedure started from the crystallographic complex of inhibitor 1-PfPM2 herein reported. Initial structures of each ligand within the binding site of PfPM2 were generated as indicated above. Structural alignment of the resulting 6 complexes onto PfPM1 and PfPM4 models followed using Pymol (http://www.pymol.org), to account for the 18 initial complexes. Finally, each complex was then refined by energy minimizations in NAMD (34) using the OPLS force field (35) with manual assignment for the missing parameters. In particular, the methyleneamino group of the ligand and all the titrable residues of the peptides, including the amino and carboxy terminal ends, were modeled in their charged form. Explicit solvent was considered with a sphere of TIP3 water molecules that ensured enough solvation for the protein.
Results
Expression, in vitro refolding and purification of the recombinant proPfPM1 K110pN
A recombinant semi-proPfPM1 K110pN containing the last 48 residues of the prosegment and the mature enzyme was expressed in E. coli. A total of 350 mg of purified inclusion body material was obtained from 1 liter of cell culture, accounting for approximately 14% of the total cell mass (Table 1).
Table 1.
Average yields during the recombinant production and purification of the recombinant proPfPM1 from one liter expression
| Production and purification steps | Average yields (mg)a |
|---|---|
| Cell pellet (collection) | 2520b |
| Inclusion body extraction | 350b |
| Denaturation | 45c |
| Refolded | 3.2c |
| Anion exchange chromatography | 2.1c |
| Gel filtration chromatography | 1.2c |
The product yield of each step was the average result from three independent recombinant production and purification experiments.
Weights of products were directly measured after centrifugation.
The concentration of soluble protein was determined using A280, with the Extinction Coefficient ɛ280 = 41,510 M−1 cm−1 (a theoretical value calculated from the sequence of semi-proPfPM1 using ProtParam (49)).
Following refolding procedures described in Methods, the soluble materials were subjected to gel filtration chromatography to isolate the folded proenzyme from the misfolded material. Results from the purification revealed that the activatable proPfPM1 was exclusively eluted as a monomeric globular protein of 43 kDa (Supplement Figure 1). Products from each preparation step were analyzed by SDS-PAGE (Supplement Figure 2).
Optimal Conditions for the Catalysis by the proPfPM1 K110pN Mutant
The catalytic activity profiles of the proPfPM1 K110pN mutant at different pH conditions were depicted from the initial cleavage velocities on the chromogenic peptide substrate A following a variety of pre-incubation times (Figure 2a). PfPM1 showed observable catalytic activity within a narrow pH range of 4.0–4.5. Catalytic activities of this converted enzyme at other acidic conditions, such as pH 3.5 (Figure 2a) and pH 5.0– 6.0 (not shown) were also tested but catalytic activity was very low. At pH 4.0–4.5, the enzyme required 20 min to maximize its initial cleavage velocity. Longer pre-incubation time attenuated substrate hydrolysis rate. Overall, the optimal condition for this enzyme variant to perform catalysis is at pH 4.5 with 20 min pre-incubation. Such hydrolysis assays reflect the combined effects of zymogen maturation and active enzyme catalysis. These two events can be separately investigated by SDS-PAGE analysis of self-maturation of the proPfPM1 K110pN mutant and by studying the optimal condition of mature PfPM1 catalysis.
Figure 2.

Spectroscopic assay on determination of the optimal conditions for the PfPM1 catalysis. (a) The proPfPM1 K110pN mutant was incubated at 37 °C in 0.1 M sodium formate pH 3.5, 0.1 M sodium formate pH 4.0 and 0.1 M sodium acetate pH 4.5. The hydrolyses of the activated PfPM1 on 100 µM of chromogenic peptide substrate A were monitored at a variety of time points from 0 to 4 h, and the corresponding initial cleavage velocities were measured and normalized. The zymogen can be efficiently activated and performs catalysis at pH 4.0 and 4.5. The optimal condition for the catalysis of PfPM1 is at pH 4.5 with 20 min preincubation. (b) The mature PfPM1 was incubated at 37 °C for 3 min in a series of acidic buffers from pH 3.5–6.0. The initial cleavage velocities of mature PfPM1 on 100 µM of chromogenic peptide substrate A were measured and normalized. The optimal pH for mature PfPM1 to perform catalysis was pH 5.5. All the assays were repeated three times, from which the average and standard errors were calculated.
Self-maturation of the Recombinant ProPfPM1 K110pN Mutant
The molecular conversion from proPfPM1 to mature PfPM1 was detected using SDS-PAGE based upon a time-dependent 5 kDa molecular weight reduction under acidic conditions (Supplement Figure 3).
The self-maturation of the proPfPM1 K110pN mutant was conducted at pH 4.0 and 4.5. The conversion at pH 4.0 revealed a rapid cleavage process, where the majority of proenzyme was converted within 20 min and the processing was complete after 1 h incubation. At pH 4.5, less than half of the proenzyme was activated after 20 min incubation and complete conversion required more than 2 h to complete. In addition, at both pH conditions, the total amount of mature PfPM1 obtained was less than that of the zymogen, indicating that the enzyme exhibited self-degradation along with specific conversion. Also notably intermediate species of sizes between the proenzyme form and the mature form during self-maturation at pHs between 3.5 and 4.5 were observed. The optimal pH condition for proPfPM1 to conduct auto-maturation was pH 4.0–4.5. At such pH milieus, the converted enzyme was stable for at least 2 h to allow isolation of the mature PfPM1.
Determination of Conditions for Optimal Catalytic Activity by the Mature PfPM1
The mature PfPM1 was prepared by converting the proPfPM1 K110pN mutant at pH 4.0, 37 °C for 1 h and further purified via anion exchange chromatography. The initial hydrolysis rates of the resulting enzyme at varied acidic pH conditions on the chromogenic peptide substrate A were measured (Figure 2b). The mature PfPM1 cleaved the substrate most efficiently at pH 5.5. Although at pH 5.0, 80% of the full catalytic activity was shown, only approximately 30% of the catalytic activity was obtained from the mature PfPM1 at pH 4.0 or pH 4.5, the optimal condition for zymogen auto-conversion.
N-terminal sequencing analysis on the mature PfPM1 species revealed that self-processing occurred equally between Phe111p-Phe112p and between Leu116p-Thr117p (Supplement Figure 4).
The kinetics of cleavage of several chromogenic peptide substrates by the converted mature PfPM1 was studied (Table 2). Compared with the naturally-occurring form (35), the recombinant PfPM1 showed comparable Michaelis constants (Km) on the substrate B and C; however, the catalytic constant (kcat) of the recombinant PfPM1 was approximately 6-fold and 2-fold lower than that of its naturally-occurring counterpart for the substrate B and C, respectively, which resulted in up to a 7-fold less efficient hydrolysis on these two compounds.
Table 2.
Kinetic parameters of naturally-occurring and recombinant PfPM1
| Substrate | Plasmepsin 1 | ||||||
|---|---|---|---|---|---|---|---|
| Recombinant K110pN | Naturally-occurringa | ||||||
| kcat (s−1) | Km (µM) |
kcat/Km (mM−1 s−1) |
kcat (s−1) | Km (µM) |
kcat/Km (mM− 1s−1) |
||
| (A) | Lys-Pro-Ile-Leu-Phe*Nph-Arg-Leu | 1.1 ± 0.1 | 13.2 ± 1.7 | 85 ± 15 | n.d. | n.d. | n.d. |
| (B) | Leu-Glu-Arg-Ile-Phe*Nph-Ser-Phe | 2.6 ± 0.1 | 8.6 ± 0.2 | 302 ± 14 | 16 | 8 | 2000 |
| (C) | Lys-Glu-Leu-Val-Phe*Nph-Ala-Leu-Lys | 2.9 ± 0.2 | 9.0 ± 1.5 | 322 ± 59 | 6 | 8 | 750 |
| Inhibitor | Ki (nM) | ||||||
| Recombinant K110pN | Naturally-occurringa | ||||||
| (D) | pepstatin A | 1.4 ± 0.2 | 0.7 | ||||
| (E) | Ro40-4388 | 25 ± 4 | 9 | ||||
Data of the naturally-occurring form of PfPM1 are cited from (36).
n.d. = not determined.
The dissociation constants (Ki) of two competitive inhibitors against the purified mature PfPM1 were determined (Table 2). While pepstatin A showed low nanomolar binding affinity, the inhibition constant of Ro40-4388 was also in the nanomolar range. For both cases, the Ki values from the recombinant PfPM1 were comparable with those from the naturally-occurring form (36).
Such findings lead to the notion that the 7- and/or 12-residue prosegment resulting from auto-maturation of the recombinant proPfPM1 interferes with the catalytic efficiency of the mature enzymes but has little effect on compound binding to the active site, which has been similarly observed in PfPM1 activated from another proenzyme variant (36, 37).
Subsite Preferences
The hydrolysis by PfPM1 on the P1 and P1’ combinatorial libraries were performed at the optimal catalysis condition for the mature enzyme. The amino acid preferences at each subsite were ranked according to the normalized cleavage velocity for primary specificities or to the percent relative abundances of the hydrolyzed penta- or tripeptides for secondary specificities.
a. Primary specificity
The amino acids at the P1 or P1’ positions define the difference between peptide pools of the two defined libraries. The initial rates, representing the primary specificity, are directly affected by the residue identities at these two sites. PfPM1 exclusively preferred accommodation of bulky hydrophobic residues in the S1 subsite (Figure 3a). The best two substitutions were Phe and Leu. Tyr and norLeu were acceptable, while other P1 residues, including Trp and Ile, led to poor recognition by PfPM1.
Figure 3.

Primary subsite preferences of PfPM1. The initial velocity for hydrolysis of each P1 or P1’library pool was determined spectroscopically and normalized by setting the highest hydrolyzing velocities to 100. The normalized initial velocities averaged from three individual experiments were plotted against the P1/P1’ residues that represent corresponding peptide pools.
The optimal P1’ amino acid substitutions for PfPM1 were also consistently hydrophobic residues (Figure 3b). At P1’, Leu was the most favorable amino acid for PfPM1, rather than Phe. The other aromatic or aliphatic substitutions except for Trp resulted in 40–75 percent of the maximal cleavage efficiency. Notably the initial rates decreased as the size of side chains decreased from Leu to Gly or expanded to Trp, which was potentially due to the level of surface contacts with residues of the S1’ subsite. In addition, similar to the results from the P1 library, PfPM1 did not exhibit rapid hydrolysis on peptide pools bearing most of the polar or charged P1’ residues.
b. Secondary specificity
The best peptide pools, P1Phe and P1’Leu, were utilized to explore the secondary subsite preferences at the N-terminal (the S3 and S2’ site) and the C-terminal domain (the S2 and S3’ site) of PfPM1, respectively.
Large hydrophobic amino acids including both the aliphatic and aromatic residues were strongly favored in the S3 subsite of PfPM1 (Figure 4a). Phenylalanine was overall the optimal substitution of this particular position.
Figure 4.

Secondary subsite preferences of PfPM1. The relative abundances of possible penta- or tripeptides from hydrolysis of the best P1 or P1’library pool were determined using in-line LC-MS and normalized by setting the quantities of the most abundant cleavage products to 100. The normalized relative abundances averaged from three individual trials were plotted against the variables that represent corresponding cleavage products. The residues are listed in order of the retention time of their related peptides.
At the S2 subsite, PfPM1 was able to tolerate P2 residues of varied properties except for the three basic residues, Lys, Arg and His (Figure 4b). The best amino acid substitution was Ser, which was followed by Ile. Most of the hydrophobic residues were moderately accepted regardless of the different sizes, except for Trp.
Gln was overwhelmingly favored in the S2’ subsite of PfPM1 (Figure 4c). Peptide products containing the other substitutions were all less than 30% abundant, though the acceptances of residues of different features were comparable and detectable.
PfPM1 exclusively preferred bulky hydrophobic residues at the S3’ subsite, such as Leu, Ile, norLeu, Phe and Trp (Figure 4d). Overall the best amino acid substitutions in S3’ were Phe and Ile.
Inhibitor Design and Analysis of Binding
By analyzing the data obtained from the combinatorial library studies, a rationally designed inhibitor, namely compound 1 (Table 3), was developed with sequence K-P-F-S-LΨL-Q-F (Ψ = -CH2-NH-). This compound bound PfPM1 more tightly than other DV plasmepsins from the human malaria parasites and showed a 5-fold selectivity on inhibition of PfPM1 over hcatD (Table 3).
Designed on the basis of the same rationale, compounds 2–6 were selective inhibitors to other DV plasmepsin homologs (15). The inhibition of such compounds against PfPM1 was subsequently tested (Table 3). All these compounds, except for compound 2, bound to PfPM1 more than 100-fold weaker than compound 1. Furthermore, this group of inhibitors, except for compound 2, did not show selectivity for binding to PfPM1 over hcatD as observed with compound 1. These data indicated that the binding affinity and specificity of peptidomimetic inhibitors against PfPM1 can be improved using the combinatorial chemistry based library screening method.
Structural analysis of the PfPM2 complex with compound 1
Table 4 presents the crystallographic data for the analysis of the complex of PfPM2 and compound 1 by X-ray diffraction. The derived structure of the complex of PfPM2 with compound 1 is very similar to other plasmepsin 2 structures reported in the PDB, with a typical aspartic proteinase fold exhibited in Figure 5. Of the structures reported in the PDB, three contain inhibitors that are most similar to compound 1 and have been used for comparison. These are, with RMSD to the new structure reported herein, PDB code: 1XDH (DOI 10.2210/pdb1xdl/pdb) (RMSD = 0.92 Ǻ), PDB code: 1ME6 (DOI 10.2210/pdb1me6/pdb) (RMSD = 0.74 Ǻ), and PDB code: 1W6H (38) (RMSD = 0.75 Ǻ). All contain the statine isostere or a derivative in the P1 position, which places a leucine-like side chain in the S1 pocket of the enzyme.
Table 4.
Data collection and refinement statistics for the PfPM1-compound 1 complex (PDB accession number 2R9B).
| Crystal data | |
|---|---|
| Unit cell parameters | |
| a (Ǻ) | 219.5 |
| b (Ǻ ) | 69.03 |
| c (Ǻ) | 53.58 |
| α (°) | 90 |
| β (°) | 102.9 |
| γ (°) | 90 |
| Solvent content (%) | 51.1 |
| Vm | 2.55 |
| Molecules per AU | 2 |
| Data collection | |
| Resolution (Ǻ), (resolution in highest shell) | 20. − 2.8 (2.9 − 2.8) |
| Unique reflections | 18031 |
| Observations | 170834 |
| Rsymm | 9.8(30.3) |
| I/σ(I) | 9.0(2.6) |
| Completeness (%) | 95.8(92.2) |
| Mean multiplicity | 2.8(2.6) |
| Refinement | |
| Reflections used in refinement | 17974 |
| Rcryst | 23.7 |
| Rfree | 28.7 |
| Reflections used in Rfree (%) | 9.2 |
| RMS deviation, bonds (Ǻ) | 0.009 |
| RMS deviation, angles (°) | 1.337 |
| Ramachandran plot (%) | |
| Most favored | 85.5 |
| Additionally allowed | 14.0 |
| Generously allowed | 0.5 |
| Disallowed | 0.0 |
| Model | |
| Total number of amino acids | 658 |
| Protein atoms (including inhibitor) | 5357 |
| Solvent atoms | 42 |
Figure 5.

Surface presentation of the structure of PfPM2 in complex with compound 1. Compound 1 is shown in cyan sticks. In the detailed view of the active site (right part), residues making interaction with the inhibitor are depicted in lines. This image was created using the Pymol program and the coordinates of molecule A from the final refined structure. Detailed views of the interactions between the side chains of compound 1 and the protein are shown in the Supplement section.
During cycles of refinement of this crystal structure, a positive peak in the difference electron density maps was present in both molecules between the inhibitor and the catalytic carboxylate of aspartate 214. This peak was interpreted as a trapped water molecule, possibly arising from the catalytic water molecule normally seen in uncomplexed aspartic proteases. It makes potential hydrogen bonds with the methyleneamino nitrogen atom and the p2 serine hydroxyl of the inhibitor 1, and the carboxylate oxygen atoms of Asp214. A similar water molecule does not appear in the endothiapepsin complex with a methyleneamino-based inhibitor (2ER6, (39)). It is possible that the plasmepsin active site is sufficiently different from that of endothiapepsin, or that the difference density seen in this work is an artifact of the low resolution of the diffraction data. In a complex of a different type of inhibitor Prade et al. (40) have also observed a water molecule binding between the catalytic aspartates and a nitrogen of the inhibitor.
The P3, P1, and P2’ side chains of compound 1 interact with the corresponding S3, S1, and S2’ pockets of the active site of PfPM2. The P3 Phe side chain of compound 1 is surrounded by PfPM2 side chains Ile14, Met15, Ile32, Thr35, Phe120, Asp214, Gly216, and Ser218 (Supplement Figure 5c). The P1 Leu side chain of compound 1 is within 5 Å of PfPM2 side chains Ile32, Asp34, Tyr77, Phe111, Thr114, Ile123, and Gly216 (Supplement Figure 5a). The P2’ Gln side chain of compound 1 is surrounded by PfPM2 side chains Gly36, Ala38, Asn39, Met75, Tyr77, Leu131 and Ile133 (Supplement Figure 5f).
Similarly, the P2 and P1’ side chains of compound 1 interact with residues Ile290, Leu292, Ile300, Val78 and Thr217 and residues Tyr192, Ile300, Ile212 and Phe294 (Supplement Figure 5b and Fig 5e, respectively). The P3’ Phe side chain of compound 1 makes a unique interaction with a “notch” in the active site structure between amino acids Tyr192 and Phe294 (Supplement Figure 5g and Supplement Figure 6). It is also of interest that the amino acid in the P4 position of compound 1, a proline, is able to interact with a hydrophobic surface defined by Ile290, Ile300, and Leu292 (Supplement Figure 5d). In another complex of this type of methyleneamino inhibitor, H-256, with endothiapepsin (39) the P3 amino acid is a Thr, which is not able to make strong interactions with the S3 pocket of the enzyme. Consequently, the P4 proline in that case points more toward solvent and does not make the same kind of interactions seen in the compound 1/PfPM2 complex reported here.
Molecular Modeling
The molecular mechanisms that account for the differences in affinity observed among the series of inhibitors and enzymes considered in this work were further explored by molecular modeling studies, which have shown to be a successful tool in previous plasmepsin-inhibitor design projects (41). Our first concern was to determine if the binding mode experimentally observed for the PfPM2 in complex with compound 1 was conserved among our peptidomimetic inhibitors in complex with the different plasmepsins. An alternative hypothesis would be that different binding modes could explain the experimental differences in affinity. For this purpose we conducted an automated docking exploration of the six inhibitors in PfPM1, PfPM2 and PfPM4 protein structures. The PfPM4 model was intended to be representative of the PM4 orthologs present in all plasmodium species, since all the PM4 enzymes display very similar response upon binding of the 6 inhibitors studied (see Table 3). In all cases, following our criteria for the selection of docking poses (see Methods section), only one reliable binding mode could be extracted for each of the 18 complexes simulated, which is the analogous pose to the experimentally observed binding mode of compound 1 in PfPM2. Thus, it can be concluded that no alternative binding modes could be found for any of the inhibitors on the basis of our exhaustive, automated docking exploration. Moreover, based on the scores obtained for the best poses in PfPM2, there is a moderate qualitative correlation with respect to the experimental inhibition data for this enzyme: on the one hand, compounds 1 and 2, with experimental affinities in the nanomolar range, show positive score values of 23.8 and 21.9, respectively; on the other hand, compounds 3–6, with high µM inhibition constants, display calculated score values of −8.3, 7.3, 7.4 and 10.8, respectively. In the case of PfPM4 and PfPM1, no correlation between scores and experimental affinities is observed, which can be expected due to the sensitivity of scoring functions to the (homology modeling derived) structure of the protein (42).
Since the binding mode seemed to be conserved among the ligand series and the different plasmepsins, the next step was to refine every enzyme-inhibitor combination by an alternative manual docking protocol (see Methods). As expected, this procedure allowed more accurate binding poses in all the 18 complexes considered (see Figure 6). Interestingly, compounds bearing a Glutamic acid at position P2 display conformations that allow the formation of an internal salt bridge with the methylenamino group. However, this interaction is somehow less favored in PfPM2 or PfPM1 complexes, possibly related to the presence of the more bulky Val in the tip of the flap loop, instead of the conserved Gly found in all PM4 enzymes. Another interesting observation accounts for the C-terminal of the peptide, which is making an internal salt-bridge with the arginine at position 7 on inhibitors 4 and 5. In contrast, the more bulky and hydrophobic Trp at this position in compound 6 is not well accommodated in any of the enzymes, offering an explanation for its low affinity in all the plasmepsins tested so far.
Figure 6.

Superposition of the six compounds modeled into the active site of PfPM1 (top), PfPM2 (middle) and PfPM4 (bottom). The ligand carbon atoms are colored cyan (compound 1), magenta (compound 2), yellow (compound 3), orange (compound 4), white (compound 5) and violet (compound 6). The image was created with Pymol v1.1.
Discussion
Preparation of sufficient amounts of the naturally-occurring PfPM1 for kinetic and structural studies has proven to be difficult to accomplish, thus our efforts focused on production of the recombinant form using the heterologous E. coli expression system. Previous studies indicated that the wild type recombinant proPfPM1 was not able to conduct auto-maturation (14). Therefore, we attempted to engineer the prosegment of wild type zymogen to create a self-cleavage site. As a successful precedent, Beyer et al. (43) introduced an oligopeptide substrate sequence to the prosegment of human cathepsin D zymogen to replace the original counterpart. The resulting mutant was able to perform auto-conversion and the activated species showed comparable kinetic parameters with the naturally-occurring enzyme. Considering that proPfPM2 undergoes self-maturation readily (24), we compared residues between proPfPM1 and proPfPM2 in the vicinity of a potential maturation site, Phe111p-Phe/Leu112p (23, 36), and substituted the residue hypothetically occupying the S2 pocket of PfPM1 during self-processing for the corresponding one in proPfPM2 to generate the K110pN mutant (Figure 7). In addition, expression of the full length proPfPM1 in E. coli led to production of a truncated zymogen with the prosegment cut to only 52 residues (37) probably due to the toxicity of the membrane-spanning domain (Figure 1). Therefore, a truncated version of proPfPM1 mutant lacking the transmembrane domain was produced in E. coli. An average of 1.2 mg of purified activatable PfPM1 zymogen was obtained from 1 liter of cell culture (Table 1). However, considering the perfect overlap between the concentration (A280) and catalytic activity profile of the size exclusion chromatography (Supplement Figure 1), this additional purification step might not be necessary. Thus, 2.1 mg of activatable proPfPM1 could be produced on average out of 1 liter of cell culture representing nearly 5% of the initial protein material for renaturation (determined by A280. In terms of the yield, this has been a significant improvement compared with production of the previously reported recombinant proPfPM1 K110pV mutant (14) where 0.9 mg of fully activatable zymogen was purified from 14 liters of cell culture representing only 0.6% of the initial recombinant proPfPM1 material (determined by A280). Different constructs (K110pN vs. K110pV) and/or denaturation and refolding methods applied on inclusion body materials may be responsible for the observed improvement in yield.
Figure 7.

Amino acid sequence comparison of the PfPM1 and PfPM2 prosegment portions that potentially bind in the active site cleft during auto-maturation. The residues belonging to the prosegment are in black, whereas the initial sequences for the mature enzymes are in green. The active site pockets in which prosegment residues were supposed to be accommodated are illustrated. The auto-processing was believed to occur between the two hydrophobic residues in blue, which has been verified by N-terminal sequence analysis. The mutated residue is highlighted in red.
Interestingly, the optimal pH for the auto-maturation of proPfPM1 and that for the catalysis of mature PfPM1 differ by approximately one pH unit. In one respect, at the optimal condition (pH 5.5) for the catalysis of mature PfPM1, the zymogen does not conduct efficient self-processing (data not shown). In the other respect, at the conditions (pH 4.0–4.5) for the most efficient self-maturation, only about 30% of full catalytic activity of mature enzyme is exhibited. In parallel, we also studied the catalytic activity of the proPfPM1 K110pN mutant at different pH conditions (Figure 2a). As we expected, catalytic activities of PfPM1 are only detected within a narrow pH range of 4.0–4.5, which confirms that proenzyme maturation is required for PfPM1 to become catalytically active.
As the pH of the transport vesicles and the digestive vacuole inside P. falciparum parasite is around 5.0–5.4 (44, 45), it seems impossible for the naturally-occurring proPfPM1 to conduct auto-maturation in such compartments as well. Additionally, the peptide bond between the prosegment and mature enzyme is not a favorite cleavage site for PfPM1, −2, or −4 (15), indicating that there may exist different endopeptidase(s) in the digestive vacuoles acting as the convertase(s) (6, 46). The associated N-terminal prosegment resulting from auto-maturation of the recombinant PfPM1 zymogen is believed to be responsible for diminishing the catalytic efficiency. From this point of view, improvement of catalytic efficiency to the level of PfPM1 relies on identification of the potential convertase.
Due to the difficulties of production of active recombinant enzyme, characterization of the substrate specificities of PfPM1 has mainly relied on single substrate studies previously. Gluzman et al. (47) investigated PfPM1 digestion on its natural substrate hemoglobin and identified six cleavage sites, three on α and β chain each (α33–α34, RMF-LSF; α46–α47, PHF-DLS; α98–α99, VNF-KLL; β31–β32, GRL-LVV; β41–42, QRF-FES; and β129–130, QAA-YQK; - represents the cleavage site). All six sites are specific for PfPM1 digestion except for α33–α34. Other than the conserved hydrophobic features of P1 residues, amino acids with varied properties emerge across the S3-S3’ subsites, which does not agree well with the results from our combinatorial chemistry approach. These findings not only confirms that hydrophobic P1 residue play an essential role on substrate recognition and processing by PfPM1 but also indicates that the binding specificity of a peptide is determined by the entire sequence that spans the active site cleft rather than single isolated residues.
Tyas et al. measured the specificity constants (kcat/Km) of a series of chromogenic peptide substrates for PfPM1, which focused on the P3, P2 and P2’ positions. The peptide substrate K-E-F-V-F*Z-A-L-K (Z = para-nitrophenylalanine, and * represents the cleavage bond) was used as a template for comparison. Both the P3F to P3L and P2V to P2N alterations decreased the specificity constants more than 2-fold and the P2’A to P2’R alteration maintains a similar kcat/Km as the reference. These findings are generally consistent with the results from our combinatorial library studies (Figure 4). Siripurkpong et al. (48) employed a random decamer peptide library to analyze the subsite preferences at the prime side of PfPM1. The results reveal that the S1’ subsite prefers hydrophobic residues and the S2’ subsite shifts its preferences more to polar residues, which generally agree with the results from our combinatorial libraries. In that study Serine was also found to be a preferred P1’ substitution; that may be due to the different peptide constructions and/or analysis approaches.
The secondary subsite preferences from other favored P1 or P1’ peptide libraries, such as P1-Leu, P1-Tyr, P1’-nLeu and P1’-Phe, were also investigated (data not shown). The overall results are consistent with those from the best libraries, however, some distinctive features are worthy of consideration. As an example, a pentapeptide product with P3-Leu was equally favored with P3-Phe in the products of digestion of the P1-Leu library, but was merely detected in the products from the P1-Tyr pool, for which, only the pentapeptides containing aromatic Phe and Trp at the P3 position could be recognized. Another example came from P2-Gly and P2-Glu. Both residues were moderately accepted (30–65%) in digestion of the P1’-Leu (Figure 4b) and P1’-nLeu pools (data not shown), but were disfavored in the P1’-Phe library analysis. Such evidence further suggests that the subsite preferences of PfPM1 depend on the context of the peptide sequence fitted to the proteinase. Such mutual influences among residues of varied positions upon subsite accommodation are necessary and have been considered during the rational design of compound 1. It should be noted that the compounds listed in Table 3 are designed specifically as ligands for the plasmepsins to facilitate analysis of the binding by X-ray crystallographic methods. Due to the number of positively and negatively charged amino acids and the length of the peptides, it is not anticipated that these compounds would readily traverse the membranes of the red blood cell and the parasite; indeed, tests of compounds 1–6 (Table 3) showed only micromolar potency at best. Future drug design will require the conversion of these peptidomimetic structures to reduce the peptide character and permit more efficient membrane penetration.
Among the several rationally designed peptidomimetic inhibitors, compound 1 and 2 exhibit the highest binding affinity and specificity to their primarily targeted enzymes (PfPM1 and 2, respectively). Compounds 3, 4 and 5, containing bulky sidechains (Phe, Tyr or Arg) at P1 and P1’, exhibit at least 1000-fold selectivity for any of the PM4 enzymes over PfPM1 and 2. In contrast, compounds 1 and 2, harboring smaller Leu or nLeu at the same positions, weaken their inhibition against PM4 enzymes by at least 10-fold with respect to compounds 3–5. Such findings might be an indication that the corresponding S1 and S1’ pockets of PfPM1and PfPM2 possess a smaller volume than those of the PM4 enzymes. We also noticed that compounds 3–5 share a charged Glu at P2, which is substituted by a non-charged polar Ser in compounds 1 and 2.
All these observations were put in the context of structural models of inhibitor binding with the aid of molecular modeling techniques. An exhaustive docking search discarded any hypothesis about alternative binding modes with respect to the pose observed in the crystal structure of inhibitor 1 in PfPM2. After geometrical optimization of the binding mode of each inhibitor-plasmepsin complex, we observed that the conformation adopted by compounds containing a Glu in P2 is more favored in the PM4 enzymes, due to the absence of the bulky valine conserved at the tip of the flap of both PfPM1 and PfPM2 enzymes. Finally, it is remarkable that compound 6 shows very low binding affinity to all tested enzymes and no selectivity among them. Our models suggest that such a design failure is due to incorporation of Trp at P2’: this residue shows a poor accommodation in the S2' pocket, thus providing a structural explanation for the marked unfavorable effect on the binding of this inhibitor in all plasmepsins.
Supplementary Material
Acknowledgements
Supporting Information Available: Additional figures showing the purification of the enzyme, analysis of the self-catalyzed proenzyme to enzyme conversion, and details of the active site structure are provided in the Supplement. This material is available free of charge via the Internet at http://pubs.acs.org
Funding: The initial phase of this work was supported by NIH grant AI39211 to BMD and JBD. H Gutiérrez-de-Terán is supported by the Isidro Parga Pondal programme (Xunta de Galicia, Spain). D. Rodríguez is supported by a bursary from the Fondo de Investigación Sanitaria program (ISCIII-Ministerio de Ciencia e Innovación, Spain).
Abbreviations
- PfPM1
Plasmodium falciparum plasmepsin 1
- PfPM2
Plasmodium falciparum plasmepsin 2
- PfPM4
Plasmodium falciparum plasmepsin 4
- PvPM4
Plasmodium vivax plasmepsin 4
- PoPM4
Plasmodium ovale plasmepsin 4
- PmPM4
Plasmodium malariae plasmepsin 4
- hcat D
human cathepsin D
- P5 (or P4, P3, P2, P1, P1’, P2’, P3’)
Schechter and Berger (1) nomenclature for the amino acids on the amino terminal side of a scissile peptide bond moving toward the N-terminus (P1 to P5) or the carboxyl terminal side of a scissile peptide bond moving toward the C-terminus (P1’-P3’) of a substrate or an inhibitor
- S4 (or S3, S2, S1, S1’, S2’, S3’)
Schechter and Berger nomenclature for the corresponding enzyme subsites that interact with the P4 or other amino acid residues
- DV
digestive vacuole
- Nph
para-nitroPhenylalanine
- LC-MS
liquid chromatography-mass spectrometry
- IPTG
isopropylthio-β-galactopyranoside
- A600
absorbance at 600 nm
- MWCO
molecular weight cutoff
- SDS-PAGE
sodium dodecyl sulfate polyacrylamide gel electrophoresis
- PVDF
polyvinylidene difluoride
- DMSO
dimethyl sulfoxide
- AU
absorbance units
- rpHPLC
reversed phase high performance liquid chromatography
- TFA
trifluoroacetic acid
- ESI
electrospray ionization
- PEG
polyethylene glycol
- RMSD
root mean square deviation
- proenzyme
the precursor form of a proteolytic enzyme, usually with an N-terminal extension that blocks activity
- semi-proenzyme
a truncated form of the proenzyme in which some sequence is removed from the amino terminal end, usually to avoid a membrane insertion site
- K110pN
the sequence numbers of the prosegment of the precursor form of the enzymes are given by convention with the letter “p” following the sequence number. Thus, K110pN is the mutation of Lys 110 of the prosegment to Asn.
References
- 1.Schechter I, Berger A. On the size of the active site in proteases I. Papain. Biochem. Biophys. Res. Commun. 1967;27:157–162. doi: 10.1016/s0006-291x(67)80055-x. [DOI] [PubMed] [Google Scholar]
- 2.Coombs GH, Goldberg DE, Klemba M, Berry C, Kay J, Mottram JC. Aspartic proteases of Plasmodium falciparum and other parasitic protozoa as drug targets. Trends Parasitol. 2001;17:532–537. doi: 10.1016/s1471-4922(01)02037-2. [DOI] [PubMed] [Google Scholar]
- 3.Goldberg DE, Slater AF, Beavis R, Chait B, Cerami A, Henderson GB. Hemoglobin degradation in the human malaria pathogen Plasmodium falciparum: a catabolic pathway initiated by a specific aspartic protease. J. Exp. Med. 1991;173:961–969. doi: 10.1084/jem.173.4.961. [DOI] [PMC free article] [PubMed] [Google Scholar]
- 4.Francis SE, Gluzman IY, Oksman A, Knickerbocker A, Mueller R, Bryant ML, Sherman DR, Russell DG, Goldberg DE. Molecular characterization and inhibition of a plasmodium-falciparum aspartic hemoglobinase. EMBO J. 1994;13:306–317. doi: 10.1002/j.1460-2075.1994.tb06263.x. [DOI] [PMC free article] [PubMed] [Google Scholar]
- 5.Dame JB, Reddy GR, Yowell CA, Dunn BM, Kay J, Berry C. Sequence, expression and modeled structure of an aspartic proteinase from the human malaria parasite Plasmodium falciparum. Mol. Biochem. Parasitol. 1994;64:177–190. doi: 10.1016/0166-6851(94)90024-8. [DOI] [PubMed] [Google Scholar]
- 6.Banerjee R, Liu J, Beatty W, Pelosof L, Klemba M, Goldberg DE. Four plasmepsins are active in the Plasmodium falciparum food vacuole, including a protease with an active-site histidine. Proc Natl Acad Sci U S A. 2002;99:990–995. doi: 10.1073/pnas.022630099. [DOI] [PMC free article] [PubMed] [Google Scholar]
- 7.Dame JB, Yowell CA, Omara-Opyene L, Carlton JM, Cooper RA, Li T. Plasmepsin 4, the food vacuole aspartic proteinase found in all Plasmodium spp. infecting man. Mol Biochem Parasitol. 2003;130:1–12. doi: 10.1016/s0166-6851(03)00137-3. [DOI] [PubMed] [Google Scholar]
- 8.Asojo OA, Afonina E, Gulnik SV, Yu B, Erickson JW, Randad R, Medjahed D, Silva AM. Structures of Ser205 mutant plasmepsin II from Plasmodium falciparum at 1.8 angstrom in complex with the inhibitors rs367 and rs370. Acta Cryst. Section D-Biol. Cryst. 2002;58:2001–2008. doi: 10.1107/s0907444902014695. [DOI] [PubMed] [Google Scholar]
- 9.Asojo OA, Gulnik SV, Afonina E, Yu B, Ellman JA, Haque TS, Silva AM. Novel uncomplexed and complexed structures of plasmepsin II, an aspartic protease from Plasmodium falciparum. J. Mol. Biol. 2003;327:173–181. doi: 10.1016/s0022-2836(03)00036-6. [DOI] [PubMed] [Google Scholar]
- 10.Clemente JC, Govindasamy L, Madabushi A, Fisher SZ, Moose RE, Yowell CA, Hidaka K, Kimura T, Hayashi Y, Kiso Y, Agbandje-McKenna M, Dame JB, Dunn BM, McKenna R. Structure of the aspartic protease plasmepsin 4 from the malarial parasite Plasmodium malariae bound to an allophenylnorstatine-based inhibitor. Acta Crystallographica Section D-Biological Crystallography. 2006;62:246–252. doi: 10.1107/S0907444905041260. [DOI] [PubMed] [Google Scholar]
- 11.Silva AM, Lee AY, Gulnik SV, Maier P, Collins J, Bhat TN, Collins PJ, Cachau RE, Luker KE, Gluzman IY, Francis SE, Oksman A, Goldberg DE, Erickson JW. Structure and inhibition of plasmepsin II, a hemoglobin-degrading enzyme from Plasmodium falciparum. Proc. Natl. Acad. Sci. U.S.A. 1996;93:10034–10039. doi: 10.1073/pnas.93.19.10034. [DOI] [PMC free article] [PubMed] [Google Scholar]
- 12.Francis SE, Banerjee R, Goldberg DE. Biosynthesis and maturation of the malaria aspartic hemoglobinases plasmepsins I and II. J. Biol. Chem. 1997;272:14961–14968. doi: 10.1074/jbc.272.23.14961. [DOI] [PubMed] [Google Scholar]
- 13.Bailly E, Jambou R, Savel J, Jaureguiberry G. Plasmodium falciparum: differential sensitivity in vitro to E-64 (cysteine protease inhibitor) and Pepstatin A (aspartyl protease inhibitor) J. Protozool. 1992;39:593–599. doi: 10.1111/j.1550-7408.1992.tb04856.x. [DOI] [PubMed] [Google Scholar]
- 14.Moon RP, Tyas L, Certa U, Rupp K, Bur D, Jacquet C, Matile H, Loetscher H, Grueninger-Leitch F, Kay J, Dunn BM, Berry C, Ridley RG. Expression and characterisation of plasmepsin I from Plasmodium falciparum. Eur. J. Biochem. 1997;244:552–560. doi: 10.1111/j.1432-1033.1997.00552.x. [DOI] [PubMed] [Google Scholar]
- 15.Beyer BB, Johnson JV, Chung AY, Li T, Madabushi A, Agbandje-McKenna M, McKenna R, Dame JB, Dunn BM. Active-site specificity of digestive aspartic peptidases from the four species of Plasmodium that infect humans using chromogenic combinatorial peptide libraries. Biochemistry. 2005;44:1768–1779. doi: 10.1021/bi047886u. [DOI] [PubMed] [Google Scholar]
- 16.Hill J, Tyas L, Phylip LH, Kay J, Dunn BM, Berry C. High level expression and characterisation of Plasmepsin II, an aspartic proteinase from Plasmodium falciparum. FEBS Lett. 1994;352:155–158. doi: 10.1016/0014-5793(94)00940-6. [DOI] [PubMed] [Google Scholar]
- 17.Wyatt DM, Berry C. Activity and inhibition of plasmepsin IV, a new aspartic proteinase from the malaria parasite, Plasmodium falciparum. FEBS Lett. 2002;513:159–162. doi: 10.1016/s0014-5793(02)02241-x. [DOI] [PubMed] [Google Scholar]
- 18.Westling J, Yowell CA, Majer P, Erickson JW, Dame JB, Dunn BM. Plasmodium falciparum, P. vivax, and P. malariae: a comparison of the active site properties of plasmepsins cloned and expressed from three different species of the malaria parasite. Exp. Parasitol. 1997;87:185–193. doi: 10.1006/expr.1997.4225. [DOI] [PubMed] [Google Scholar]
- 19.Scarborough PE, Guruprasad K, Topham C, Richo GR, Conner GE, Blundell TL, Dunn BM. Exploration of subsite binding-specificity of human cathepsin-D through kinetics and rule-based molecular modeling. Protein Sci. 1993;2:264–276. doi: 10.1002/pro.5560020215. [DOI] [PMC free article] [PubMed] [Google Scholar]
- 20.Beyer BM, Dunn BM. Prime region subsite specificity characterization of human cathepsin D: The dominant role of position 128. Protein Sci. 1998;7:88–95. doi: 10.1002/pro.5560070109. [DOI] [PMC free article] [PubMed] [Google Scholar]
- 21.Dunn BM, Scarborough PE, Davenport R, Swietnicki W. Analysis of proteinase specificity by studies of peptide substrates: The use of UV and fluorescence spectroscopy to quantitate rates of enzymatic cleavage. In: Dunn BM, Pennington MW, editors. Peptide Analysis Protocols. Totowa: Humana Press; 1994. pp. 225–243. [DOI] [PubMed] [Google Scholar]
- 22.Goldfarb NE, Lam MT, Bose AK, Patel AM, Duckworth AJ, Dunn BM. Electrostatic switches that mediate the pH-dependent conformational change of “short” recombinant human pseudocathepsin D. Biochemistry. 2005;44:15725–15733. doi: 10.1021/bi0511686. [DOI] [PMC free article] [PubMed] [Google Scholar]
- 23.Li T, Yowell CA, Beyer BB, Hung SH, Westling J, Lam MT, Dunn BM, Dame JB. Recombinant expression and enzymatic subsite characterization of plasmepsin 4 from the four Plasmodium species infecting man. Mol. Biochem. Parasitol. 2004;135:101–109. doi: 10.1016/j.molbiopara.2004.01.010. [DOI] [PubMed] [Google Scholar]
- 24.Westling J, Cipullo P, Hung SH, Saft H, Dame JB, Dunn BM. Active site specificity of plasmepsin II. Protein Sci. 1999;8:2001–2009. doi: 10.1110/ps.8.10.2001. [DOI] [PMC free article] [PubMed] [Google Scholar]
- 25.Morrison JF. Kinetics of reversible inhibition of enzyme-catalyzed reactions by tight-binding inhibitors. Biochim. Biophys. Acta. 1969;185:269–286. doi: 10.1016/0005-2744(69)90420-3. [DOI] [PubMed] [Google Scholar]
- 26.Otwinowski Z, Minor W. Processing of X-ray diffraction data collected in oscillation mode. Methods in Enzymol. 1997;276:307–326. doi: 10.1016/S0076-6879(97)76066-X. [DOI] [PubMed] [Google Scholar]
- 27.Brunger AT, Adams PD, Clore GM, DeLano WL, Gros P, Grosse-Kunstleve RW, Jiang JS, Kuszewski J, Nilges M, Pannu NS, Read RJ, Rice LM, Simonson T, Warren GL. Crystallography & NMR system: A new software suite for macromolecular structure determination. Acta Cryst Section D-Biol. Cryst. 1998;54:905–921. doi: 10.1107/s0907444998003254. [DOI] [PubMed] [Google Scholar]
- 28.Jones TA, Zou JY, Cowan SW, Kjeldgaard M. Improved methods for the building of protein models in electron density maps and the location of errors in these models. Acta Cryst. Section A. 1991;47:110–119. doi: 10.1107/s0108767390010224. [DOI] [PubMed] [Google Scholar]
- 29.Schwede T, Kopp J, Guex N, Peitsch MC. SWISS-MODEL: an automated protein homology-modeling server. Nuc. Acids Res. 2003;31:3381–3385. doi: 10.1093/nar/gkg520. [DOI] [PMC free article] [PubMed] [Google Scholar]
- 30.Word JM, Lovell SC, Richardson JS, Richardson DC. Asparagine and glutamine: Using hydrogen atom contacts in the choice of side-chain amide orientation. J. Mol. Biol. 1999;285:1735–1747. doi: 10.1006/jmbi.1998.2401. [DOI] [PubMed] [Google Scholar]
- 31.Weichenberger CX, Byzia P, Sippl MJ. Visualization of unfavorable interactions in protein folds. Bioinformatics. 2008;24:1206–1207. doi: 10.1093/bioinformatics/btn108. [DOI] [PubMed] [Google Scholar]
- 32.Jones G, Willett P, Glen RC, Leach AR, Taylor R. Development and validation of a genetic algorithm for flexible docking. J. Mol. Biol. 1997;267:727–748. doi: 10.1006/jmbi.1996.0897. [DOI] [PubMed] [Google Scholar]
- 33.Verdonk ML, Cole JC, Hartshorn MJ, Murray CW, Taylor RD. Improved protein-ligand docking using GOLD. Proteins-Struct. Func. Gen. 2003;52:609–623. doi: 10.1002/prot.10465. [DOI] [PubMed] [Google Scholar]
- 34.Phillips JC, Braun R, Wang W, Gumbart J, Tajkhorshid E, Villa E, Chipot C, Skeel RD, Kale L, Schulten K. Scalable molecular dynamics with NAMD. J. of Comp. Chem. 2005;26:1781–1802. doi: 10.1002/jcc.20289. [DOI] [PMC free article] [PubMed] [Google Scholar]
- 35.Jorgensen WL, Maxwell DS, TiradoRives J. Development and testing of the OPLS all-atom force field on conformational energetics and properties of organic liquids. J. Ame. Chem. Soc. 1996;118:11225–11236. [Google Scholar]
- 36.Tyas L, Gluzman I, Moon RP, Rupp K, Westling J, Ridley RG, Kay J, Goldberg DE, Berry C. Naturally-occurring and recombinant forms of the aspartic proteinases plasmepsins I and II from the human malaria parasite Plasmodium falciparum. FEBS Lett. 1999;454:210–214. doi: 10.1016/s0014-5793(99)00805-4. [DOI] [PubMed] [Google Scholar]
- 37.Luker KE, Francis SE, Gluzman IY, Goldberg DE. Kinetic analysis of plasmepsins I and II, aspartic proteases of the Plasmodium falciparum digestive vacuole. Molec. Biochem. Parasitol. 1996;79:71–78. doi: 10.1016/0166-6851(96)02651-5. [DOI] [PubMed] [Google Scholar]
- 38.Johansson PO, Lindberg J, Blackman MJ, Kvarnstrom I, Vrang L, Hamelink E, Hallberg A, Rosenquist A, Samuelsson B. Design and synthesis of potent inhibitors of plasmepsin I and II: X-ray crystal structure of inhibitor in complex with plasmepsin II. J. Med. Chem. 2005;48:4400–4409. doi: 10.1021/jm040884n. [DOI] [PubMed] [Google Scholar]
- 39.Cooper J, Foundling S, Hemmings A, Blundell T, Jones DM, Hallett A, Szelke M. The structure of a synthetic pepsin inhibitor complexed with endothiapepsin. Eur. J. Biochem. 1987;169:215–221. doi: 10.1111/j.1432-1033.1987.tb13600.x. [DOI] [PubMed] [Google Scholar]
- 40.Prade L, A.F. J, Boss C, Richard-Bildstein S, Meyer S, Binkert C, Bur D. X-ray structure of plasmepsin II complexed with a potent achiral inhibitor. J. Biol. Chem. 2005;280:23837–23843. doi: 10.1074/jbc.M501519200. [DOI] [PubMed] [Google Scholar]
- 41.Bjelic S, Nervall M, Gutierrez-de-Teran H, Ersmark K, Hallberg A, Aqvist J. Computational inhibitor design against malaria plasmepsins. Cell Mol. Life Sci. 2007;64:2285–2305. doi: 10.1007/s00018-007-7102-2. [DOI] [PMC free article] [PubMed] [Google Scholar]
- 42.Ferrara P, Jacoby E. Evaluation of the utility of homology models in high throughput docking. J. Mol. Model. 2007;13:897–905. doi: 10.1007/s00894-007-0207-6. [DOI] [PubMed] [Google Scholar]
- 43.Beyer BM, Dunn BM. Self-activation of recombinant human lysosomal procathepsin D at a newly engineered cleavage junction, “short” pseudocathepsin D. J. Biol. Chem. 1996;271:15590–15596. doi: 10.1074/jbc.271.26.15590. [DOI] [PubMed] [Google Scholar]
- 44.Krogstad DJ, Schlesinger PH, Gluzman IY. Antimalarials increase vesicle pH in Plasmodium falciparum. J. Cell Biol. 1985;101:2302–2309. doi: 10.1083/jcb.101.6.2302. [DOI] [PMC free article] [PubMed] [Google Scholar]
- 45.Yayon A, Cabantchik ZI, Ginsburg H. Identification of the acidic compartment of Plasmodium falciparum-infected human erythrocytes as the target of the antimalarial drug chloroquine. EMBO J. 1984;3:2695–2700. doi: 10.1002/j.1460-2075.1984.tb02195.x. [DOI] [PMC free article] [PubMed] [Google Scholar]
- 46.Francis SE, Sullivan DJ, Goldberg DE. Hemoglobin metabolism in the malaria parasite Plasmodium falciparum. Ann. Rev. of Micro. 1997;51:97–123. doi: 10.1146/annurev.micro.51.1.97. [DOI] [PubMed] [Google Scholar]
- 47.Gluzman IY, Francis SE, Oksman A, Smith CE, Duffin KL, Goldberg DE. Order and specificity of the Plasmodium falciparum hemoglobin degradation pathway. J. Clin. Invest. 1994;93:1602–1608. doi: 10.1172/JCI117140. [DOI] [PMC free article] [PubMed] [Google Scholar]
- 48.Siripurkpong P, Yuvaniyama J, Wilairat P, Goldberg DE. Active site contribution to specificity of the aspartic proteases plasmepsins I and II. J. Biol. Chem. 2002;277:41009–41013. doi: 10.1074/jbc.M204852200. [DOI] [PubMed] [Google Scholar]
- 49.Gasteiger E, Gattiker A, Hoogland C, Ivanyi I, Appel RD, Bairoch A. ExPASy: the proteomics server for in-depth protein knowledge and analysis. Nuc. Acids Res. 2003;31:3784–3788. doi: 10.1093/nar/gkg563. [DOI] [PMC free article] [PubMed] [Google Scholar]
Associated Data
This section collects any data citations, data availability statements, or supplementary materials included in this article.